


Nevada King Gold Corp. (TSX-V: NKG) (OTCQX: NKGFF) is pleased to announce assay results from three, vertical reverse circulation holes recently completed at its Atlanta Gold Mine Project located 264km northeast of Las Vegas, Nevada, in the prolific Battle Mountain Trend. These holes were drilled northwest of the Atlanta pit to fill-in drill hole gaps across the northern part of the West Atlanta Graben Zone identifed in Section 22-15N initially reported on April 27, 2023. The three holes reported today are plotted on plan and section in Figures 2 and 3.
Highlights:
| Hole No. | From (m) | To (m) | Interval (m) | Au (g/t) | Ag (g/t) |
| AT23WS-44 | 214.9 | 323.2 | 108.2 | 11.64 | 17.4 |
| Includes | 274.4 | 303.4 | 29.0 | 37.16 | 34.4 |
| Includes | 283.5 | 286.6 | 3.0 | 162.6 | 15.6 |
Table 1. Highlight hole released today. This hole is interpreted to have intersected a sub vertical feeder zone cutting through a flat-lying horizon of mineralization that generally dips westward. For discussion of true thickness, see detailed interpretation section and accompanying discussion below.
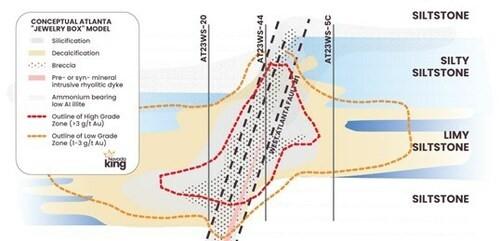
Figure 1. Conceptual cross section across high-grade feeder zone hit in AT23WS-44 utilizing a well known, generalized Carlin-type geological model. Gold is preferentially deposited within the 70m to 100m thick replacement horizon consisting of receptive carbonate beds, while the high-grade core forms around the structural intersection of this near-horizontal replacement horizon with the West Atlanta Fault #1 that served as the feeder structure that channeled mineralizing fluids into the receptive horizon. Figure adapted from: Robert et al (2007), and Zhou (2009), “Multi-scale integrated application of spectral geology and remote sensing for mineral exploration,” Conference Exploration 17, Toronto, 2017.
| Hole No. | From (m) | To (m) | Interval (m) | Au (g/t) | AuCN (g/t) | Ag (g/t) |
| AT23WS-44 | 274.4 | 275.9 | 1.5 | 25.92 | 22.23 | 14.3 |
| AT23WS-44 | 275.9 | 277.4 | 1.5 | 22.52 | 18.81 | 13.7 |
| AT23WS-44 | 277.4 | 279.0 | 1.5 | 16.60 | 16.06 | 17.6 |
| AT23WS-44 | 279.0 | 280.5 | 1.5 | 30.00 | 25.08 | 21.3 |
| AT23WS-44 | 280.5 | 282.0 | 1.5 | 57.15 | 43.99 | 14.2 |
| AT23WS-44 | 282.0 | 283.5 | 1.5 | 34.57 | 28.12 | 13.4 |
| AT23WS-44 | 283.5 | 285.1 | 1.5 | 169.80 | >100 | 13.2 |
| AT23WS-44 | 285.1 | 286.6 | 1.5 | 155.40 | >100 | 18 |
| AT23WS-44 | 286.6 | 288.1 | 1.5 | 47.95 | 41.80 | 40.2 |
| AT23WS-44 | 288.1 | 289.6 | 1.5 | 13.20 | 11.78 | 27.5 |
| AT23WS-44 | 289.6 | 291.2 | 1.5 | 13.88 | 11.97 | 23.5 |
| AT23WS-44 | 291.2 | 292.7 | 1.5 | 6.68 | 5.31 | 33.2 |
| AT23WS-44 | 292.7 | 294.2 | 1.5 | 11.92 | 9.60 | 46.6 |
| AT23WS-44 | 294.2 | 295.7 | 1.5 | 18.05 | 15.87 | 42.8 |
| AT23WS-44 | 295.7 | 297.3 | 1.5 | 13.55 | 11.02 | 42.9 |
| AT23WS-44 | 297.3 | 298.8 | 1.5 | 11.22 | 10.17 | 75.8 |
| AT23WS-44 | 298.8 | 300.3 | 1.5 | 13.37 | 11.50 | 47.3 |
| AT23WS-44 | 300.3 | 301.8 | 1.5 | 19.60 | 14.73 | 64.3 |
| AT23WS-44 | 301.8 | 303.4 | 1.5 | 25.12 | 20.05 | 83.6 |
Table 2. Assay results for 29m thick high grade oxide interval averaging 37.16g/t Au in AT23WS-044 on a 1.52m basis. Gold grades being reported are based on averaging the 30gm ICP analyses with the corresponding gravimetric analyses.
Cal Herron, Exploration Manager of Nevada King, stated, “Today’s high-grade interval in AT23WS-44 gives us another starting point for tracking higher-grades proximal to high-angle feeder structures cutting up through the flat lying horizons that correlate to stratigraphy hosting most of the gold at Atlanta – namely the silica breccia and overlying silicified volcanic horizons. As seen in Figures 1 and 3, the rhyolitic intrusive breccia hosting the highest grade mineralization in the hole probably intruded along the WAF1 and will be easy to visually track in the up-coming offset holes of AT23WS-44 that will be drilled to further expand upon this “bonanza grade” mineralization. It is important to note that the high-grade “core” mineralization seen in AT23WS-44 (29m @ 37.16 g/t Au) is not related to a narrow vein that was drilled down, but rather occurs within the same flat-lying replacement horizon penetrated in surrounding holes at similar elevation – i.e. 1741m–1770m a.s.l (above sea level). For example, nearby holes in the northern portion of the WAGZ intersected the following high-grade mineralization –
Elsewhere within the Atlanta resource zone we see very similar elevation control over high-grade mineralization. Examples near the East Atlanta Fault within the AMFZ include –
The same pattern is apparent across the southern portion of the WAGZ –
The high grade intercepts cited above occur within discrete groups or clusters located across the entire resource zone, with holes in each cluster sharing the same elevation ranges. This argues strongly for the high-grades being hosted within near-horizontal replacement horizons versus narrow, high-angle faults/veins. If these intercepts occurred along high-angle fault surfaces, we would not see a uniform horizontal geometry, instead the intercept elevations within an individual cluster of holes proximal to each other would indicate a steeply dipping plane. Close-spaced drilling along suspected high-grade zones has now provided Nevada King with enough information to concentrate on drill-defining these relatively narrow (<20m wide) but very high-grade, linear intersection zones involving high-angle “feeder” faults and flat-lying replacement horizons.”
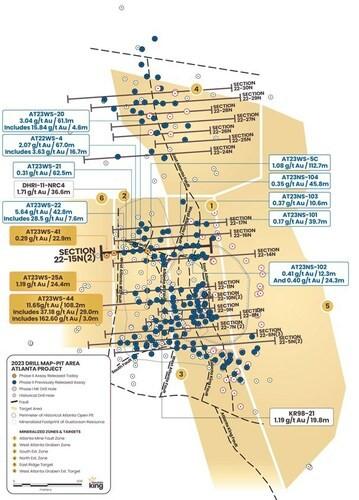
Figure 2. Location map for holes reported in this news release along drill Section22-15N(2) relative to the perimeter of the historical Atlanta Pit and footprint of the Gustavson 2020 NI 43-101 resource. Shallow drillholes on the mine dumps have been removed from the plot for clarity.
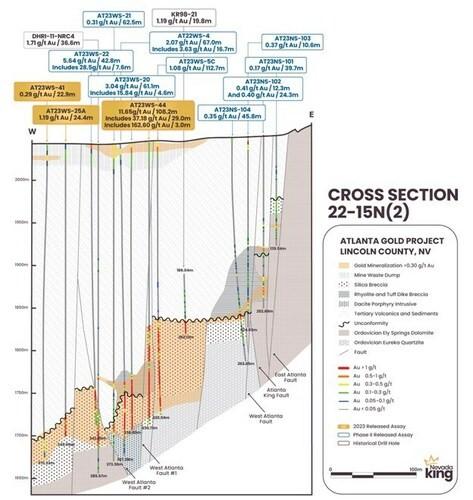
Figure 3. Cross section 22-15N(2) looking north across the northern portion of the Atlanta Mine Fault Zone and West Atlanta Graben Zone.
Additional Details:
Detailed Interpretation:
The Company’s interpretation of today’s highlight interval is that gold mineralizing fluids have migrated laterally from the high-angle WAF1 (the feeder structure) into a larger receptive, flat-lying breccia horizon with gold grades generally decreasing gradationally with horizontal distance from the feeder structure (Figure 1). The Company does not have sufficient data to accurately estimate true width of the high grade feeder structure, but true thickness of the high grade zones within the overall flat-lying mineralized horizon is far more apparent. As an example, simply comparing the 29m-thick high grade intercept (37.16 g/t Au) in AT23WS-44 with the 27.4m high grade intercept (4.67 g/t Au) in AT23WS-20 illustrates the flat-lying nature of the high grade horizon connecting these two holes. The mineralized zone in AT23WS-44 starts at an elevation of 1770m a.s.l. (above sea level) while the same mineralized horizon in AT23WS-20, located 21m to the west of AT23WS-44, starts at an elevation of 1758m a.s.l. This flat-lying geometry to the replacement horizon is noted throughout the Atlanta deposit as discussed above.
| Hole No. | From (m) | To (m) | Interval (m) | Au (g/t) | Ag (g/t) |
| AT23WS-44 | 214.9 | 216.5 | 1.5 | 1.47 | <0.5 |
| AT23WS-44 | 216.5 | 218.0 | 1.5 | 1.51 | <0.5 |
| AT23WS-44 | 218.0 | 219.5 | 1.5 | 2.72 | <0.5 |
| AT23WS-44 | 219.5 | 221.0 | 1.5 | 1.70 | <0.5 |
| AT23WS-44 | 221.0 | 222.6 | 1.5 | 0.85 | <0.5 |
| AT23WS-44 | 222.6 | 224.1 | 1.5 | 0.40 | <0.5 |
| AT23WS-44 | 224.1 | 225.6 | 1.5 | 0.26 | <0.5 |
| AT23WS-44 | 225.6 | 227.1 | 1.5 | 0.27 | <0.5 |
| AT23WS-44 | 227.1 | 228.7 | 1.5 | 0.72 | 0.8 |
| AT23WS-44 | 228.7 | 230.2 | 1.5 | 0.76 | 0.9 |
| AT23WS-44 | 230.2 | 231.7 | 1.5 | 0.33 | 2.1 |
| AT23WS-44 | 231.7 | 233.2 | 1.5 | 0.24 | 2.9 |
| AT23WS-44 | 233.2 | 234.8 | 1.5 | 0.39 | 2.5 |
| AT23WS-44 | 234.8 | 236.3 | 1.5 | 0.22 | 2.5 |
| AT23WS-44 | 236.3 | 237.8 | 1.5 | 0.24 | 5 |
| AT23WS-44 | 237.8 | 239.3 | 1.5 | 0.51 | 8.1 |
| AT23WS-44 | 239.3 | 240.9 | 1.5 | 1.26 | 8 |
| AT23WS-44 | 240.9 | 242.4 | 1.5 | 1.83 | 9.2 |
| AT23WS-44 | 242.4 | 243.9 | 1.5 | 3.41 | 9.1 |
| AT23WS-44 | 243.9 | 245.4 | 1.5 | 5.85 | 15.5 |
| AT23WS-44 | 245.4 | 247.0 | 1.5 | 3.84 | 9 |
| AT23WS-44 | 247.0 | 248.5 | 1.5 | 3.57 | 7.1 |
| AT23WS-44 | 248.5 | 250.0 | 1.5 | 1.82 | 4.9 |
| AT23WS-44 | 250.0 | 251.5 | 1.5 | 2.15 | 6.9 |
| AT23WS-44 | 251.5 | 253.0 | 1.5 | 6.68 | 11.6 |
| AT23WS-44 | 253.0 | 254.6 | 1.5 | 9.88 | 18.3 |
| AT23WS-44 | 254.6 | 256.1 | 1.5 | 5.72 | 12.7 |
| AT23WS-44 | 256.1 | 257.6 | 1.5 | 3.23 | 12.2 |
| AT23WS-44 | 257.6 | 259.1 | 1.5 | 0.35 | 7.5 |
| AT23WS-44 | 259.1 | 260.7 | 1.5 | 0.09 | 6.3 |
| AT23WS-44 | 260.7 | 262.2 | 1.5 | 0.13 | 6.1 |
| AT23WS-44 | 262.2 | 263.7 | 1.5 | 0.15 | 5.8 |
| AT23WS-44 | 263.7 | 265.2 | 1.5 | 0.31 | 14.6 |
| AT23WS-44 | 265.2 | 266.8 | 1.5 | 0.54 | 12.2 |
| AT23WS-44 | 266.8 | 268.3 | 1.5 | 0.81 | 25.2 |
| AT23WS-44 | 268.3 | 269.8 | 1.5 | 0.98 | 20.6 |
| AT23WS-44 | 269.8 | 271.3 | 1.5 | 1.35 | 25.7 |
| AT23WS-44 | 271.3 | 272.9 | 1.5 | 1.54 | 11 |
| AT23WS-44 | 272.9 | 274.4 | 1.5 | 8.96 | 12.1 |
| AT23WS-44 | 274.4 | 275.9 | 1.5 | 25.92 | 14.3 |
| AT23WS-44 | 275.9 | 277.4 | 1.5 | 22.52 | 13.7 |
| AT23WS-44 | 277.4 | 279.0 | 1.5 | 16.60 | 17.6 |
| AT23WS-44 | 279.0 | 280.5 | 1.5 | 30.00 | 21.3 |
| AT23WS-44 | 280.5 | 282.0 | 1.5 | 57.15 | 14.2 |
| AT23WS-44 | 282.0 | 283.5 | 1.5 | 34.57 | 13.4 |
| AT23WS-44 | 283.5 | 285.1 | 1.5 | 169.80 | 13.2 |
| AT23WS-44 | 285.1 | 286.6 | 1.5 | 155.40 | 18 |
| AT23WS-44 | 286.6 | 288.1 | 1.5 | 47.95 | 40.2 |
| AT23WS-44 | 288.1 | 289.6 | 1.5 | 13.20 | 27.5 |
| AT23WS-44 | 289.6 | 291.2 | 1.5 | 13.88 | 23.5 |
| AT23WS-44 | 291.2 | 292.7 | 1.5 | 6.68 | 33.2 |
| AT23WS-44 | 292.7 | 294.2 | 1.5 | 11.92 | 46.6 |
| AT23WS-44 | 294.2 | 295.7 | 1.5 | 18.05 | 42.8 |
| AT23WS-44 | 295.7 | 297.3 | 1.5 | 13.55 | 42.9 |
| AT23WS-44 | 297.3 | 298.8 | 1.5 | 11.22 | 75.8 |
| AT23WS-44 | 298.8 | 300.3 | 1.5 | 13.37 | 47.3 |
| AT23WS-44 | 300.3 | 301.8 | 1.5 | 19.60 | 64.3 |
| AT23WS-44 | 301.8 | 303.4 | 1.5 | 25.12 | 83.6 |
| AT23WS-44 | 303.4 | 304.9 | 1.5 | 8.11 | 93.3 |
| AT23WS-44 | 304.9 | 306.4 | 1.5 | 7.41 | 66.1 |
| AT23WS-44 | 306.4 | 307.9 | 1.5 | 2.38 | 10.0 |
| AT23WS-44 | 307.9 | 309.5 | 1.5 | 1.79 | 8.8 |
| AT23WS-44 | 309.5 | 311.0 | 1.5 | 1.67 | 12.6 |
| AT23WS-44 | 311.0 | 312.5 | 1.5 | 0.88 | 8.7 |
| AT23WS-44 | 312.5 | 314.0 | 1.5 | 1.29 | 5.4 |
| AT23WS-44 | 314.0 | 315.5 | 1.5 | 1.22 | 6.3 |
| AT23WS-44 | 315.5 | 317.1 | 1.5 | 6.38 | 12.8 |
| AT23WS-44 | 317.1 | 318.6 | 1.5 | 6.81 | 20.0 |
| AT23WS-44 | 318.6 | 320.1 | 1.5 | 2.01 | 11.2 |
| AT23WS-44 | 320.1 | 321.6 | 1.5 | 2.09 | 15.5 |
| AT23WS-44 | 321.6 | 323.2 | 1.5 | 1.39 | 11.4 |
Table 3. Assay results for 108m thick high-grade oxide interval averaging 11.65 g/t Au in AT23WS-44 on a 1.52m basis.
| Hole No. | From (m) | To (m) | Interval (m) | Au (g/t) | Ag (g/t) | Notes |
| AT23WS-44 | 214.9 | 323.2 | 108.2 | 11.65 | 17.4 | |
| Includes | 274.4 | 303.4 | 29.0 | 37.18 | 34.4 | |
| Includes | 283.5 | 286.6 | 3.0 | 162.6 | 15.6 | |
| AT23WS-25A | 318.6 | 343.0 | 24.4 | 1.19 | 11.7 | Bottomed in Mineralization |
| AT23WS-41 | 335.4 | 358.2 | 22.9 | 0.29 | 15.1 |
Table 4. All holes reported today along Section22-15N. Mineralization occurs along flat-lying horizons generally dipping gently westward; true mineralized thickness in vertical holes is estimated to be between 85% and 95% of reported drill intercept length.
| Hole No. | From (m) | To (m) | Interval (m) | Au (g/t) | Ag (g/t) | Notes |
| AT23WS-22 | 288.0 | 330.8 | 42.8 | 5.64 | 6.7 | Bottomed in Mineralization |
| Includes | 292.7 | 300.3 | 7.6 | 28.5 | 10.7 | |
| AT23WS-21 | 280.5 | 343.0 | 62.5 | 0.31 | 3.3 | |
| AT22WS-4 | 279.0 | 346.0 | 67.0 | 2.07 | 12.1 | |
| Includes | 317.1 | 333.8 | 16.7 | 3.63 | 12.6 | |
| AT23WS-20 | 275.9 | 337.0 | 61.1 | 3.04 | 21.4 | Bottomed in Mineralization |
| Includes | 286.6 | 291.2 | 4.6 | 15.84 | 19.8 | |
| AT23WS-5C | 207.3 | 320.0 | 112.7 | 1.08 | 14.8 | Bottomed in Mineralization |
| AT23NS-104 | 198.2 | 244.0 | 45.8 | 0.35 | 5.0 | |
| AT23NS-103 | 192.1 | 202.7 | 10.6 | 0.37 | 3.4 | |
| AT23NS-102 | 129.5 | 141.8 | 12.3 | 0.41 | 23.4 | |
| And | 166.2 | 190.5 | 24.3 | 0.40 | 5.2 | |
| AT23NS-101 | 71.6 | 111.3 | 39.7 | 0.17 | 19.1 |
Table 5. Previously reported holes used along updated Section 22-15N. AT22 series holes were drilled by Nevada King in 2022 and the AT21 series holes were drilled in 2021. True thickness of gold mineralization interpreted in today’s release is 95% to 100% of the reported intercept length in vertical holes. *Denotes holes that bottomed in mineralization. ^Denotes angle hole.
| Hole No. | From (m) | To (m) | Interval (m) | Au (g/t) | Ag (g/t) | Notes |
| DHRI-11-NRC4 | 317.1 | 353.7 | 36.6 | 1.71 | 6.8 | |
| KR98-21* | 242.4 | 262.2 | 19.8 | 1.19 | 1.6 | Bottomed in Mineralization |
Table 6: Historical holes used in Section 22-15N. KR98 series hole was drilled by Kinross in 1998. DHRI series hole was drilled by Meadow Bay in 2011. Mineralization occurs along flat-lying horizons generally dipping gently westward; true mineralized thickness in vertical holes is estimated to be between 85% and 95% of reported drill intercept length.
*Denotes angle hole.
QA/QC Protocols
All Reverse Circulation samples from the Atlanta Project are taken at 1.5 m intervals, split at the drill site and placed in cloth and plastic bags utilizing a nominal 2kg sample weight. Certified Reference Material (CRM) standards, blanks, and blind duplicates are inserted into the sample stream on-site on a one-in-twenty sample basis, meaning all three control inserts are included in each 20-sample group. Samples are shipped by a local contractor in large sample shipping crates directly to American Assay Lab in Reno, Nevada, with full custody being maintained at all times. At AAL, samples were weighed then crushed to 75% passing 2mm and pulverized to 85% passing 75 microns in order to produce a 300g pulverized split. Prepared samples are initially run using a four acid + boric acid digestion process and conventional multi-element ICP-OES analysis. Gold assays are initially run using 30-gram samples by lead fire assay with an OES finish to a 0.003 ppm detection limit, with samples greater than 10 ppm finished gravimetrically. Every sample is also run through a cyanide leach for gold with an ICP-OES finish. For Au values above 10 g/t, AAL routinely re-assays samples using a 30gm gravimetric fire assay. For the 29m high grade interval in AT23WS-44, AAL inserted three lab duplicates that results in percent differences of 1.80%, 2.48%, and 2.59%. No visible gold was logged in this hole. Sample weights were consistent.
Table 7 contains the complete assay report for the interval 195.1m to T.D. at 330.8m for AT23WS-44 showing sample weights as received at American Assay Lab plus lab blank, duplicate, and CRM standards along with Nevada King’s inserted field blanks, duplicates, and CRM standards. The high grade intervals were assayed by 30gm fire with ICP finish and then check-assayed via 30 gm gravimetric fire assay. Gold cyanide solubility assays were performed on every sample. As seen in Table 6, the 30gm ICP analyses match closely with the gravimetric analyses, indicating minimal nugget effect and high reproducibility. The consistent Au cyanide analyses indicate strong oxidation and little evidence of significant sulfide encapsulation. Fairly consistent sample weights indicate good, overall RC recovery, particularly within the very high grade intervals, to the extent that down-hole contamination from upper high grade intervals is unlikely. When 10m to 20m lengths of low sample weights occur, or sustained lack of sample recovery occurs, then down-hole contamination is more likely to occur. This is not the case with AT23WS-44.
| Wt | Au | Au | Au | ||||
| BRPP2KG | FAPB30-ICP | GRAVAu30 | AuCN30 | ||||
| 0.01 | 0.003 | 0.103 | 0.01 | ||||
| SAMPLES | Comments | From (m) | To (m) | Weight (kg) | ppm | ppm | ppm |
| 1880368 | 195.1 | 201.2 | 5.30 | -0.003 | -0.01 | ||
| 1880368-X | AAL dup of 1880368 | 0.003 | -0.01 | ||||
| 1880369 | 201.2 | 207.3 | 7.90 | 0.011 | 0.01 | ||
| 1880370 | 207.3 | 213.4 | 6.50 | -0.003 | -0.01 | ||
| 1880371 | 213.4 | 214.9 | 1.30 | 0.047 | 0.05 | ||
| 1880372 | 214.9 | 216.5 | 4.40 | 1.470 | 1.46 | ||
| 1880373 | 216.5 | 218.0 | 6.70 | 1.510 | 1.12 | ||
| 1880374 | 218.0 | 219.5 | 2.00 | 2.720 | 2.44 | ||
| 1880375 | NKG dup of 1880374 | 1.20 | 3.490 | 2.63 | |||
| 1880376 | 219.5 | 221.0 | 7.90 | 1.700 | 1.29 | ||
| STD- OxC168 | AAL STD (0.213 g/t Au) | 0.223 | 0.22 | ||||
| 1880377 | 221.0 | 222.6 | 0.90 | 0.848 | 0.65 | ||
| 1880377-X | AAL dup. of 1880377 | 0.832 | 0.64 | ||||
| 1880378 | 222.6 | 224.1 | 5.80 | 0.399 | 0.37 | ||
| 1880379 | 224.1 | 225.6 | 3.20 | 0.260 | 0.24 | ||
| 1880380 | NKG blank | 0.70 | 0.005 | -0.01 | |||
| 1880381 | 225.6 | 227.1 | 4.60 | 0.271 | 0.24 | ||
| 1880382 | 227.1 | 228.7 | 3.60 | 0.720 | 0.65 | ||
| 1880383 | 228.7 | 230.2 | 6.50 | 0.759 | 0.60 | ||
| 1880384 | 230.2 | 231.7 | 5.40 | 0.325 | 0.26 | ||
| 1880385 | NKG STD (1.081 g/t Au) | 1.110 | 0.96 | ||||
| 1880386 | 231.7 | 233.2 | 6.60 | 0.243 | 0.20 | ||
| 1880387 | 233.2 | 234.8 | 1.60 | 0.390 | 0.32 | ||
| 1880388 | 234.8 | 236.3 | 3.70 | 0.220 | 0.17 | ||
| BLANK | AAL blank | -0.003 | -0.01 | ||||
| 1880389 | 236.3 | 237.8 | 2.70 | 0.236 | 0.23 | ||
| 1880390 | NKG dup of 1880389 | 4.00 | 0.319 | 0.23 | |||
| 1880390-X | AAL dup of 1880390 | 0.306 | 0.24 | ||||
| 1880391 | 237.8 | 239.3 | 7.70 | 0.508 | 0.46 | ||
| 1880392 | 239.3 | 240.9 | 2.70 | 1.260 | 1.07 | ||
| 1880393 | 240.9 | 242.4 | 3.40 | 1.830 | 1.52 | ||
| 1880394 | 242.4 | 243.9 | 7.60 | 3.410 | 2.76 | ||
| 1880395 | 243.9 | 245.4 | 6.20 | 5.850 | 5.04 | ||
| 1880396 | 245.4 | 247.0 | 3.50 | 3.840 | 3.39 | ||
| 1880397 | 247.0 | 248.5 | 6.20 | 3.570 | 3.06 | ||
| 1880398 | 248.5 | 250.0 | 5.70 | 1.820 | 1.57 | ||
| STD- CDN-CM-47 | AAL STD (1.13 g/t Au) | 1.140 | 1.06 | ||||
| 1880399 | 250.0 | 251.5 | 7.60 | 2.150 | 1.73 | ||
| 1880399-X | AAL dup. of 1880399 | 2.210 | 1.67 | ||||
| 1880400 | 251.5 | 253.0 | 2.70 | 6.680 | 6.44 | ||
| 1880401 | 253.0 | 254.6 | 7.10 | 9.880 | 8.29 | ||
| 1880402 | 254.6 | 256.1 | 5.80 | 5.720 | 5.62 | ||
| 1880403 | 256.1 | 257.6 | 4.30 | 3.230 | 2.97 | ||
| 1880404 | 257.6 | 259.1 | 1.60 | 0.348 | 0.30 | ||
| 1880405 | NKG dup. of 1880404 | 3.00 | 0.213 | 0.20 | |||
| 1880406 | 259.1 | 260.7 | 4.60 | 0.088 | 0.07 | ||
| 1880406-X | AAL dup. of 1880406 | 0.090 | 0.07 | ||||
| BLANK | AAL blank | -0.003 | -0.01 | ||||
| 1880407 | 260.7 | 262.2 | 0.90 | 0.128 | 0.10 | ||
| 1880408 | 262.2 | 263.7 | 2.50 | 0.146 | 0.08 | ||
| 1880409 | 263.7 | 265.2 | 2.50 | 0.311 | 0.30 | ||
| 1880410 | NKG blank | 0.60 | 0.003 | -0.01 | |||
| 1880411 | 265.2 | 266.8 | 5.60 | 0.542 | 0.42 | ||
| 1880412 | 266.8 | 268.3 | 4.90 | 0.808 | 0.67 | ||
| 1880413 | 268.3 | 269.8 | 2.10 | 0.975 | 0.75 | ||
| 1880414 | 269.8 | 271.3 | 3.70 | 1.350 | 1.30 | ||
| 1880415 | NKG STD (0.056 g/t Au) | 0.071 | 0.05 | ||||
| 1880416 | 271.3 | 272.9 | 1.30 | 1.540 | 1.43 | ||
| 1880417 | 272.9 | 274.4 | 2.20 | 8.960 | 7.45 | ||
| 1880417-X | AAL dup of 1880417 | 8.800 | 7.17 | ||||
| 1880418 | 274.4 | 275.9 | 3.20 | 25.500 | 26.333 | 22.23 | |
| 1880419 | 275.9 | 277.4 | 2.70 | 22.500 | 22.533 | 18.81 | |
| 1880420 | NKG dup of 1880419 | 3.80 | 20.900 | 22.200 | 18.81 | ||
| 1880421 | 277.4 | 279.0 | 2.80 | 16.200 | 17.000 | 16.06 | |
| 1880422 | 279.0 | 280.5 | 1.40 | 29.800 | 30.200 | 25.08 | |
| STD – SK120 | AAL STD (4.075 g/t Au) | 4.030 | 3.95 | ||||
| 1880423 | 280.5 | 282.0 | 6.90 | 57.100 | 57.200 | 43.99 | |
| 1880423-X | AAL dup of 1880423 | 55.700 | 42.47 | ||||
| 1880424 | 282.0 | 283.5 | 6.30 | 34.600 | 34.533 | 28.12 | |
| 1880425 | 283.5 | 285.1 | 7.30 | >100 | 169.800 | >100 | |
| 1880426 | 285.1 | 286.6 | 5.60 | >100 | 155.400 | >100 | |
| 1880427 | 286.6 | 288.1 | 6.80 | 47.600 | 48.067 | 41.80 | |
| 1880428 | 288.1 | 289.6 | 4.30 | 12.600 | 13.400 | 11.78 | |
| 1880429 | 289.6 | 291.2 | 1.20 | 13.500 | 14.000 | 11.97 | |
| 1880430 | 291.2 | 292.7 | 8.20 | 6.680 | 5.31 | ||
| 1880431 | 292.7 | 294.2 | 7.00 | 11.700 | 12.133 | 9.60 | |
| 1880431-X | AAL dup of 1880431 | 11.400 | 9.50 | ||||
| 1880432 | 294.2 | 295.7 | 0.90 | 17.900 | 18.200 | 15.87 | |
| 1880433 | 295.7 | 297.3 | 5.50 | 13.300 | 13.800 | 11.02 | |
| 1880434 | 297.3 | 298.8 | 4.50 | 11.100 | 11.333 | 10.17 | |
| 1880435 | NKG dup of 1880434 | 3.40 | 11.900 | 12.267 | 10.07 | ||
| STD – OxC168 | AAL STD (0.213 g/t Au) | 0.222 | 0.22 | ||||
| 1880436 | 298.8 | 300.3 | 1.00 | 13.400 | 13.333 | 11.50 | |
| 1880437 | 300.3 | 301.8 | 3.70 | 20.000 | 19.200 | 14.73 | |
| 1880438 | 301.8 | 303.4 | 1.20 | 24.500 | 25.733 | 20.05 | |
| 1880439 | 303.4 | 304.9 | 1.30 | 8.110 | 7.09 | ||
| 1880440 | NKG blank | 0.60 | -0.003 | -0.01 | |||
| 1880441 | 304.9 | 306.4 | 1.00 | 7.410 | 6.03 | ||
| 1880441-X | AAL dup of 1880441 | 7.180 | 6.07 | ||||
| 1880442 | 306.4 | 307.9 | 1.70 | 2.380 | 1.96 | ||
| 1880443 | 307.9 | 309.5 | 1.50 | 1.790 | 1.54 | ||
| 1880444 | 309.5 | 311.0 | 6.00 | 1.670 | 1.38 | ||
| 1880445 | NKG STD (0.056 g/t Au) | 0.062 | 0.05 | ||||
| 1880446 | 311.0 | 312.5 | 4.20 | 0.875 | 0.70 | ||
| BLANK | AAL blank | -0.003 | -0.01 | ||||
| 1880447 | 312.5 | 314.0 | 1.60 | 1.290 | 1.02 | ||
| 1880447-X | AAL dup of 1880447 | 1.280 | 1.04 | ||||
| 1880448 | 314.0 | 315.5 | 4.80 | 1.220 | 1.00 | ||
| 1880449 | 315.5 | 317.1 | 1.80 | 6.380 | 5.44 | ||
| 1880450 | NKG dup of 1880449 | 2.10 | 6.460 | 5.16 | |||
| 1880451 | 317.1 | 318.6 | 2.20 | 6.810 | 5.61 | ||
| 1880452 | 318.6 | 320.1 | 4.00 | 2.010 | 1.75 | ||
| 1880453 | 320.1 | 321.6 | 5.40 | 2.090 | 1.79 | ||
| 1880454 | 321.6 | 323.2 | 5.50 | 1.390 | 1.10 | ||
| 1880455 | 323.2 | 324.7 | 3.90 | 0.195 | 0.16 | ||
| 1880456 | 324.7 | 326.2 | 3.40 | 0.286 | 0.20 | ||
| 1880456-X | AAL dup. of 1880456 | 0.277 | 0.20 | ||||
| STD – CDN-CM-47 | AAL STD (1.13 g/t Au) | 1.150 | 0.93 | ||||
| 1880457 | 326.2 | 327.7 | 5.30 | 0.110 | 0.09 | ||
| 1880458 | 327.7 | 329.3 | 3.30 | 0.460 | 0.39 | ||
| 1880459 | 329.3 | 330.8 | 3.70 | 0.292 | 0.24 |
Table 7. Assay report table from American Assay Lab (AAL) for RC hole AT23WS-044 with AAL’s CRM (STD), blank, and duplicate (dup.) sample inserts and Nevada King’s (NKG) field inserts.
AAL-inserted CRM Standards:
CDM-CM-47 1.13 g/t Au +/- 0.11 g/t Canadian Resource Lab. Ltd., Langley B.C.
OxC168 0.213 g/t Au +/- 0.002 g/t Rock Labs, Auckland NZ
SK120 4.075 g/t Au +/- 0.03 g/t Rock Labs, Auckland NZ
NKG-inserted CRM Standards:
Batch # 75226 0.056 g/t Au +/- 0.003 g/t Klen International Pty. Ltd., Neerabup Western Australia
Batch # 73915 1.081 g/t Au +/- 0.03 g/t Klen International Pty. Ltd., Neerabup Western Australia
Qualified Person
The scientific and technical information in this news release has been reviewed and approved by Calvin R. Herron, P.Geo., who is a Qualified Person as defined by NI 43-101.
About Nevada King Gold Corp.
Nevada King is the third largest mineral claim holder in the State of Nevada, behind Nevada Gold Mines (Barrick/Newmont) and Kinross Gold. Starting in 2016, the Company has staked large project areas hosting significant historical exploration work along the Battle Mountain trend located close to current or former producing gold mines. These project areas were initially targeted based on their potential for hosting multi-million-ounce gold deposits and were subsequently staked following a detailed geological evaluation. District-scale projects in Nevada King’s portfolio include (1) the 100% owned Atlanta Mine, located 100km southeast of Ely, (2) the Lewis and Horse Mountain-Mill Creek projects, both located between Nevada Gold Mines’ large Phoenix and Pipeline mines, and (3) the Iron Point project, located 35km east of Winnemucca, Nevada.
The Atlanta Mine is a historical gold-silver producer with a NI 43-101 compliant pit-constrained resource of 460,000 oz Au in the measured and indicated category (11.0M tonnes at 1.3 g/t) plus an inferred resource of 142,000 oz Au (5.3M tonnes at 0.83 g/t). See the NI 43-101 Technical Report on Resources titled “Atlanta Property, Lincoln County, NV” with an effective date of October 6, 2020, and a report date of December 22, 2020, as prepared by Gustavson Associates and filed under the Company’s profile on SEDAR+ (www.sedarplus.ca).
| Resource Category | Tonnes
(000s) |
Au Grade
(ppm) |
Contained Au Oz |
Ag Grade
(ppm) |
Contained Ag Oz |
| Measured | 4,130 | 1.51 | 200,000 | 14.0 | 1,860,000 |
| Indicated | 6,910 | 1.17 | 260,000 | 10.6 | 2,360,000 |
| Measured + Indicated | 11,000 | 1.30 | 460,000 | 11.9 | 4,220,000 |
| Inferred | 5,310 | 0.83 | 142,000 | 7.3 | 1,240,000 |
Table 8. NI 43-101 Mineral Resources at the Atlanta Mine
CPM Group’s 10-Year Copper Outlook are now available. ... READ MORE
Arizona Gold and Silver Inc. (TSX-V: AZS) (OTCQB: AZASF) is ple... READ MORE
Brixton Metals Corporation (TSX-V: BBB) (OTCQX: BBBXF) is pleased... READ MORE
Valkea Resources Corp. (TSX-V: OZ) is pleased to announce the clo... READ MORE
Tiger Gold Corp. (TSX-V: TIGR) (FSE: D150) (OTCQB: TGRGF) is plea... READ MORE


