
Rick Mills – “AMOC Collapse – A Coming Climate Catastrophe”
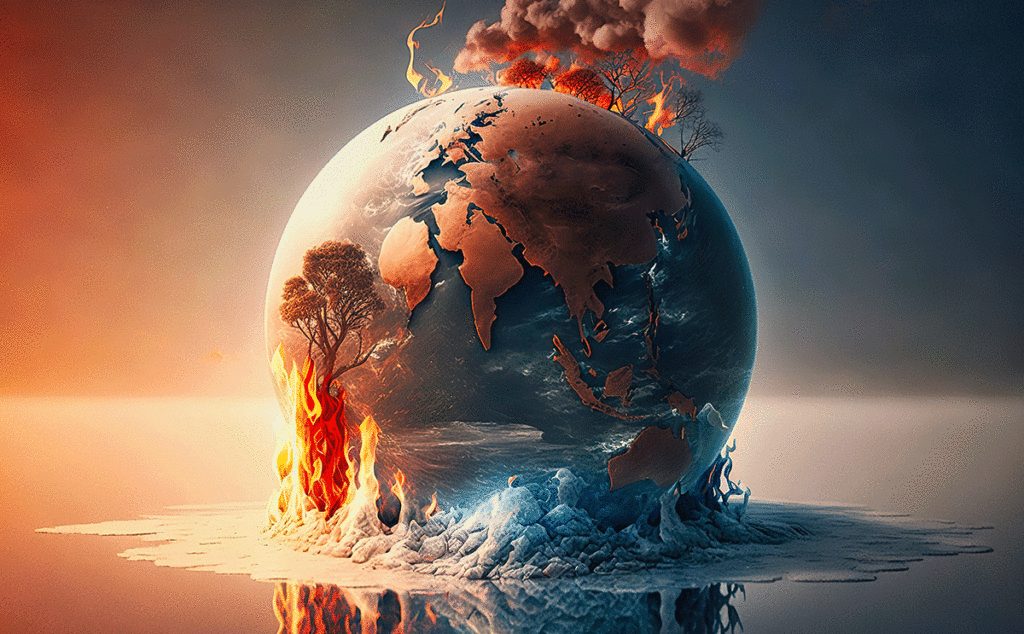
The Atlantic Meridional Overturning Circulation (AMOC) is a large system of water currents that circulates water from south to north and back, in a long cycle within the Atlantic Ocean.
This system of deep-water circulation, sometimes referred to as the Great Ocean Conveyor Belt, sends warm water from the Gulf of Mexico to the North Atlantic, where it releases heat to the atmosphere and warms Western Europe. The cooler water then sinks to great depths and travels all the way to Antarctica and eventually circulates back up via the Gulf Stream (see below).
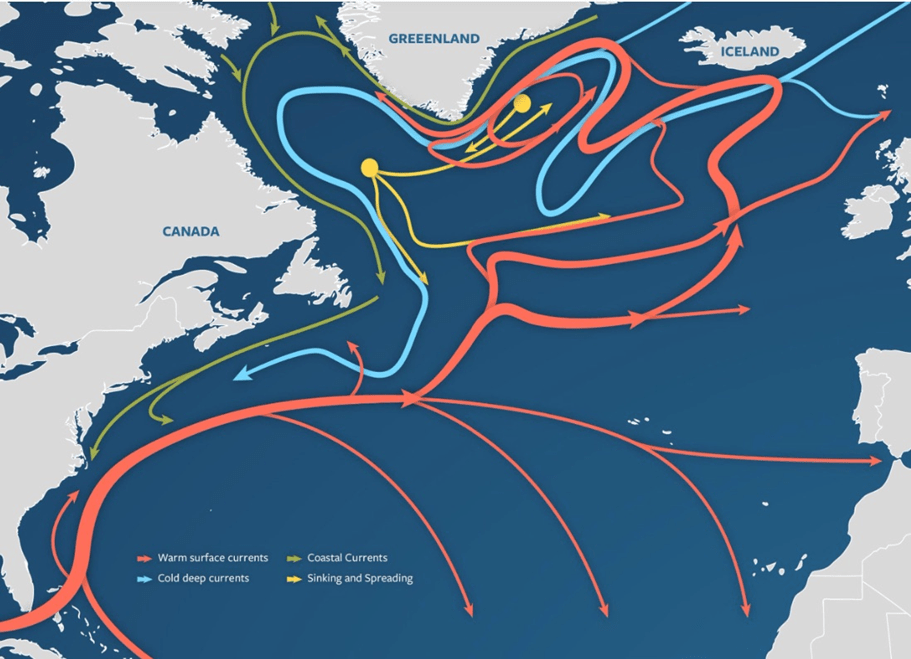
Source: Woods Hole Oceanographic Institution
Without climatic disruptions, the currents move water around the globe, along with nutrients key to the survival of marine species.
But climate scientists have been raising concerns that rising temperatures are throwing a wrench into the conveyor belt-like currents system. Sensors stationed along the North Atlantic show that the volume of water moving northward has been sluggish, potentially affecting sea levels and weather. If the AMOC were to stop altogether, it could bring extreme climate change within decades, not centuries or millenia — a period so short it wouldn’t even register in geologic time.
New research reveals this key cog in the global ocean circulation system is currently at its weakest point in over a thousand years, and is being further weakened due to the rise in global temperatures.
According to a study published in ‘Science Advances’, global warming is undermining heat exchange between ocean currents. To understand what this means, we need to introduce some earth science. Ocean currents are created due to differences in water density, or the weight of the water.
“The colder and saltier the water is, the greater its density, and the easier it is for its mass to sink. Whereas if the water is warm and fresh, it is lighter and therefore stays at the surface more,” Sandro Carniel, a climatologist and oceanographer at the National Research Center, explains via Renewable Matter.
This 10,000-year-old process has allowed northern Europe’s climate to be more temperate than it normally would be. Once the warm water masses moving from the Equator to the Arctic Circle reach their destination, they cool, become dense and sink, making way for more warm currents from the Equator.
The problem is that warming seas and melting sea ice are hindering the sinking of these great water masses.
“The huge amounts of melting ice are pouring an incredible amount of fresh water into the North Atlantic,” Carniel says. “Less and less salty and warmer waters are helping to lag the general circulation of currents.”
So, is the AMOC likely to come to a halt? If so, when, and what would be the effects?
According to the paper, the AMOC is getting closer and closer to collapse, with the tipping point likely arriving before the end of this century. This is the “point of no return” when we rapidly accelerate towards global heating.
Other research estimates the tipping point could come before 2095, although this is disputed by the Met Office, the British weather service.
If the AMOC were to stop, temperatures in Europe would fall dramatically, wet seasons in the Amazon would flip to dry seasons, and coastal cities would experience sea rise in the tens of centimeters.
The paper notes that the AMOC slowdown and global warming run at different speeds. While the atmosphere is warming a few tenths of a degree every decade, a slowdown in the circulation of Atlantic currents would cause temperature changes of a few degrees every 10 years.
The researchers predict that some European cities could see a 5 to 15-degree Celsius drop in a few decades. The effects would be worse in some areas, like Bergen, Norway, which could become 3.5C colder every decade.
The Atlantic Ocean would rise by 70 cm, drowning many coastal cities. Rainfall in the Amazon would be substantially reduced, and the southern hemisphere would get progressively warmer.
The predictions were obtained through computational models that simulated the effects of climate change over 2,000 years.
According to a 2018 study published in ‘Nature’, the AMOC has weakened over the past 150 years by approximately 15-20% due to the influx of freshwater from melted ice entering the system.
The buoyance of the Atlantic Current has decreased by 15% over the past 70 years.
Another study published in the same issue of ‘Nature’ looked at climate model data and past sea-surface temperatures and found that the AMOC has been weakening more rapidly since 1950 in response to global warming.
Together, these two studies provide complementary evidence that the present-day AMOC is exceptionally weak, which could have serious implications for Europe’s weather as well as the rest of the world.
Another 2021 study in ‘Nature and Climate Change’ warned of “an almost complete loss of stability of the AMOC over the course of the last century.” Furthermore, the study, which used eight datasets looking at surface temperatures and salinity in the North Atlantic over a period of 150 years, found global warming was driving the destabilization.
In an email to CNN, via CTV News, study author Niklas Boers, from the Potsdam Institute for Climate Impact Research, said a collapse of the circulation would mean significant cooling in Europe, “but maybe more concerning is the effect of an AMOC collapse on the tropical monsoon systems of South America, Western Africa, and India; especially in Western Africa, an AMOC collapse could lead to permanent drought conditions.”
The National Ocean Service confirms that, while it is uncertain whether the AMOC will continue to slow down or stop, if the planet keeps warming, fresh water from melting ice at the poles would shift the rain belt in South Africa, causing drought for millions of people. It would also cause sea level rise across the US East Coast.
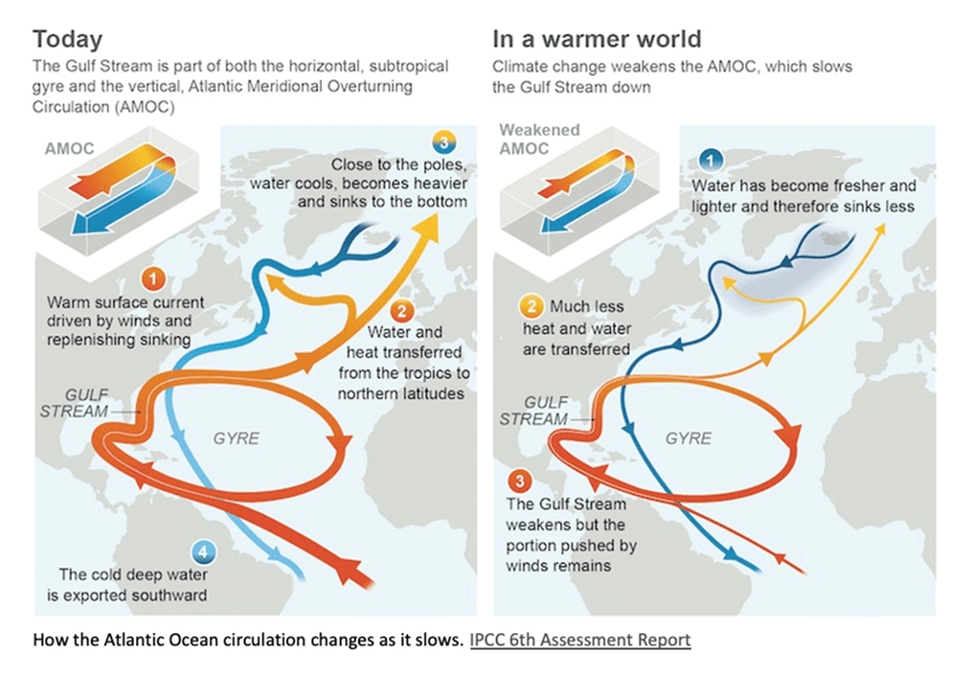
Source: IPCC 6th Assessment Report, The Conversation
A 2023 study in ‘Nature Communications’, reported via CBC News, said if the AMOC were to shut down, England and France would suddenly get a colder climate similar to southern Canada, damaging their ability to grow food; heat up northern Africa; and bring more storms and cause changes to rain and snow in Eastern Canada and the US, including drying of the mid-American plains.
The study says the collapse will happen far sooner than the previous estimate, a tipping point of +4 degrees C.

Models predict how heat will be distributed in the oceans
if the AMOC stops. Source: Zhengyu Liu, CBC News
Younger Dryas
There is scientific evidence to suggest the current did shut down during the last ice age. The prevailing theory of what caused an abrupt freezing involves a large influx of fresh water from a large lake, called Lake Agassiz (now the Great Lakes), into the Atlantic Ocean likely via the St. Lawrence Seaway, which stopped the AMOC in its tracks, plunging Europe and much of the northern hemisphere into a relatively short ice age.
There is geological evidence of a sharp decline in temperature between the Pleistocene epoch and the current Holocene epoch.
The Younger Dryas is a term sometimes employed to explain the natural cycles of global warming and cooling. It refers to an interruption in the heating of the climate that occurred after the last global ice age that started receding about 20,000 years ago.
Within decades temperatures dropped 2 to 6 degrees C, causing the advance of glaciers and dry conditions. The Younger Dryas is named after the alpine flower whose leaves are found in lake sediments of Scandinavian lakes. Scientists discovered that vegetation during a previous warmer period was replaced by that normally found in a cold climate, such as the Dryas octopetala wildflower. The mini-ice age is thought to have lasted between 1,000 and 1,300 years, and like it started, also ended abruptly, within 40 to 50 years.
Renewable Matter says the last Atlantic Current halt occurred about 12,900 years ago, confirming the above-mentioned theory that it was due to the melting of Lake Agassiz, which caused large amounts of fresh water to spill into the sea. The AMOC halt, likely caused by a comet strike, was followed by 1,300 years of freezing.
Melting sea ice/ glaciers
The reason the AMOC is slowing is due to the melting of Greenland’s ice cap and Arctic sea ice. Dense salt water in the North Atlantic is getting swamped by an influx of lighter fresh water from the melting ice.
Scientists have found that the Arctic is heating up four times faster than the rest of the world. Much of this has to do with the phenomenon known as “Arctic amplification”, or the loss of sea ice.
The Arctic Ocean is mostly covered with a layer of sparkling sea ice. But as the planet warms, the sea ice begins to dissipate and exposes more of the oceans surface warming the water, the loss of ice allows more heat to escape from the warmer water into the colder atmosphere. And as more ice vanishes from the sea, Arctic temperatures rise faster, which in turn makes the sea ice vulnerable to further melting.
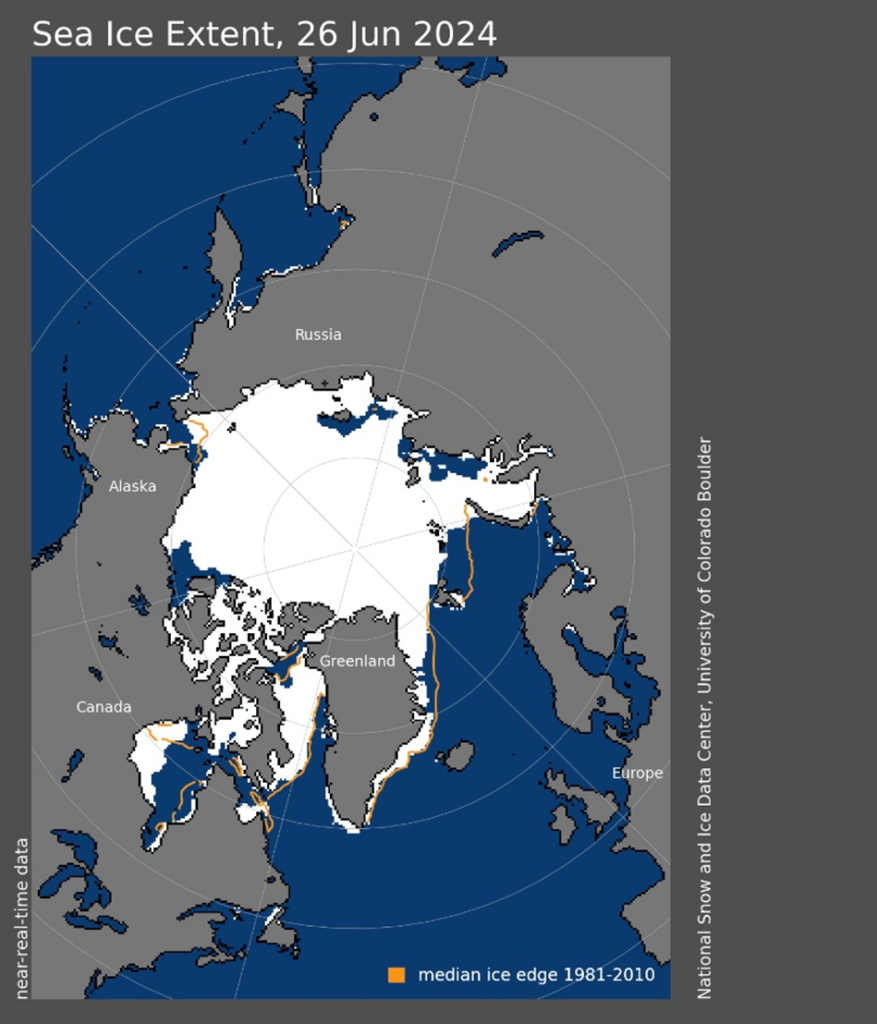
Source: NSIDC
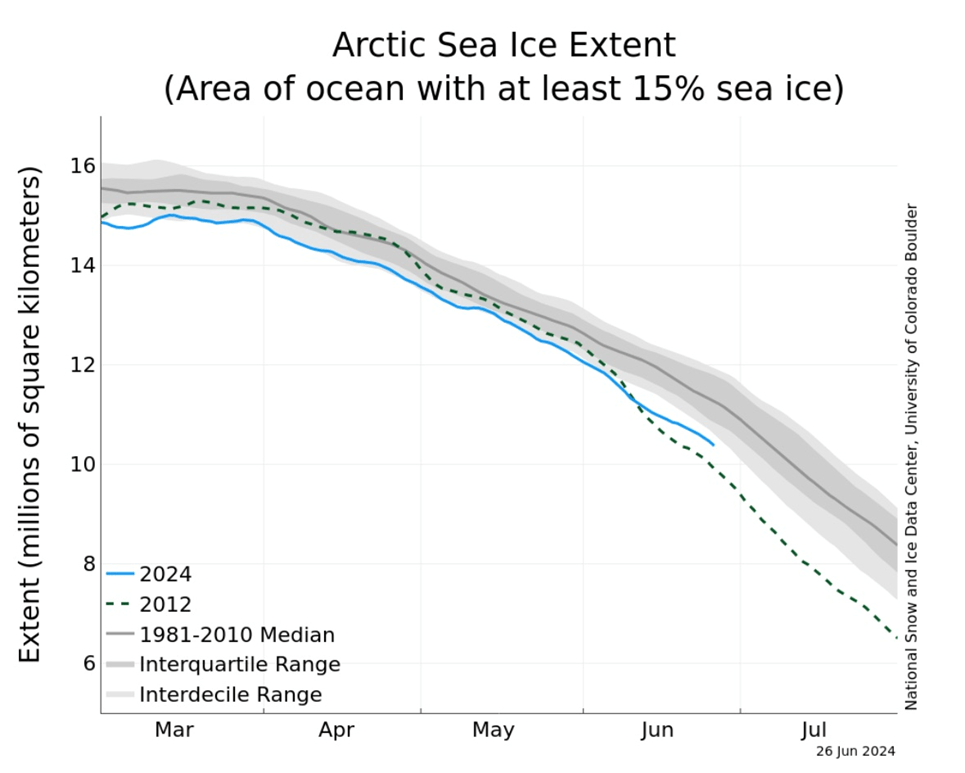
Source: NSIDC
The extent of Arctic sea ice changes throughout the year — growing during the winter before reaching its peak for the year in February or March, and then melting throughout the spring and summer towards its annual minimum, typically around September.
Using satellite data, scientists can track the growth and melt of sea ice, allowing them to determine the size of the ice sheet’s winter maximum extent as a way to monitor the “health” of the Arctic.
The lowest peak coverage occurred in 2017, when the ice extended over just 14.4 million square kilometers before beginning to shrink. According to National Snow & Ice Data Center (NSIDC) recordings, five of the lowest maximum extents have occurred since that year, and the 10 lowest coverage years have all taken place since 2006.
NASA showed that 2023’s Arctic sea ice winter peak reached its sixth lowest on record, while Antarctic sea ice hit its lowest maximum ever.
Between March and September 2023, the ice cover in the Arctic shrank from a peak of 14.62 million square kilometers to 4.23 million square kilometers. That’s roughly 1.99 million square kilometers below the 1981-2010 average minimum 6.22 million square kilometers. The amount of sea ice lost was enough to cover the entire continental United States.
According to NSIDC’s latest satellite recording, the average Arctic sea ice extent for May 2024 was 12.78 million square kilometers, tying for 12th lowest with 2007.
The alarm bells are also being rung from the other side of the globe, where the South Pole, similar to its northern counterpart, is warming faster than the global average at three times the pace.
A 2023 study revealed that Antarctic sea ice hit its lowest levels ever recorded. In the southern hemisphere summer of 2022, the amount of sea ice dropped to below 2 million square kilometers for the first time since satellite tracking began. Fast-forward a year later, a new record of 1.79 million square kilometers was set, representing the third time this record has been broken in six years.
Data from NSIDC shows that the Antarctic sea ice extent averaged a record low 3.23 million square kilometers during January 2023, shattering the previous January record low of 3.78 million in 2017.
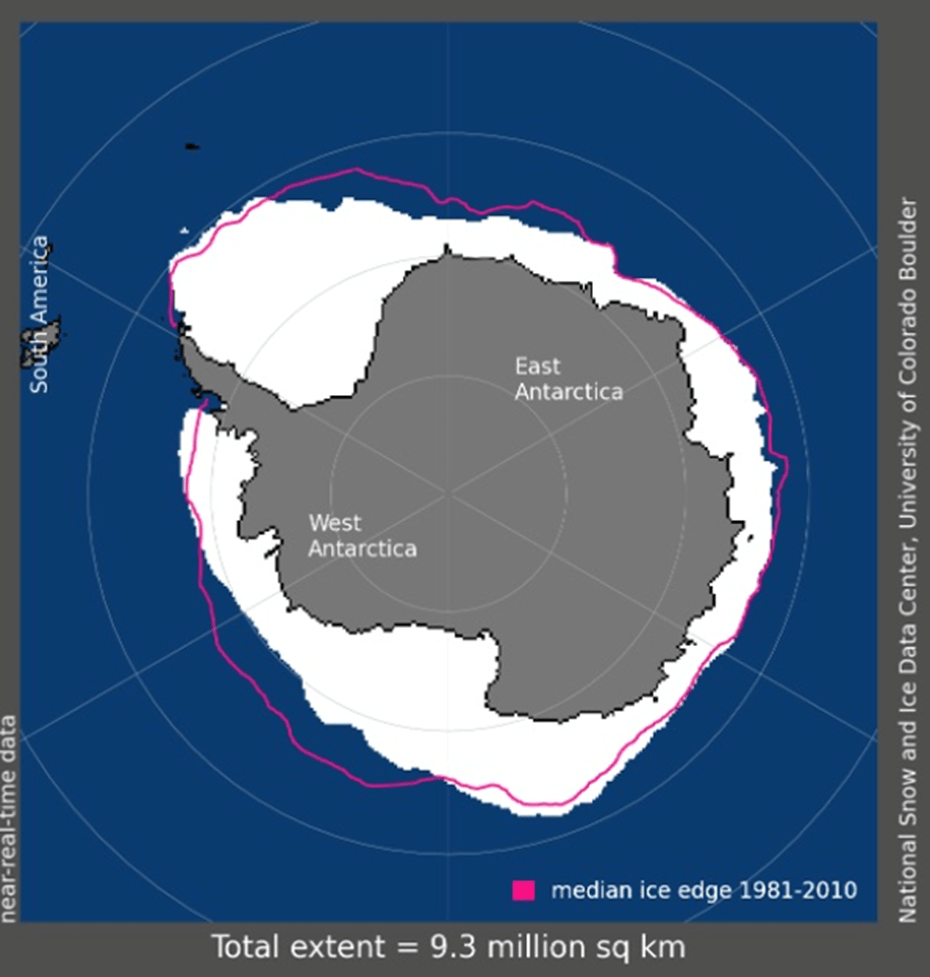
Sea Ice extent May 2024 Source: NSIDC
In the southern hemisphere’s spring, strong winds over western Antarctica buffeted the ice, Dr. Will Hobbs, an Antarctic sea ice expert at the University of Tasmania told The Guardian. At the same time, large areas in the west of the continent had barely recovered from the previous year’s losses.
One major area of concern is a marked loss of ice around the Amundsen and Bellinghausen seas on the continent’s west. Even as the average amount of sea ice around the continent grew up to 2014, these two neighboring seas saw losses, satellite data shows.
That’s important because the region is home to the vulnerable Thwaites glacier — known as the “doomsday glacier” because it holds enough water to raise sea levels by half a meter.
Melting ice at the north pole and around Antarctica could lead to a cascade of effects on the world’s climate patterns. Sea ice plays a key role in regulating the world’s temperature, as its bright surface reflects 50-70% of sunlight back into space. But as sea ice melts in the summer, it exposes the dark ocean surface which instead absorbs 90% of the sunlight, raising the temperature of the ocean, and the cycle of melting-warming intensifies.
It’s not only melting sea ice, but receding glaciers.
Greenland’s glaciers hold the equivalent of six meters of water should they melt into the ocean. The melting of Greenland would affect the North Atlantic Current and the Atlantic Meridional Overturning Circulation. The amount of freshwater pouring into the ocean from glacial melt would effectively stop the normal circulation of water around the globe, causing a sudden deep freeze.
Sea levels would rise up to seven meters, inundating big cities like New York, Los Angeles, San Francisco, London, Tokyo, Hong Kong, the entire state of Florida and swaths of Indochina.
The melting of the Antarctic ice sheet is even scarier. That would cause a sea rise of 80 meters, or up to five meters in the next 100 years if the West Antarctic Ice Sheet starts calving.
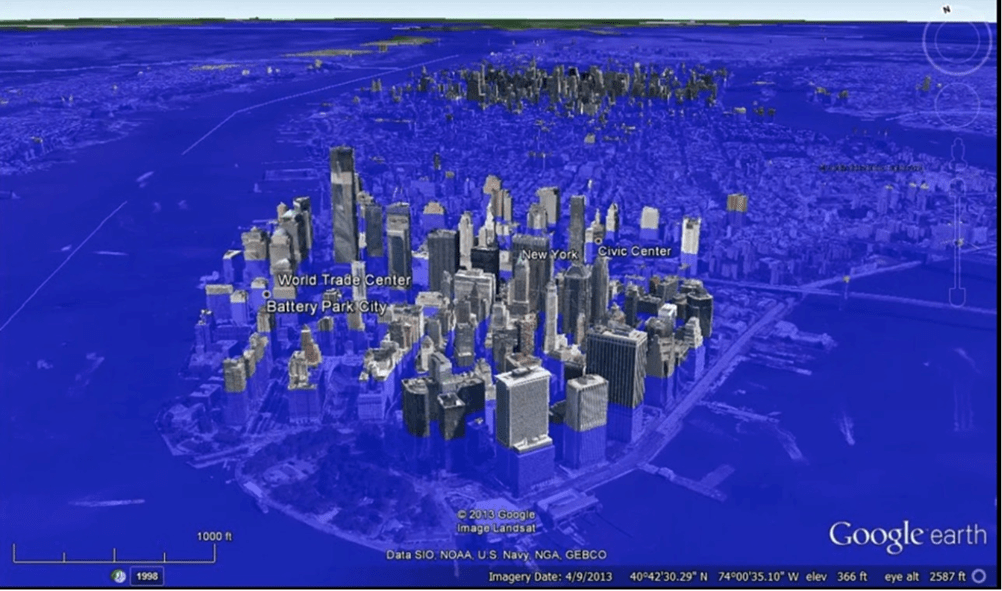
New York with 80 meters sea rise. Source: Southern Fried Science
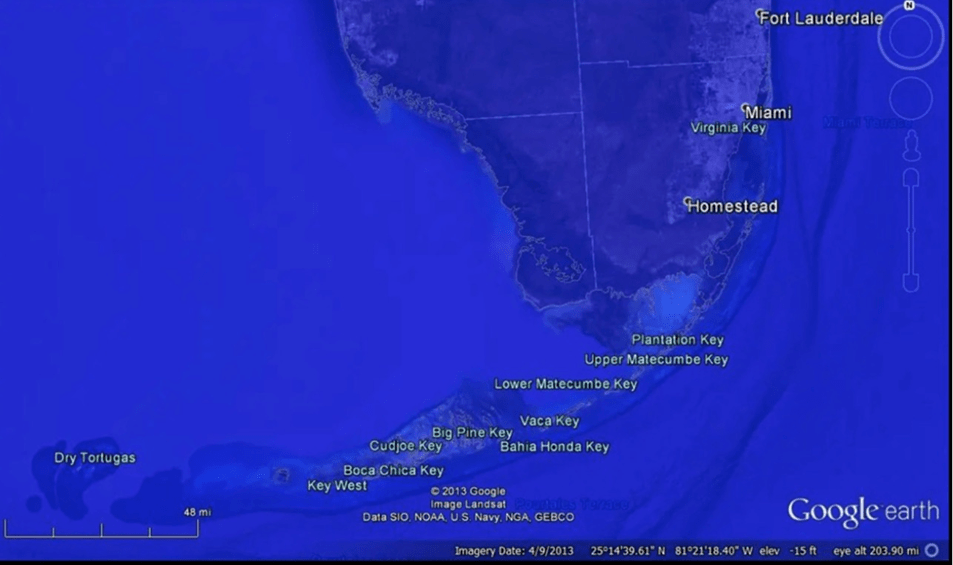
Miami with 80 meters sea rise. Source: Southern Fried Science
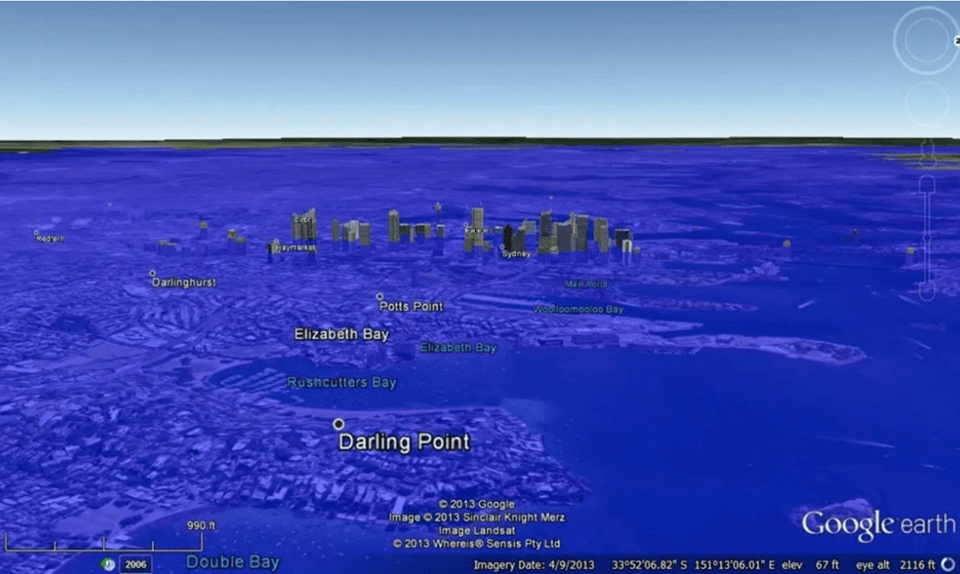
Sydney with 80 meters sea rise. Source: Southern Fried Science
According to Carbon Brief, 2023 was the 27th year in a row in which Greenland lost ice. The world’s largest island saw the disappearance of 197 billion tonnes of ice from September 2022 to August 2023 — close to the 1981-2010 average.
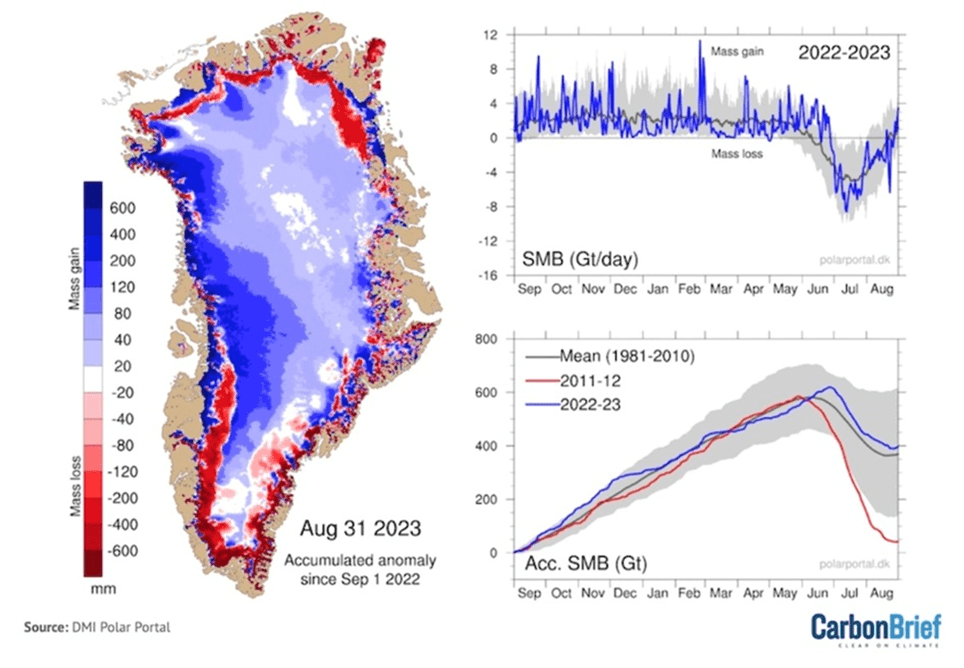
Source: Carbon Brief
Warming oceans
The heating up of the world’s oceans is one of the most damaging aspects of global warming. The phenomenon is driving weather disasters around the world, including extreme heat, storms and drought.
A 2023 media report said global ocean surface temperatures in June were the highest in 174 years of data, with the emergence of the El Nino weather pattern piling onto the long-term trend. Near Miami, coastal Atlantic waters were pushing 32 degrees C for example.
According to the Copernicus Climate Change Service, average sea surface temperatures across the North Atlantic were the warmest for the time of year by a very large margin, at 0.91°C above average. The record-breaking sea surface temperature anomalies in the North Atlantic, with localized extreme heat waves, are clearly visible on the map below.
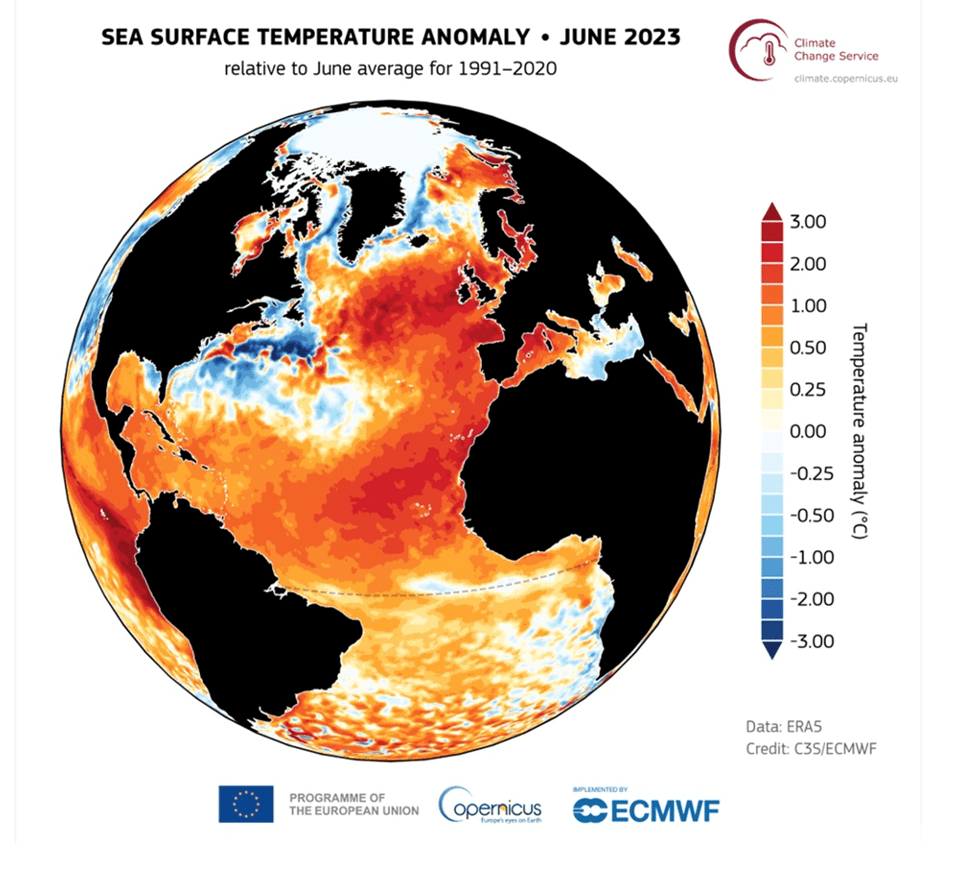
The National Oceanic and Atmospheric Administration (NOAA) estimated that surface temperatures in the North Atlantic were up to 5 degrees C warmer than usual during June. The same thing was happening in Antarctica, where scientists have linked warm waters off the Indian, Pacific and Atlantic oceans to plunging sea ice levels.
The Globe and Mail said parts of North America and nearby ocean were 10 to 20 degrees Celsius higher than averages from 1979 to 2000.
Another related climate phenomenon behind the record heat is the aforementioned “El Nino” effect, which was officially confirmed by the World Meteorological Organization on July 5, 2023.
It’s been well-established that warmer, or colder-than-average ocean temperatures have an influence on weather. According to the NOAA, El Nino causes the Pacific jet stream to move south and spread further east. During winter, this leads to wetter conditions than usual in the southern US and warmer and drier conditions in the north.
Another negative El Nino impact is on coral reefs. A recent paper in the Journal ‘Science’ warned about the possibility of mass coral bleaching in the Pacific Ocean — similar to what happened in 2016, when the Great Barrier Reef suffered its worst bleaching ever.
El Nino is shorter-lived than La Nina, usually lasting nine months to a year versus one to three years for the cooling phenomenon. It warms up the eastern Pacific Ocean, resulting in higher global temperatures. We are currently transitioning from El Nino to La Nina.
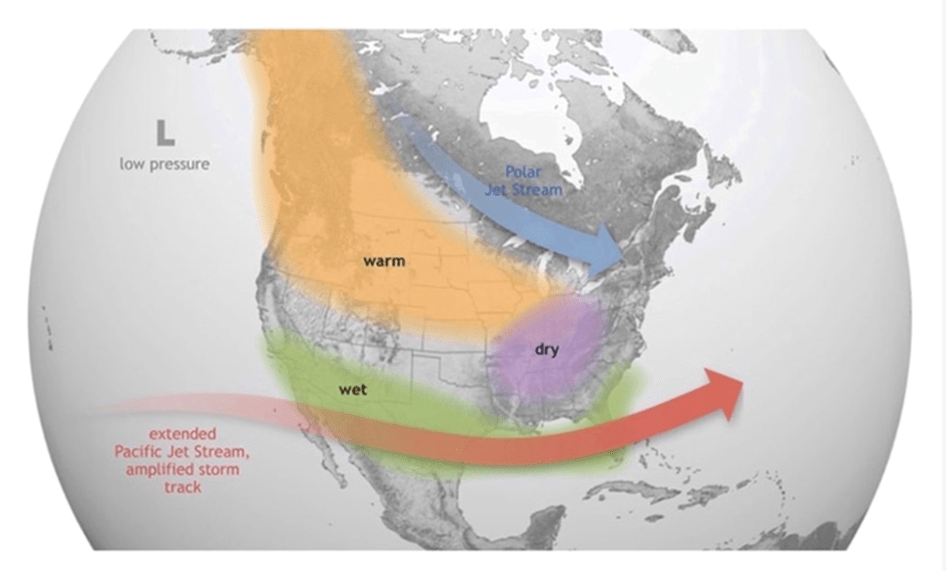
Source: NOAA
Extreme heat
The Washington Post reported that May marked the 12th consecutive month during which average global temperatures surpassed observations since 1850.
The winter of 2024 saw record-breaking warmth globally, with Canada experiencing its hottest winter on record and Europe its warmest February and second-warmest winter.
Montreal had its second warmest winter since records began in 1871.
Clearly, El Nino was behind the mild winter, but climate scientists say we shouldn’t discount the role of climate change.
Temperatures have been more than 1 degree C above pre-industrial levels for over a decade.
The last eight years have been the hottest on record, with 2023 the warmest ever. October 2023 hit a world heat record.
Last year’s average temperature was about 1.4C higher than the pre-industrial (1850-1900) era.
According to a 2022 study, global warming is expected to increase exposure to dangerous heat index levels by 50% to 100% in the tropics and by up to 10 times across most of the planet.
The recent heat dome that sat over Eastern Canada and parts of the United States earlier this month is a good example.
Heat domes occur when winds in the upper atmosphere, also known as the jet stream, are influenced by the ocean below. Hot seas cause the winds to shift, resulting in areas of high pressure that trap hot air in place for weeks.
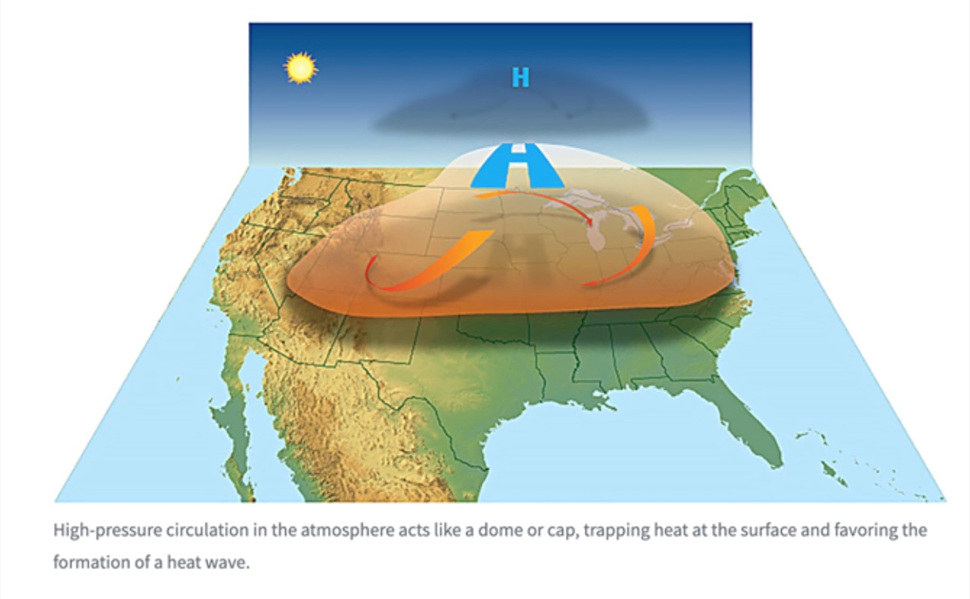
Source: NOAA
Temperatures reached dangerous levels in several major metropolitan areas including Chicago, St. Louis, Detroit, Cleveland, Pittsburgh, New York City and Boston.
The windy city hit a record-high 97 degrees Fahrenheit on June 17, topping the previous record of 96 set back in 1887. That’s 16 degrees above normal.
Record-breaking humidex values brought temperatures in the low-to-mid 30s range for much of southern Ontario, Quebec, and Atlantic Canada.
Extreme heat is by far the deadliest form of severe weather, killing on average twice as many people a year as tornadoes and hurricanes combined.
In 2021, a heat dome that settled over western North America killed 619 people in BC alone, mostly seniors stuck in apartments or hotels with no air conditioning.
We are currently in the process of transitioning from El Nino to La Nina, which could explain the unseasonably cold, wet conditions experienced at the end of May and early June across BC and Alberta.
But forecasters say just because El Nino is weakening, doesn’t mean it will be any cooler this year.
The United Kingdom’s national weather service, the Met Office, expects the average global temperature in 2024 will be 1.34 to 1.58 C above average — marking the 11th straight year that temperatures will reach at least one degree above pre-industrial levels.
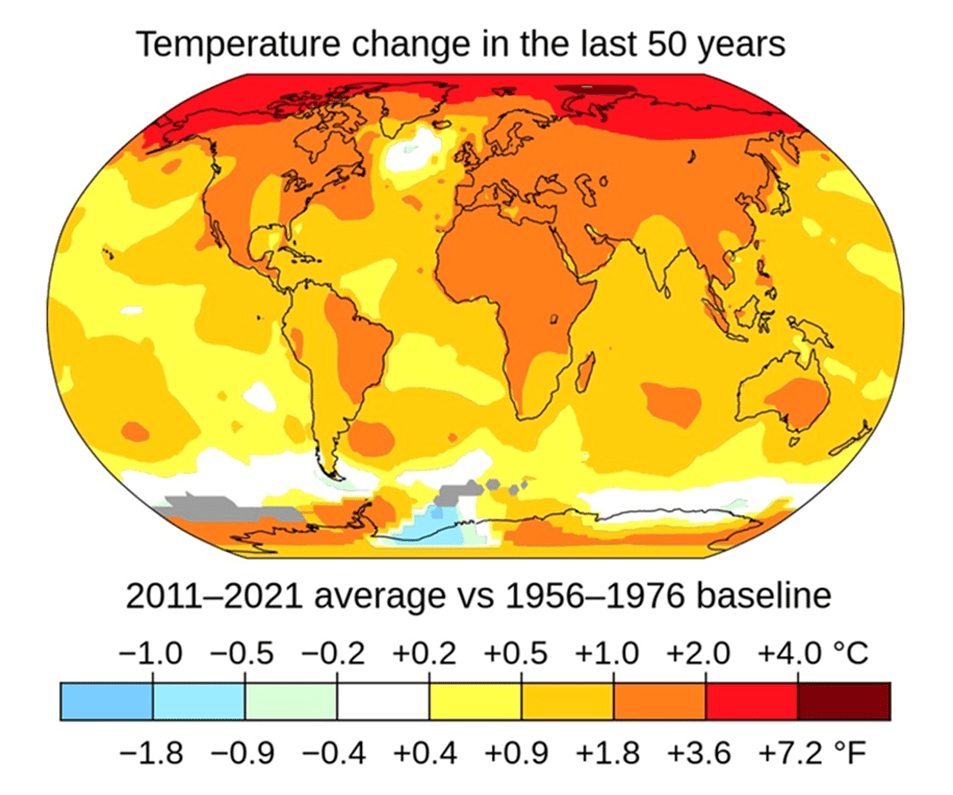
Average surface air temperatures from 2011 to 2021 compared to the 1956-1976 average. Source: NASA
An analysis published by the World Weather Attribution group found that heat waves, particularly those in North America and Europe, were “virtually impossible” without climate change. It also found that the 2023 heat wave in China was 50 times more likely to occur in our current warmer world.
All three heat waves were hotter than they would have been without the boost from global warming, it said.
Researchers nowadays are resigned to seeing even hotter summers than 2023’s, simply on the basis of the unprecedented rate at which the planet is heating up.
According to the NOAA, the global average surface temperature since the pre-industrial era (1880-1900) has risen by roughly 1 degree Celsius, or 0.08 per decade. While it may seem small, the accumulated heat is significant. Leipzig University’s data showed that July 2023 was about 1.5 degrees above the pre-industrial levels.
The fact of the matter is, the Earth’s average temperature we see today is at its highest since the ice age ended some 20,000 years ago.
Coming out of that ice age, it took about 10,000 years for the Earth’s average temperature to warm 3 degrees (see graphic below), but due to the burning of fossil fuels and greenhouse gas emissions, scientists are predicting we will get the same amount of warming in just 200 years!
That means the Earth is now warming 50 faster than the natural rate that preceded the most recent ice age.
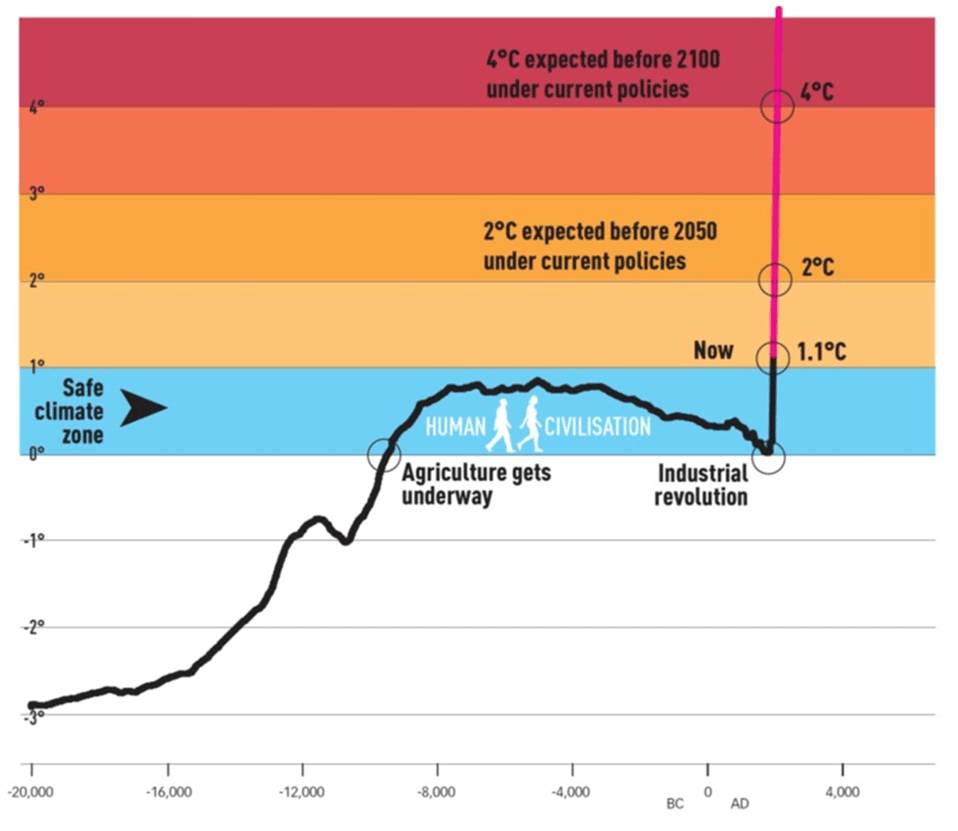
Source: Don’t Mention the Emergency
At the current pace, another degree of warming by 2050 is within the realm of possibilities. A study published by Proceedings of the National Academy of Sciences (PNAS) confirmed that global warming is on track to reach 1.5 degrees Celsius above pre-industrial averages in the early 2030s, even if emissions are reduced.
It also found a “substantial possibility” of global temperatures crossing the 2-degree threshold by mid-century, giving it a 65% chance of happening before 2065, and 50% prior to 2050.
“Our results provide further evidence for high-impact climate change, over the next three decades,” stated the report, which uses artificial intelligence trained by scientists on climate models to make these predictions.
The study’s projection is in line with previous models. In a major report published in 2022, the Intergovernmental Panel on Climate Change (IPCC) also estimated that the world could cross the 1.5-degree threshold “in the early 2030s.”
Back in the 2010s, the United Nations said that “we’re on track to get to about 4 degrees or 4.3 degrees of warming by the end of the century if we continue as we are.” That prediction, if it came true, would be tragic. The latest estimate, while more comforting, still has the Earth warming by about 2.7 degrees C by 2100.
Long story short, the Earth is growing hotter at an alarming rate. The bigger concern is that much of the global warming effects today are irreversible, so things can only get worse from now.
Drought
According to Agriculture Canada, drought conditions as of May 31 had improved throughout many regions of Canada due to increased precipitation in May. Moderate to Exceptional Drought (D1 to D4 on the map below) was 17% lower across Canada. However,
“At the end of the month, 45% of the country was classified as Abnormally Dry (D0) or in Moderate to Exceptional Drought (D1 to D4), including 59% of the country’s agricultural landscape.”
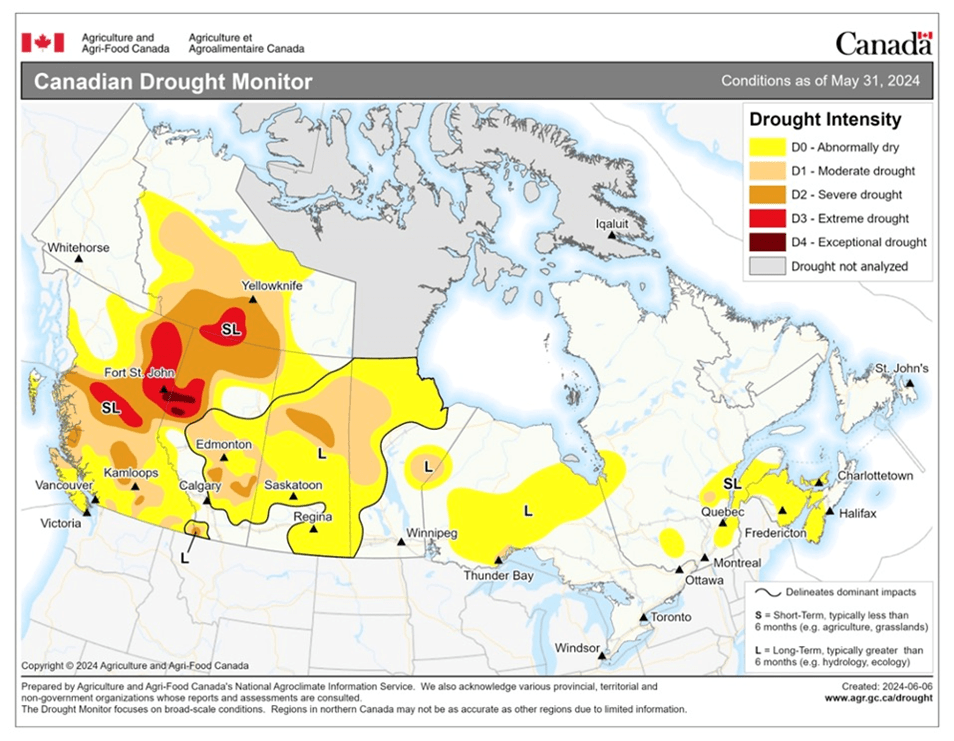
Agriculture and Agri-Food Canada
To me, this last paragraph is hardly reassuring.
In mid-May the Canadian Space Agency provided satellite photos capturing images of BC’s dry riverbeds.
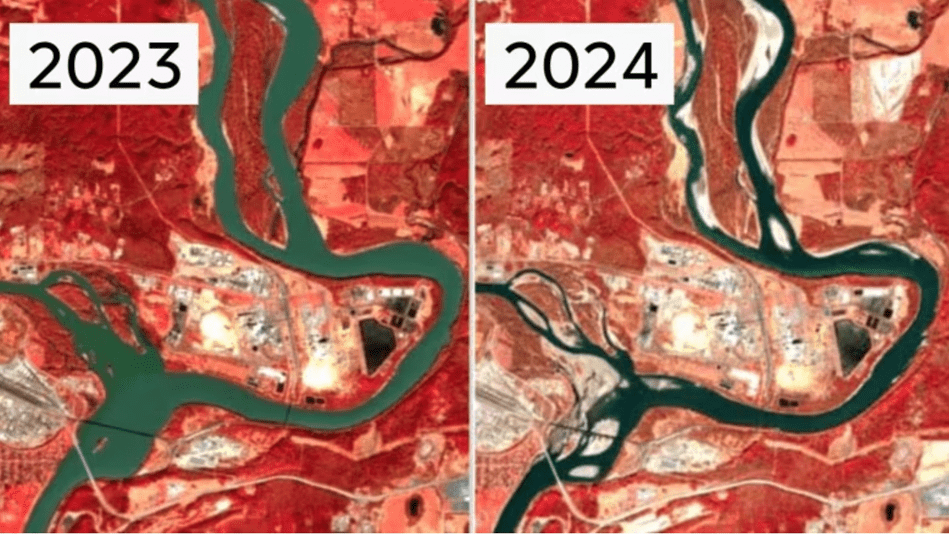
Source: European Union Copernicus Program, processed by the Canadian Space Agency
CBC News said The infrared images reflect what scientists on the ground have already been saying: water levels through the province’s Interior and north are alarmingly low…
Dave Campbell of the B.C. River Forecast Centre says with drought conditions dating back to 2022 and an average snowpack lower than has ever been recorded, there’s a high level of concern.
In a Global News story dated around the same time, Campbell said he’s especially worried about the effects of drought on smaller rivers and creeks in the central Interior, areas like Prince George, Quesnel, Williams Lake and Vanderhoof.
He noted it would take “a few months of wet-season rainfall” to ease the drought, which has hit Western Canada particularly hard.
Indeed, 2023 was one of the driest in recent memory. The Weather Network quotes hydrologist John Pomeroy saying that 2023 saw “some of the lowest stream flows ever recorded” on water systems like the Bow River, record wildfire seasons in Alberta, British Columbia, and Saskatchewan thanks to dry conditions, water use restrictions in major cities, shrinking water reservoir levels, early irrigation shutdowns, and low agricultural yields in some parts of Alberta as communities across the province declared agricultural emergencies. In its December 2023 drought assessment, Agriculture and Agri-Food Canada declared 70 per cent of the country “abnormally dry or in moderate to exceptional drought,” including 81 per cent of Canada’s agricultural landscape. Hydropower production was also affected in Manitoba and British Columbia.
2023 was the worst year for forest fires in both Canada and British Columbia. Last September, CBC News reported more than 15 million hectares were destroyed by fire across the country, doubling the previous record, 7.6 million ha in 1989.
Wildfires burned 24,900 square kilometers in BC, nearly double the 2018 record of 13,600 square km. That’s an area almost the size of Vancouver Island. Major fires included Donnie Creek, the province’s largest-ever blaze at a staggering 5,800 square km.
The Ministry of Emergency Management and Climate Readiness said that since 2017, nearly 140,000 people in British Columbia have been impacted by wildfire evacuation orders and alerts, with 33,445 forced out of their homes in 2023.
How likely is Western Canada to experience another dry summer? The low snowpack is certainly a worry. Will recent rains make up for it? Enough to fill reservoirs before the heat arrives in July and August?
I am cautiously optimistic it will be cooler than last year, amid the El Nino to La Nina shift, with less drought, wildfires and smoke. On the other hand, the pattern seems to be for dry, hot weather to continue year after year. It only takes a few weeks of heat, no rain and lightning for the situation to spin out of control like 2023, or worse.
Drought conditions in the United States were brutal in 2023.
According to U.S. Drought Monitor data, 2023 began with 31.4% of the Upper Mississippi Basin in moderate to exceptional drought. The drought area shrank to 4.0% of the basin on April 25 before expanding again to peak at 85.9% on July 11. The drought area oscillated up and down after that, ending the year at 51.5%.
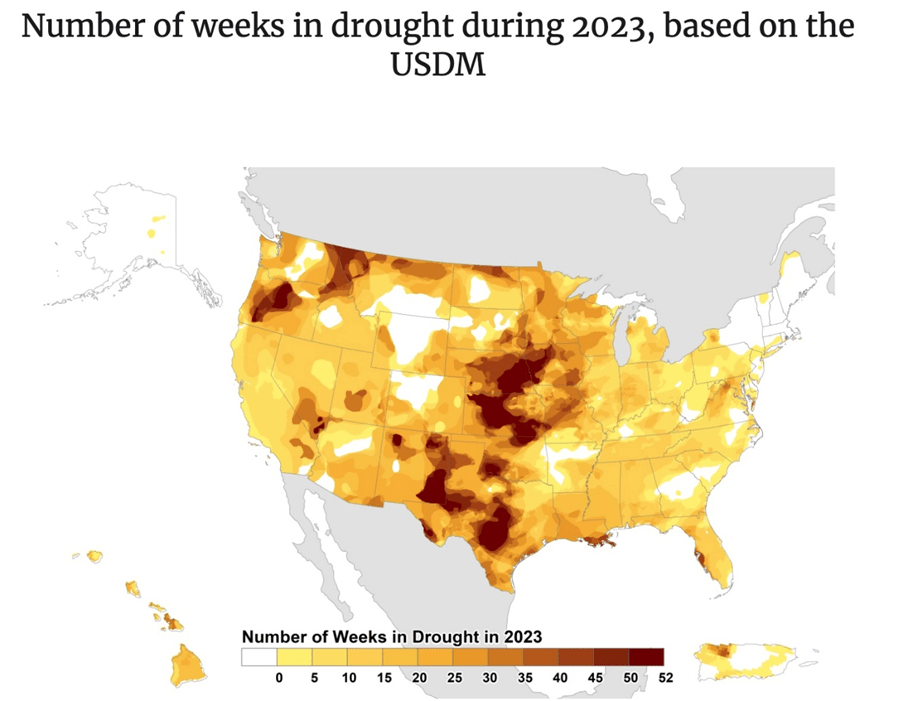
Source: U.S. Drought Monitor
While the situation has been better than normal for this time of year, the latest Drought Monitor report shows it’s getting worse:
Much of the eastern contiguous U.S. (CONUS), south of the Great Lakes, received little to no rainfall, and this is on top of several weeks of below normal rainfall leading up to last week. In addition, temperatures have remained hot for many locations. This combination of antecedent dryness, much below normal rainfall, and hot temperatures has resulted in rapidly deteriorating conditions, particularly across the Ohio Valley, Mid-Atlantic, and Southeast, with large increases in abnormally dry (D0) and moderate drought (D1) conditions.
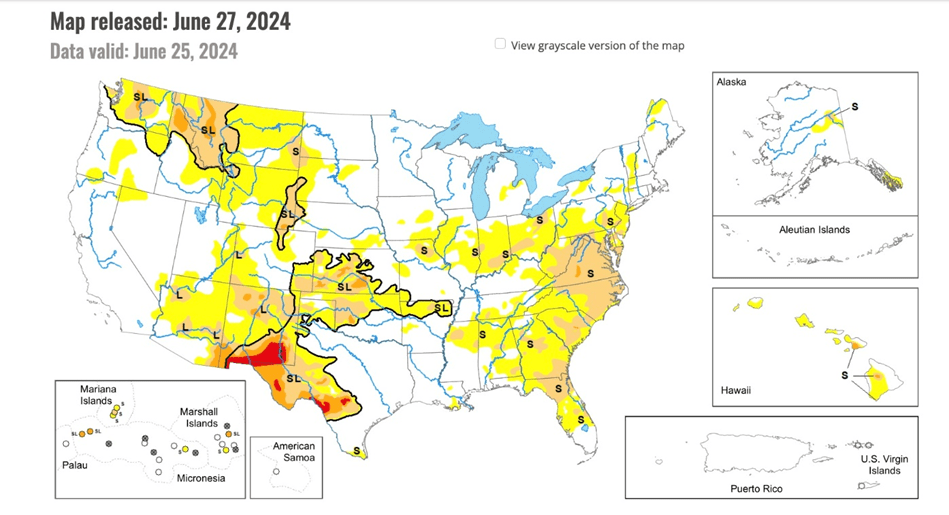
Source: U.S. Drought Monitor. Areas in yellow are Abnormally Dry, Moderate Drought in brown, Severe Drought in orange, and Extreme Drought in red.
Food
Global warming is influencing weather patterns, causing heat waves, heavy rainfall, and droughts, making it difficult to grow crops in many parts of the world year after year.
According to the World Bank, about 80% of the world most at risk from crop failures and hunger from climate change are in Sub-Saharan Africa, South Asia, and Southeast Asia, where farming families are disproportionately poor and vulnerable. A severe drought caused by an El Nino or climate change can push millions into poverty.
The organization said rising food commodity prices in 2021 were a major factor in pushing approximately 30 million additional people in low-income countries toward food insecurity.
In 2022, the Wall Street Journal reported that staple crops like corn, rice and Mexican chilies, all of which are vulnerable to hot weather and a lack of water, were seeing yields a fraction of normal levels.
Waterways that typically feed agricultural systems were parched, including Italy’s River Po, which accounts for up to 40% of the country’s agricultural production; and China’s Yangtze River, a crucial life source for crops. France in 2022 experienced the most severe drought ever recorded and China had the driest summer in six decades.
Canada’s wheat production in 2023-24 dropped 7% from the previous year to 31.95 million tonnes, according to a report from the Foreign Agricultural Service (FAS) of the U.S. Department of Agriculture (USDA), via World-Grain.com. Severely low soil moisture in Alberta and Saskatchewan reduced yields, the FAS said.
Climate tipping point
Climate science has been able to discern a past tipping point that led to relatively sudden, irreversible climate impacts, and a recent study shows it could hit that tipping point again, as warming continues.
According to The Conversation, a tipping point was first noticed in a simple model of the Atlantic Ocean circulation in the early 1960s. Today’s climate models indicate continued slowing of the ocean’s conveyor belt under climate change, but without an abrupt slowdown.
A new study performed an experiment with a detailed climate model to find the tipping point for an abrupt slowdown by slowly increasing the amount of fresh water. The results showed the Atlantic Meridional Overturning Circulation could shut down within 100 years of hitting the tipping point.
When the circulation stops, parts of Europe cool by more than 3 degrees Celsius per decade — much faster than present global warming of about 0.2 C per decade. In Norway, the mercury could fall as much as 36 degrees. Regions in the southern hemisphere, on the other hand, would warm by a few degrees.
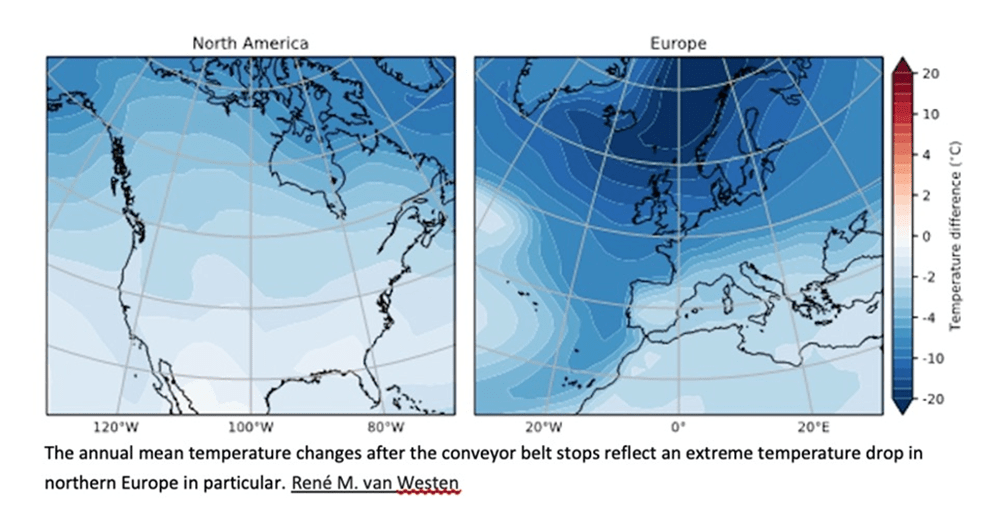
The annual mean temperature after the conveyor belt stops.
Source: The Conversation
The slowdown and eventual stoppage of the AMOC would also affect sea level and precipitation patterns. The Conversation says this would push other ecosystem closer to their tipping points, such as the Amazon rainforest. Declining precipitation turns the forests into grassland, releasing carbon into the atmosphere and accelerating global warming.
So when exactly is the tipping point? To determine this, the study developed a kind of early-warning signal involving the transport of salty water at the southern boundary of the Atlantic Ocean. Once a threshold is reached, the tipping point, seen below in red, is likely to follow in one to four decades.
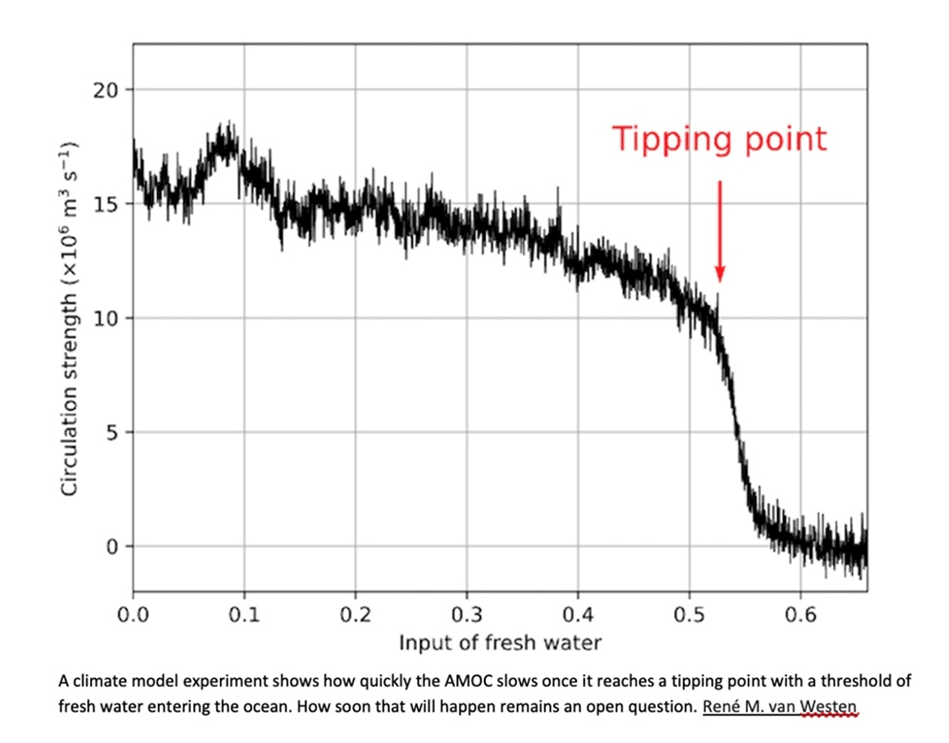
Source: The Conversation
The above-mentioned study in ‘Nature Communications’ is more alarming in its findings.
The study says the AMOC could disappear as soon as 2025, and no later than 2095, and that we’re much closer to the tipping point that will trigger the current’s demise than previously thought.
This, in my opinion, is the most important takeaway from this article.
Consider: earlier estimates had the tipping point at roughly 4C of warming. So far the Earth’s surface has only warmed about 1.3C. The last time the AMOC collapsed, 12,000 years ago, temperatures plunged between 10 and 15 degrees within a decade.
While the researchers say it won’t trigger an ice age like in the movie ‘The Day After Tomorrow’, the AMOC’s collapse will: give England and France a climate similar to southern Canada, thus damaging those countries’ ability to grow food; heat up northern Africa, which is already experiencing extreme heat and droughts; and bring more storms, rain and snow to the east coast of Canada and the US, along with drying of the mid-American plains.
How can the researchers tell we are nearing a tipping point? Key signs are wild swings to extreme temperatures, and slower returns to the average temperature. Researchers saw evidence of both at the end of the last ice age 12,000 years ago, when the AMOC collapsed.
CBC News wrote, In the case of the AMOC, researchers have been measuring its temperature, which they’ve correlated to other measurements made with satellites, submarine cables and moored instruments since 2014.
Using that temperature correlation allowed them to estimate AMOC over a longer period of time, back to 1870. In doing so, the researchers noticed signs that a tipping point is approaching. By extrapolating, they’ve estimated when that is — sometime in the next two to 72 years.
“I think one of the major take-home messages from our paper is that it could possibly happen much earlier than what is believed,” said Susanne Ditlevsen. “And I think that’s very worrisome.”
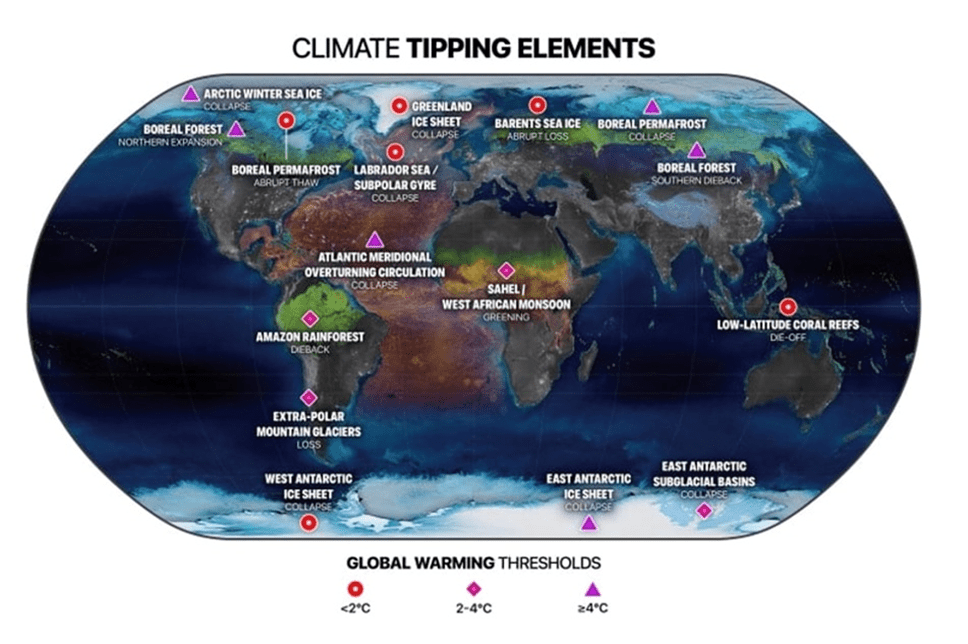
Major climate tipping points and the global warming temperature thresholds at which they may be triggered. Source: McKay et al, 2022, CBC News
Conclusion
If we believe the ‘Nature Communications’ study, we have between one and 71 years to go, before the Atlantic Meridional Overturning Circulation stops moving, causing abrupt climate changes — up to 15 degrees colder or warmer — within a decade. This is based on the last time the AMOC collapsed, 12,000 years ago.
But the planet is much worse off than it was then. Along with rapid warming at the poles, and melting sea ice and glaciers, we have melting permafrost causing huge volumes of methane to escape into the atmosphere, collapsing polar vortices, and extended droughts happening all over Earth.
Even the milder study quoted by The Conversation, has the tippling point for an AMOC shutdown, measured by the salinity of the water in the southern Atlantic, likely to follow in one to four decades.
Remember, the AMOC shutdown is directly related to polar ice melt, a feedback loop that gets worse every year that more open sea is exposed to the sun. If the Greenland ice sheet disappears, sea levels would rise up to seven meters, inundating big cities like New York, Los Angeles, San Francisco, London, Tokyo, Hong Kong, the entire state of Florida and vast swaths of Indochina.
The melting of the entire Antarctic ice sheet would cause a sea rise of 80 meters. For an idea of what this would mean for some major US cities, and other vulnerable parts of the world, check Southern Fried Science.
Let’s run a little doomsday scenario.
Imagine, now you have melting ice to the point where the Arctic Ocean is ice-free all year round. There are no more glaciers. The spring freshet each year is very short because the only snow and ice in the mountains is from the last season.
Many of the world’s coastal cities have been flooded by rising sea levels. Coastal aquifers are ruined by saltwater intrusion, causing widespread water shortages. Vast dead zones appear in the ocean after pollutants wash into the seas from industrial areas like refineries that were inundated. There is no-one to clean up the mess.
Anyone who has the means, escapes from the coasts into the interior. But there they find that fresh water is scarce due to no glaciers, much depleted lakes and dry stream beds. Droughts are common in summer and there are problems around food security. Prices of staples like wheat, corn and rice skyrocket.
The planet has warmed several degrees C, and is getting warmer. There is already searing heat in the summer, along with energy-sapping humidity. There are global, massive constant burning fires, so smoke adds to the greenhouse effect.
Conflicts become common, we’re fighting over scarce resources.
LEGAL NOTICE / DISCLAIMER
AHEAD OF THE HERD NEWSLETTER, AHEADOFTHEHERD.COM, HEREAFTER KNOWN AS AOTH.
PLEASE READ THE ENTIRE DISCLAIMER CAREFULLY BEFORE YOU USE THIS WEBSITE OR READ THE NEWSLETTER. IF YOU DO NOT AGREE TO ALL THE AOTH/RICHARD MILLS DISCLAIMER, DO NOT ACCESS/READ THIS WEBSITE/NEWSLETTER/ARTICLE, OR ANY OF ITS PAGES. BY READING/USING THIS AOTH/RICHARD MILLS WEBSITE/NEWSLETTER/ARTICLE, AND WHETHER YOU ACTUALLY READ THIS DISCLAIMER, YOU ARE DEEMED TO HAVE ACCEPTED IT.
MORE or "UNCATEGORIZED"
Delta Reports New Gold Intercept at Nova Target in Wedge Area, 4 Kilometres West of Eureka; Follow-Up Drill Program Underway
Delta Reports New Gold Intercept at Nova Target in Wedge Area, 4 ... READ MORE
Silver One Announces Closing Of Final Tranche Of $32 Million Financing
Silver One Resources Inc. (TSX-V: SVE) (OTCQX: SLVRF) (FSE: BRK1)... READ MORE
SAGA Metals Achieves 100% Drilling Success in 2025—Reports Final Assays from Trapper South at Radar Critical Minerals Project in Labrador
Exceptional grades of Titanium, Vanadium and Iron in all 15 drill... READ MORE
Near Surface Intersection Yields 6.58 g/t gold over 10.35 metres
Intersection is within 33 metres from surface and contained in a ... READ MORE
Alamos Gold Provides Three-Year Operating Guidance Outlining 46% Production Growth by 2028 at Significantly Lower Costs
Further production growth to one million ounces annually expected... READ MORE


