


i-80 GOLD CORP. (TSX: IAU) (NYSE: IAUX) is pleased to announce the results of the preliminary economic assessment for the Archimedes Underground Project, situated within the Company’s broader Ruby Hill Complex. The Complex is located along the southeastern end of the Battle Mountain-Eureka Trend in northeastern Nevada, United States. The PEA confirms that Archimedes has the potential to become a key component of the Company’s regional hub-and-spoke mining and processing strategy.
“The release of the Archimedes PEA marks another step forward in our plan to establish i-80 Gold’s broader hub-and-spoke mining and processing strategy in northeastern Nevada. Based on the PEA, Archimedes is expected to contribute meaningfully to the overall production and economics of the Company’s hub-and-spoke strategy in spite of higher transportation costs to our central autoclave facility, and lower grades relative to the Company’s two other underground projects. The PEA’s findings show that at a base case gold price of $2,175/oz, Archimedes Underground is at the lower end of valuation compared to other underground gold projects in our portfolio, however it presents the highest leverage to gold prices,” stated Richard Young, Chief Executive Officer.

Figure 1: Archimedes Longitudinal Section of Mineralized Bodies (Looking West) (CNW Group/i-80 Gold Corp)
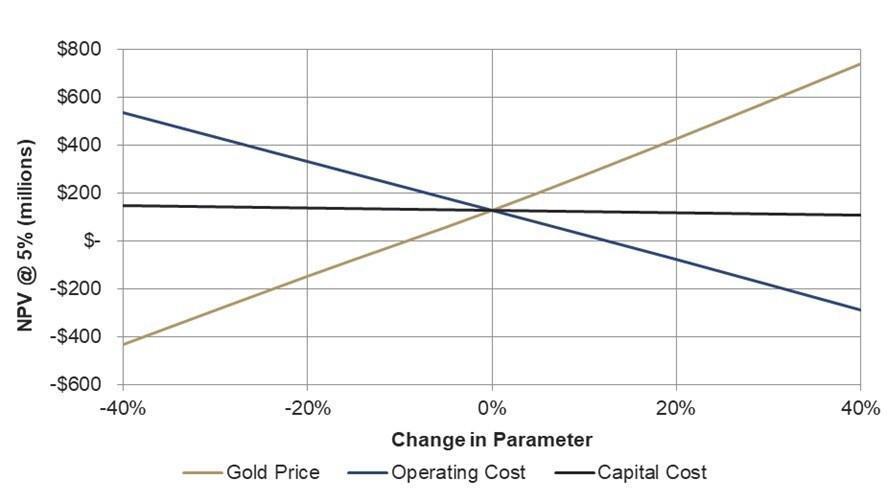
Figure 2: Archimedes Gold Price Sensitivity Cost Analysis (CNW Group/i-80 Gold Corp)
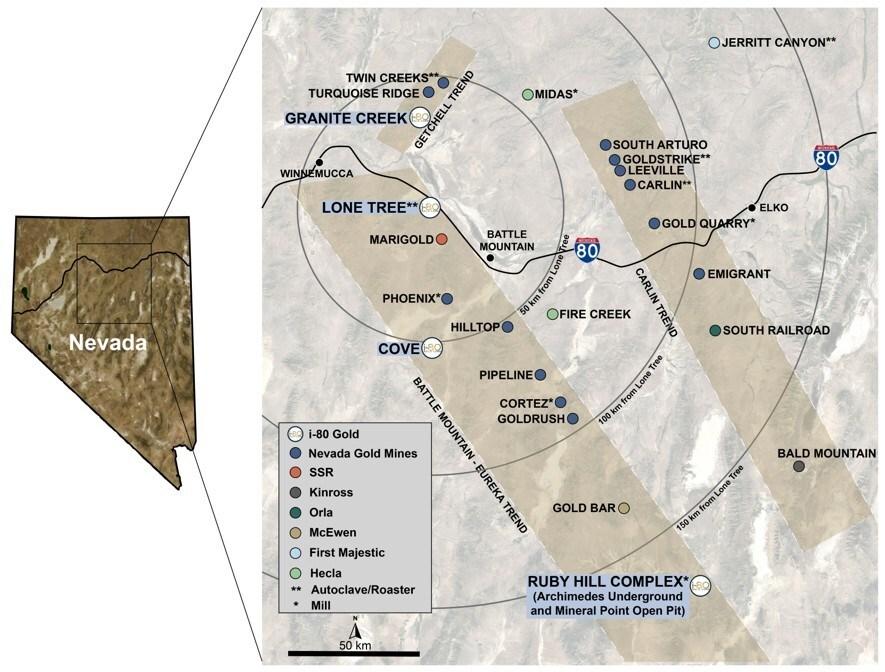
Figure 3: i-80 Gold Regional Map (CNW Group/i-80 Gold Corp)
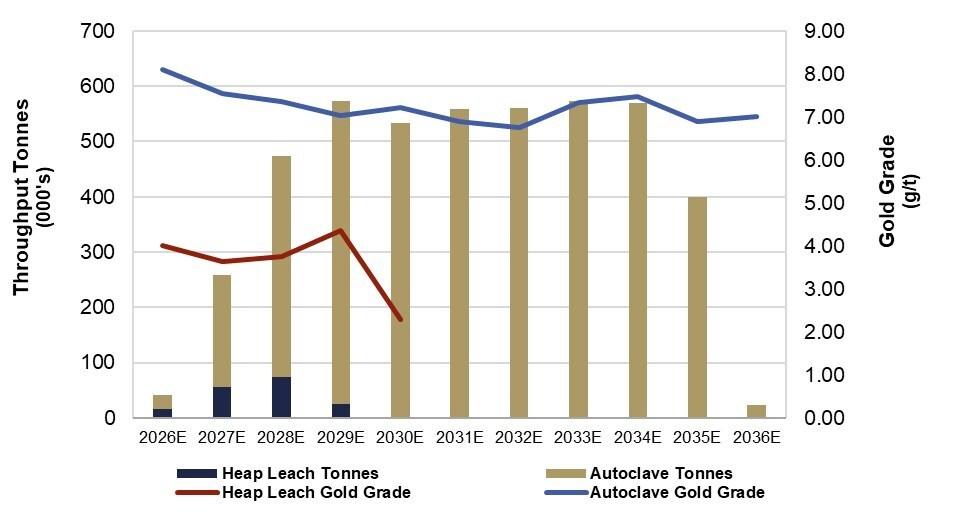
Figure 4: LOM Processing Schedule (CNW Group/i-80 Gold Corp)
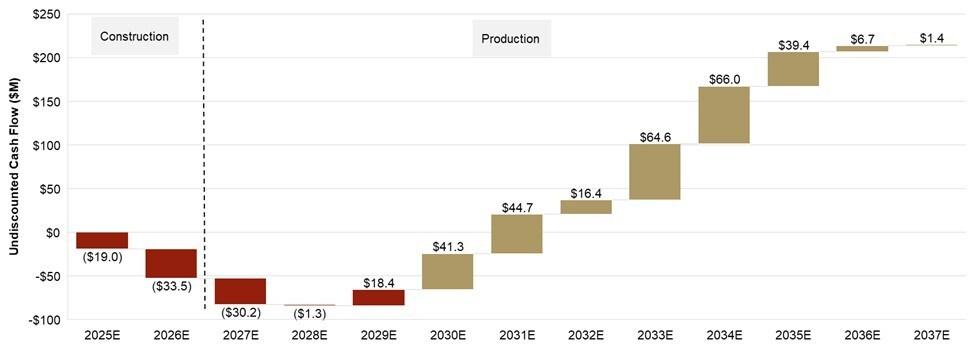
Figure 5: Archimedes LOM Annual Cash Flow (CNW Group/i-80 Gold Corp)
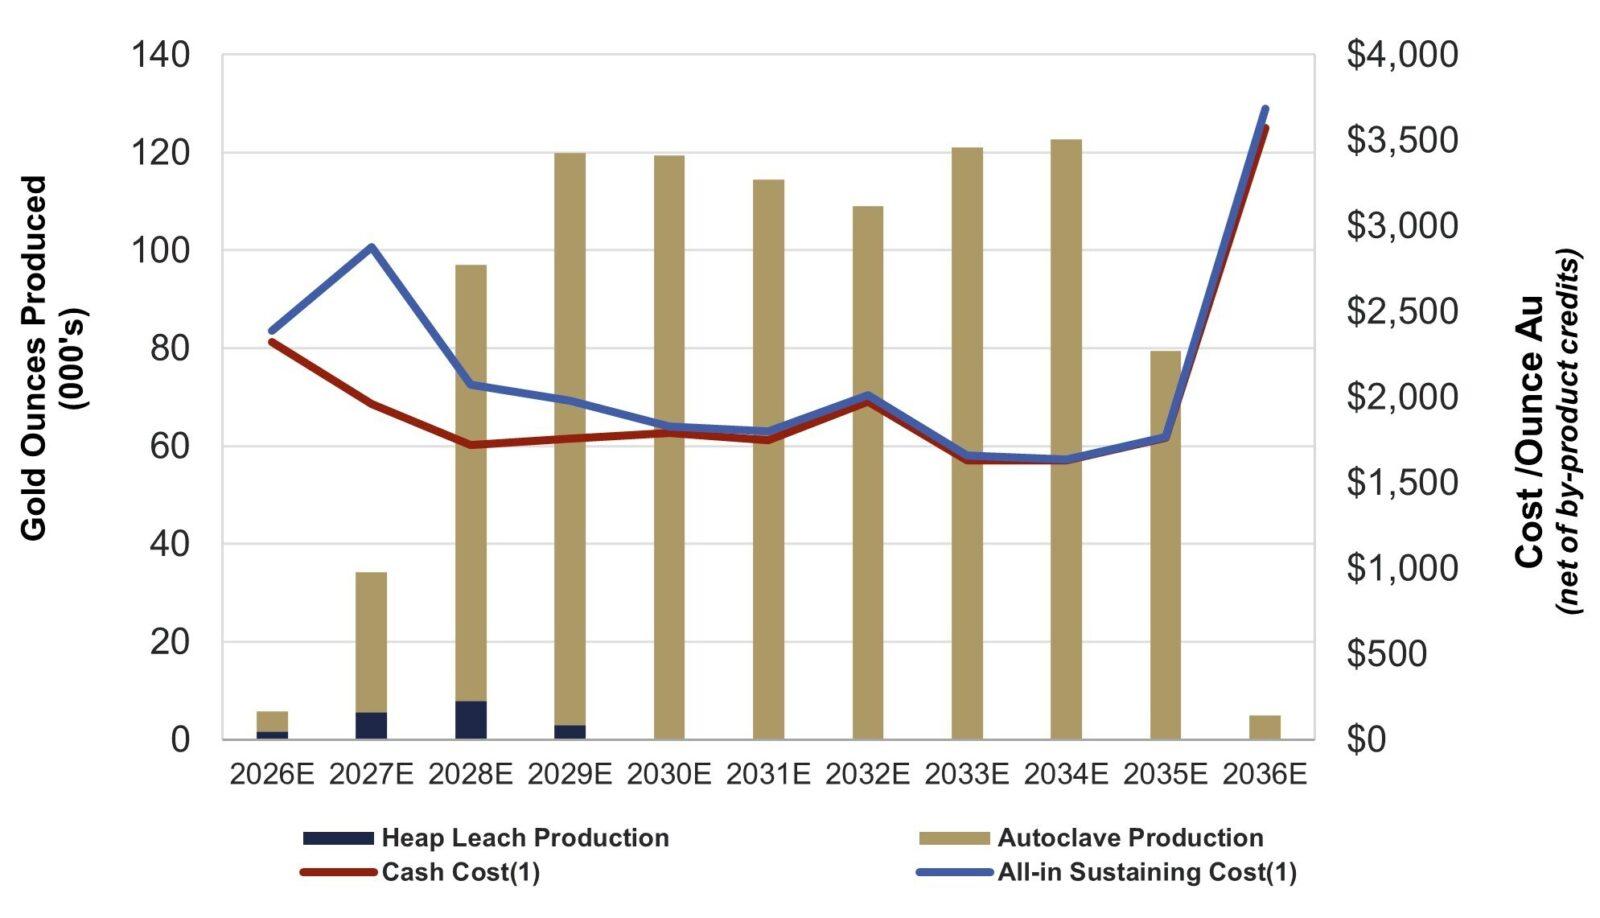
Figure 6: Archimedes LOM Gold Production Profile vs Cost per Ounce (CNW Group/i-80 Gold Corp)
PEA Highlights
Mineral Estimates, Production and Mine Life
Project Economics
Mining and Processing
All amounts are in United States dollars, unless otherwise stated.
A summary of key valuation, cost, and operating metrics is presented in Table 1 below. For more detailed metrics presented on an annual basis, see Archimedes Underground Project Detailed Cash Flow Model in the Appendix.
Table 1: Summary of PEA Key Operating and Financial Metrics
| Project Economics | Unit | ||
| Gold Price | $/oz | $2,175 | |
| Silver Price | $/oz | $27.25 | |
| Pre-Tax NPV(5%)(2) | $M | $126.8 | |
| After-Tax NPV(5%)(2)(3) | $M | $126.8 | |
| After-Tax IRR(3) | % | 23 % | |
| After-Tax Cash Flow(3) | $M | $211.9 | |
| Production Profile | |||
| Mine Life | years | 10 | |
| Mineralized Material Mined | 000s tonnes |
4,566.9 | |
| Gold Grade of Mineralized Material Mined | g/t Au | 7.0 | |
| Silver Grade of Mineralized Material Mined | g/t Ag | 1.64 | |
| Waste Tonnes Mined | 000s tonnes |
1,353.8 | |
| Total Tonnes Mined | 000s tonnes |
5,920.7 | |
| Total Mineralized Material Processed | 000s tonnes |
4,566.9 | |
| Gold Grade Processed | g/t Au | 7.0 | |
| Silver Grade Processed | g/t Ag | 1.64 | |
| Average Gold Recovery | % | 90 % | |
| Average Silver Recovery | % | 10 % | |
| Total Gold Recovered | 000s oz | 927.9 | |
| Total Silver Recovered | 000s oz | 24.3 | |
| Average Annual Gold Production (LOM) | 000s oz | 84.4 | |
| Average Annual Gold Production (following production ramp up) |
000s oz | 101.9 | |
| Unit Operating Costs | |||
| LOM Operating Cost | |||
| Mineralized Material Mined | $/t mined | $130.2 | |
| Mineralized Material and Waste Mined | $/t mined | $126.7 | |
| Processed (autoclave & heap leach) | $/t milled | $107.3 | |
| Transportation | $/t milled | $42.1 | |
| Dewatering Electricity | $/t milled | $6.4 | |
| G&A | $/t milled | $17.3 | |
| LOM Total Cash Costs(1) (net of by-product credit) | $/oz | $1,769 | |
| LOM All-in Sustaining Costs(1) (net of by-product credit) | $/oz | $1,893 | |
| Total Capital Costs | |||
| Construction Capital | $M | $47.3 | |
| Definition & Conversion Drilling | $M | $10.6 | |
| LOM Development & Sustaining Capital | $M | $97.6 | |
| Closure Costs | $M | $8.9 | |
| Total Capital & Closure Costs | $M | $164.4 | |
“The Archimedes PEA reinforces its value within i-80 Gold’s portfolio, with the potential to achieve the highest mining rate among our underground operations. The geometry of the mineralized body supports the use of bulk mining methods, driving lower unit costs and enhancing project economics. Additionally, extensive infrastructure is already in place, and the sequential permitting approach allows us to expedite mining activities through mid-2027, while finalizing approvals for the lower section,” added Matthew Gili, President and Chief Operating Officer.
Mineral Resource Update
The PEA includes all drilling conducted on the Archimedes underground since i-80 Gold’s acquisition of the property. The updated mineral resource estimate includes a total of 436,000 ounces of gold at 7.6 g/t Au in the indicated category and 988,000 ounces of gold at 7.3 g/t Au in the inferred category (see Table 2). The majority of the resource estimate is currently hosted in the Ruby Deeps deposit (see Figure 1). The mineral resource estimate is based on stope optimization software. This methodology is more accurate than previous estimation techniques and has become the industry standard for underground deposits in Nevada.
The updated resource estimate includes all drilling since 2021, as well as stope optimization which results in additional mineralized body constraints. Overall, the indicated resource tonnes and gold ounces have increased by 49% and 116%, respectively, as compared to the 2021 resource estimate resulting in a total of 436,000 indicated gold ounces contained. The increase in indicated ounces is offset by a decline in inferred tonnes and ounces by 49% and 37%, respectively, resulting in a total of 988,000 inferred ounces contained. Gold grades have increased in all categories of resource, improving by 46% in the indicated category and 21% in the inferred category.
Once the underground drill platforms are constructed, a significant infill drill program is planned for Ruby Deeps and the 426 zone in the coming years to follow up on earlier positive results in a more cost-effective manner with the goal of extending the mine life beyond the current 10 years. Ruby Deeps remains open to the north and south, offering substantial exploration potential.
An updated mineral resource estimate is expected to be completed in 2028 for inclusion in a planned feasibility study. The updated resource is expected to include 50,000 meters of drilling, of which the majority is infill drilling to define reserves, targeting the 426 zone and the Ruby Deeps scheduled for 2027.
Table 2: Archimedes Underground Mineral Resource Estimate as of December 31, 2024
| Indicated Mineral Resources | ||||||
| Tonnes | Au | Ag | Au | Ag | ||
| (000) | (g/t) | (g/t) | (000 oz) | (000 oz) | ||
| 426 | 899 | 6.9 | 0.8 | 199 | 22 | |
| Ruby Deeps | 892 | 8.3 | 2.4 | 237 | 69 | |
| Total Indicated | 1,791 | 7.6 | 1.6 | 436 | 92 | |
| Inferred Mineral Resources | ||||||
| Tonnes | Au | Ag | Au | Ag | ||
| (000) | (g/t) | (g/t) | (000 oz) | (000 oz) | ||
| 426 | 1,038 | 6.6 | 1.2 | 219 | 40 | |
| Ruby Deeps | 3,150 | 7.6 | 2.4 | 769 | 246 | |
| Total Inferred | 4,188 | 7.3 | 2.1 | 988 | 286 | |
Notes to table above:
II.Mineral resources have been estimated using pressure oxidation gold metallurgical recoveries of 96.8% and 89.5% for the 426 and Ruby Deeps deposits respectively;
III. Pressure oxidation cutoff grades are 5.06 and 5.48 Au g/t (0.148 and 0.160 opt) for the 426 and Ruby Deeps deposits respectively;
VII. The reference point for mineral resources is in situ.
Economic Analysis
The Project’s NPV and IRR in relation to fluctuations in the long-term gold price are outlined in Table 3 and the Project’s cost sensitivities are illustrated in Figure 2 below. Capital costs have been sensitized against mine facilities and drilling.
Table 3: Archimedes Project Gold Price Sensitivity After-tax Analysis
| Gold Price ($/oz) | |||||||
| $2,000 | $2,175 | $2,500 | $2,750 | $2,900 | $3,000 | ||
| NPV5%(2) ($M) | $17 | $127 | $331 | $487 | $581 | $644 | |
| IRR (%) | 8 % | 23 % | 48 % | 65 % | 75 % | 81 % | |
Project Overview
Archimedes is located along the southeastern end of the Battle Mountain/Eureka gold trend. The Project is a component of the broader Ruby Hill Complex and an extension of the historically mined open pit, which was a major past-producing asset. During the 1990s, an ore body was discovered, which became the Archimedes Pit. Later discoveries included the Ruby Deeps sulfide deposit with the most recent discovery of the polymetallic Hilltop zone.
The Complex also includes the Mineral Point deposit, an open pit heap leach project, as well as several base metal deposits. Mineral Point is a large oxide gold and silver deposit with the potential to become the Company’s largest gold producing asset. An updated PEA for the Mineral Point open pit project is expected to be completed in the first quarter of 2025. Processing infrastructure at the Complex includes a primary and secondary crushing plant, grinding mill, leach pad, and carbon-in-column circuit, which are designed to process oxide material. The Archimedes deposit is composed of single refractory sulfide material, which is not amenable to the facilities at the Complex, and therefore, will be trucked to the Company’s Lone Tree property.
Geology and Mineralization
The Archimedes underground deposit is comprised of the Ruby Deeps and 426 zone, which are located immediately northwest and below the historic Archimedes Pit (see Figure 1). Both the 426 zone and Ruby Deeps consist of Carlin-Type mineralization, characterized by fine-grained pyrite with gold bearing arsenic-rich rims. In the 426 zone, mineralization is primarily located in the lower laminated portion of the Ordovician Goodwin limestone along the northeast striking 426 fault zone. The 426 zone is generally flat-lying and consists of a mixture of oxide and sulfide material. At Ruby Deeps, mineralization is found in the Cambrian Windfall limestone, Dunderberg shale, and a Cretaceous granodiorite sill, in the hanging-wall of the north striking Holly fault. The mineralized zone in Ruby Deeps is generally flat-lying and consists entirely of sulfide material.
Mining and Processing
The PEA demonstrates an initial 10-year mine life with average annual gold production of approximately 100,000 ounces of gold following ramp up. The PEA represents a preliminary point-in-time estimate of the mine plan.
Underground access will be through twin portals located in the north wall of the Archimedes Pit adjacent to the pit haulage ramp. The main decline will provide personnel and equipment access to all areas of the mine and will be wide enough to accommodate 30-ton haul trucks.
Long hole open stoping (“LHOS”) with delayed backfill is the primary mining method planned for Ruby Hill. Drift and fill mining can be implemented when the mineralization geometry does not have sufficient vertical extent to allow LHOS, sill mining, or where ground conditions will not maintain vertical stope walls. Underhand drift and fill mining is preferred since the backfill quality will be better than the rock quality.
While a small component of the upper levels of the 426 zone contains oxide mineralization, metallurgical testing has demonstrated that both the 426 and Ruby Deep zones of the Archimedes Underground are generally single refractory and require an oxidation process to increase gold extraction using whole cyanidation of mineralized material. Additionally, testing has demonstrated that the gold recovery for both deposits is materially higher when an autoclave is operated in the acidic environment.
The PEA incorporates toll-milling arrangements with associated over-the-road trucking costs for the years 2026 and 2027. Starting in 2028, the processing costs and recoveries associated with hauling to and processing at the Lone Tree autoclave in the acidic environment have been incorporated into the PEA. Processing materials in the acidic environment increases per tonne processing costs by approximately $35; however, the additional cost is offset by higher recovery rates. The oxide mineralization from the 426 zone will be processed via heap leach at the existing Complex leach pad, with the associated recoveries applied. A LOM processing schedule is illustrated in Figure 4.
Capital Cost Summary
Mine construction capital is estimated to be $49 million.
Archimedes benefits from the extensive facilities and infrastructure that remains from the Archimedes Pit. The majority of the capital budget, including mine construction and sustaining, is associated with mine development. Construction of the underground portals and associated near portal facilities is budgeted at $8.6 million. These activities are currently underway in preparation for commencement of underground development early in the second quarter of 2025.
Archimedes is expected to generate an estimated $212 million in after-tax cash flow over the current 10-year mine life (see Figure 5).
Table 4: Capital Cost Estimates
| Mine Construction |
Sustaining | |
| ($M) | ($M) | |
| Environmental, Permitting and Technical | $2.5 | $3.5 |
| Dewatering | $0 | $4.0 |
| Mine Development | $28.8 | $71.2 |
| Mine Facilities & Overhead | $8.6 | $4.1 |
| Resource Conversion Drilling | $2.1 | $8.5 |
| Contingency (15% Drilling and Development; 25% Facilities) |
$7.4 | $14.8 |
| Total Capital Cost | $49.4 | $106.1 |
Operating Cost Summary
The PEA estimates cash costs(1) of $1,769 per ounce of gold and all-in sustaining costs(1) of $1,893 per ounce of gold for the LOM (see Table 5). Cash and all-in-sustaining costs include a non-cash capital toll milling charge through the Company’s Lone Tree autoclave of $21 per tonne or approximately $100 per ounce of gold. Figure 6 illustrates these operating costs over Archimedes’ estimated production profile.
Table 5: Total and Unit Operating Costs
| Total Costs | Unit Cost | Cost per Ounce | |
| ($M) | ($/t milled) | ($/oz Au) | |
| Mining | $750.0 | $164.2 | $808 |
| Transportation & Processing | $682.2 | $149.4 | $735 |
| G&A, Royalties & Net Proceeds Tax | $210.4 | $46.1 | $227 |
| By-Product Credits | ($0.7) | ($0.1) | ($1) |
| Total Operating Cost/Cash Costs(1) | $1,642.0 | $359.5 | $1,769 |
| Closure & Reclamation | $8.9 | $1.9 | $10 |
| Sustaining Capital | $106.1 | $23.2 | $114 |
| All-in Sustaining Costs(1) | $1,757.0 | $384.7 | $1,893 |
Table 6: Development Cost Per Foot (Excluding 15% Contingency)
| Total Development |
Cost | |
| (feet) | ($/foot) | |
| Primary Capital Drifting | 25,640 | $2,000 |
| Secondary Capital Drifting | 21,245 | $2,000 |
| Capital Raising | 1,548 | $4,000 |
| Total/Weighted Average | 48,434 | $2,064 |
Permitting
The phased permitting process at Archimedes is well underway, allowing for simultaneous mining while permitting for the next phase progresses. The initial phase covers mining activities above the 5100-foot elevation, a threshold consistent with previously approved permits for open pit mining at Ruby Hill. The first phase of permitting is nearing completion and once finalized, will allow for mining through June 2027.
The second phase of permitting covers mining below the 5100-foot elevation and is set to begin immediately upon receipt of the first phase of permits. This phase is scheduled for completion by the end of the second quarter 2027, with the objective of ensuring uninterrupted mining at the Project.
National Environmental Policy Act (“NEPA”) associated permitting activities continue to progress. Amended Plan of Operations and Environmental Assessment documents have been provided to the Bureau of Land Management (“BLM”) with the next step being completion of the Decision Record (DR). Nevada Division of Environmental Protection (“NDEP”) permitting activities are also progressing, focusing on the site’s Water Pollution Control Permits. Both the NEPA and NDEP permits are expected at the end of the first quarter of 2025.
Next Steps to Feasibility Study
A feasibility study in accordance with National Instrument 43-101 – Standards of Disclosure for Mineral Projects and Subpart 1300 of Regulation S-K with an updated mineral resource estimate is expected to be completed in 2028. The updated resource is expected to include 50,000 meters of drilling targeting the 426 zone and the Ruby Deeps. Below is a summary of additional work to be conducted.
Resource Delineation and Exploration
Permitting
Metallurgical Testing
Additional metallurgical testing is required from the initial Ruby Hill production areas to confirm metallurgical recoveries with Lone Tree autoclave process conditions. Sample selection will be based on available mine production plans to reflect typical stope dimensions and expected dilution. Testing will include:
Technical Disclosure and Qualified Persons
The PEA was prepared in accordance with NI 43-101. The full PEA will be filed within 45 days under the Company’s issuer profile on SEDAR+ at www.sedarplus.ca and on i-80 Gold’s profile. An Initial Assessment for the Archimedes Underground Project was also prepared in accordance with S-K 1300 and Item 601 of the Regulation S-K and the S-K 1300 Report will be filed on EDGAR at www.sec.gov. Both reports will be available on the Company’s website at www.i80gold.com. The mineral estimates and project economics are the same under the PEA and the S-K 1300 Report.
The technical information contained in this press release has been prepared under the supervision of, and has been reviewed and approved by Dagny Odell, P.E., (SME No. 2402150) Practical Mining LLC, and Tyler Hill CPG., Vice President Geology for the Company, who are all qualified persons within the meaning of NI 43-101 and S-K 1300.
For a description of the data verification, assay procedures and the quality assurance program and quality control measures applied by the Company, please see the Company’s Annual Information Form dated March 12, 2024 filed under the Company’s profile on SEDAR+ at www.sedarplus.ca and filed with the Company’s Form 40-F under the Company’s profile on EDGAR at www.sec.gov. Further information about the PEA referenced in this news release, including information in respect of data verification, key assumptions, parameters, risks and other factors, will be contained in the PEA.
The PEA is preliminary in nature and includes an economic analysis that is based, in part, on inferred mineral resources. Inferred mineral resources that are considered too speculative geologically to have for the application of economic considerations applied to them that would enable them to be categorized as mineral reserves, and there is no certainty that the results of the PEA will be realized. Mineral resources do not have demonstrated economic viability and are not mineral reserves.
Endnotes
About i-80 Gold Corp.
i-80 Gold Corp. is a Nevada-focused mining company with the fourth largest gold mineral resources in the state of Nevada. The recapitalization plan underway is designed to unlock the value of the Company’s high-grade gold deposits to create a Nevada mid-tier gold producer. i-80 Gold’s common shares are listed on the TSX and the NYSE American under the trading symbol IAU:TSX and IAUX:NYSE. Further information about i-80 Gold’s portfolio of assets and long-term growth strategy is available at www.i80gold.com or by email at info@i80gold.com.
APPENDIX
Archimedes Underground Project Detailed Cash Flow Model
All amounts are in United States dollars, unless otherwise stated.
| Archimedes Underground |
UNITS | TOTAL LOM |
2025 | 2026 | 2027 | 2028 | 2029 | 2030 | 2031 | 2032 | 2033 | 2034 | 2035 | 2036 | 2037 | 2038 | 2039 | 2040 +1 |
|||||||||||||||||
| MINING | |||||||||||||||||||||||||||||||||||
| Mine Life | Years | ~10 | |||||||||||||||||||||||||||||||||
| Mineralized Material Mined (incl. marginal) |
k tonnes | 4,567 | – | 41.8 | 258.6 | 473.1 | 572.9 | 533.5 | 558.8 | 561.4 | 573.1 | 569.4 | 400.0 | 24.2 | – | – | – | – | |||||||||||||||||
| Waste Moved | k tonnes | 1,354 | – | 11.6 | 96.4 | 160.6 | 193.9 | 265.0 | 123.6 | 255.0 | 84.6 | 106.0 | 54.1 | 2.9 | – | – | – | – | |||||||||||||||||
| Total Moved | k tonnes | 5,921 | – | 53.4 | 355.0 | 633.7 | 766.8 | 798.5 | 682.4 | 816.4 | 657.7 | 675.4 | 454.2 | 27.1 | – | – | – | – | |||||||||||||||||
| Daily Mining Rate | tpd | 782 | – | 114.5 | 708.6 | 1,296.1 | 1,569.7 | 1,461.6 | 1,531.0 | 1,538.1 | 1,570.0 | 1,560.0 | 1,096.0 | 66.4 | – | – | – | – | |||||||||||||||||
| Backfill Placed | k tonnes | 3,488 | – | 32.0 | 148.9 | 380.2 | 460.1 | 479.1 | 409.4 | 489.9 | 394.6 | 405.3 | 272.5 | 16.3 | – | – | – | – | |||||||||||||||||
| Capitalized Mining | k tonnes | 867 | 47.5 | 194.2 | 100.5 | 223.9 | 201.1 | 21.6 | 31.6 | 24.5 | 21.9 | – | – | – | – | – | – | – | |||||||||||||||||
| PROCESSING | |||||||||||||||||||||||||||||||||||
| Total Material for Processing | k tonnes | 4,567 | 42 | 259 | 473 | 573 | 533 | 559 | 561 | 573 | 569 | 400 | 24 | – | – | – | – | ||||||||||||||||||
| Gold Average Grade | g/t Au | 7.0 | 6.60 | 6.70 | 6.79 | 6.92 | 7.22 | 6.89 | 6.75 | 7.35 | 7.48 | 6.90 | 7.01 | – | – | – | – | ||||||||||||||||||
| Contained Gold | ‘000 oz Au | 1,031 | 8.9 | 55.7 | 103.3 | 127.4 | 123.9 | 123.8 | 121.8 | 135.3 | 137.0 | 88.7 | 5.5 | – | – | – | – | ||||||||||||||||||
| Heap Leach Processing | |||||||||||||||||||||||||||||||||||
| Total Tonnes Processed | k tonnes | 171 | 15 | 56 | 75 | 25 | 1 | – | – | – | – | – | – | – | – | – | – | ||||||||||||||||||
| Gold Grade | g/t Au | 3.82 | 4.02 | 3.63 | 3.76 | 4.35 | 2.30 | – | – | – | – | – | – | – | – | – | – | ||||||||||||||||||
| Silver Grade | g/t Ag | 0.52 | 0.45 | 0.47 | 0.55 | 0.59 | 1.79 | – | – | – | – | – | – | – | – | – | – | ||||||||||||||||||
| Contained Gold | ‘000 oz Au | 21.0 | 2.0 | 6.5 | 9.0 | 3.5 | 0.0 | – | – | – | – | – | – | – | – | – | – | ||||||||||||||||||
| Contained Silver | ‘000 oz Ag | 2.9 | 0.2 | 0.8 | 1.3 | 0.5 | 0.0 | – | – | – | – | – | – | – | – | – | – | ||||||||||||||||||
| Gold Average Recovery | % | 87 % | 87 % | 87 % | 87 % | 87 % | 87 % | – | – | – | – | – | – | – | – | – | – | ||||||||||||||||||
| Silver Average Recovery | % | 15 % | 15 % | 15 % | 15 % | 15 % | 15 % | – | – | – | – | – | – | – | – | – | – | ||||||||||||||||||
| Recovered Gold | ‘000 oz Au | 18 | 1.7 | 5.7 | 7.9 | 3.0 | 0.0 | – | – | – | – | – | – | – | – | – | – | ||||||||||||||||||
| Recovered Silver | ‘000 oz Ag | 0.4 | 0.0 | 0.1 | 0.2 | 0.1 | 0.0 | – | – | – | – | – | – | – | – | – | – | ||||||||||||||||||
| Autoclave Processing | |||||||||||||||||||||||||||||||||||
| Total Tonnes Processed | k tonnes | 4,166 | 398 | 548 | 533 | 559 | 561 | 573 | 569 | 400 | 24 | – | – | – | – | ||||||||||||||||||||
| Gold Grade | g/t Au | 7.12 | 7.36 | 7.03 | 7.23 | 6.89 | 6.75 | 7.35 | 7.48 | 6.90 | 7.01 | – | – | – | – | ||||||||||||||||||||
| Silver Grade | g/t Ag | 1.72 | 0.77 | 0.96 | 1.23 | 2.15 | 2.21 | 2.34 | 2.07 | 1.68 | 1.58 | – | – | – | – | ||||||||||||||||||||
| Contained Gold | ‘000 oz Au | 954 | 94.3 | 123.9 | 123.8 | 123.8 | 121.8 | 135.3 | 137.0 | 88.7 | 5.5 | – | – | – | – | ||||||||||||||||||||
| Contained Silver | ‘000 oz Ag | 230 | 9.8 | 17.0 | 21.1 | 38.6 | 39.9 | 43.2 | 37.8 | 21.7 | 1.2 | – | – | – | – | ||||||||||||||||||||
| Gold Average Recovery | % | 90 % | 90 % | 90 % | 90 % | 90 % | 90 % | 90 % | 90 % | 90 % | 90 % | – | – | – | – | ||||||||||||||||||||
| Silver Average Recovery | % | 10 % | 10 % | 10 % | 10 % | 10 % | 10 % | 10 % | 10 % | 10 % | 10 % | – | – | – | – | ||||||||||||||||||||
| Recovered Gold | ‘000 oz Au | 877 | 89.2 | 116.8 | 119.4 | 114.5 | 109.0 | 121.1 | 122.6 | 79.4 | 4.9 | – | – | – | – | ||||||||||||||||||||
| Recovered Silver | ‘000 oz Ag | 23 | 1.0 | 1.7 | 2.1 | 3.9 | 4.0 | 4.3 | 3.8 | 2.2 | 0.1 | – | – | – | – | ||||||||||||||||||||
| Toll Mill Processing | |||||||||||||||||||||||||||||||||||
| Total Tonnes Processed | k tonnes | 230 | 26 | 203 | |||||||||||||||||||||||||||||||
| Gold Grade | g/t Au | 7.61 | 8.10 | 7.55 | |||||||||||||||||||||||||||||||
| Silver Grade | g/t Ag | 1.20 | 1.39 | 1.17 | |||||||||||||||||||||||||||||||
| Contained Gold | ‘000 oz Au | 56 | 6.9 | 49.3 | – | – | – | – | – | – | – | – | – | – | – | – | – | ||||||||||||||||||
| Contained Silver | ‘000 oz Ag | 8.8 | 1.2 | 7.6 | – | – | – | – | – | – | – | – | – | – | – | – | – | ||||||||||||||||||
| Gold Average Recovery | % | 58 % | 58 % | 58 % | – | – | – | – | – | – | – | – | – | – | – | – | – | ||||||||||||||||||
| Silver Average Recovery | % | 10 % | 10 % | 10 % | – | – | – | – | – | – | – | – | – | – | – | – | – | ||||||||||||||||||
| Recovered Gold | ‘000 oz Au | 33 | 4.0 | 28.6 | |||||||||||||||||||||||||||||||
| Recovered Silver | ‘000 oz Ag | 1 | 0.1 | 0.8 | |||||||||||||||||||||||||||||||
| Total Tonnes Processed | k tonnes | 4,567 | 41.8 | 258.6 | 473.1 | 572.9 | 533.5 | 558.8 | 561.4 | 573.1 | 569.4 | 400.0 | 24.2 | – | – | – | – | ||||||||||||||||||
| Total Gold Production | ‘000 oz Au | 928 | 5.7 | 34.2 | 97.1 | 119.8 | 119.5 | 114.5 | 109.0 | 121.1 | 122.6 | 79.4 | 4.9 | – | – | – | – | ||||||||||||||||||
| Total Silver Production | ‘000 oz Ag | 24 | 0.2 | 0.9 | 1.2 | 1.8 | 2.1 | 3.9 | 4.0 | 4.3 | 3.8 | 2.2 | 0.1 | – | – | – | – | ||||||||||||||||||
| REVENUE | |||||||||||||||||||||||||||||||||||
| Gold Price | $/oz Au | $2,175 | $2,175 | $2,175 | $2,175 | $2,175 | $2,175 | $2,175 | $2,175 | $2,175 | $2,175 | $2,175 | $2,175 | $2,175 | $2,175 | $2,175 | $2,175 | $2,175 | |||||||||||||||||
| Silver Price | $/oz Ag | $27.25 | $27.25 | $27.25 | $27.25 | $27.25 | $27.25 | $27.25 | $27.25 | $27.25 | $27.25 | $27.25 | $27.25 | $27.25 | $27.25 | $27.25 | $27.25 | $27.25 | |||||||||||||||||
| Revenues | $M | $2,019 | – | $12 | $74 | $211 | $261 | $260 | $249 | $237 | $264 | $267 | $173 | $11 | – | – | – | – | |||||||||||||||||
| OPERATING COSTS | |||||||||||||||||||||||||||||||||||
| Mining Costs (Mineralized Material incl. Backfill) | $M | $594 | – | $5.5 | $32.4 | $62.4 | $76.0 | $73.3 | $72.1 | $74.7 | $71.8 | $72.3 | $51.0 | $3.0 | – | – | – | – | |||||||||||||||||
| Mining Costs (Waste) | $M | $156 | – | $1.4 | $11.4 | $18.5 | $22.3 | $30.8 | $14.4 | $28.8 | $9.7 | $11.9 | $6.0 | $0.3 | – | – | – | – | |||||||||||||||||
| Heap Leach Processing | $M | $1.2 | – | $0.1 | $0.4 | $0.5 | $0.2 | $0.0 | – | – | – | – | – | – | – | – | – | – | |||||||||||||||||
| Processing Autoclave | $M | $489 | – | – | – | $46.8 | $64.3 | $62.5 | $65.6 | $65.9 | $67.2 | $66.8 | $46.9 | $2.8 | – | – | – | – | |||||||||||||||||
| Transportation | $M | $192 | – | $1.4 | $10.9 | $17.2 | $23.7 | $23.0 | $24.1 | $24.2 | $24.7 | $24.6 | $17.3 | $1.0 | – | – | – | – | |||||||||||||||||
| Electrical Power | $M | $29 | – | $0.6 | $1.5 | $2.9 | $3.4 | $3.7 | $4.0 | $3.4 | $2.6 | $2.6 | $2.5 | $2.3 | – | – | – | – | |||||||||||||||||
| G&A | $M | $79 | – | $3.9 | $7.5 | $7.5 | $7.5 | $7.5 | $7.5 | $7.5 | $7.5 | $7.5 | $7.5 | $7.5 | – | – | – | – | |||||||||||||||||
| Total Operating Cost | $M | $1,541 | – | $12.9 | $64.1 | $155.9 | $197.4 | $200.8 | $187.7 | $204.4 | $183.6 | $185.7 | $131.2 | $17.1 | – | – | – | – | |||||||||||||||||
| Refining & Sales | $M | $1.7 | – | $0.0 | $0.1 | $0.2 | $0.2 | $0.2 | $0.2 | $0.2 | $0.2 | $0.2 | $0.1 | $0.0 | – | – | – | – | |||||||||||||||||
| Royalties & State Taxes | $M | $100.2 | – | $0.4 | $3.0 | $10.8 | $13.1 | $12.8 | $12.5 | $10.6 | $14.0 | $14.2 | $8.5 | $0.3 | – | – | – | – | |||||||||||||||||
| Mining Costs (Mineralized Material) | $/t mined | $130.2 | – | $132 | $125 | $132 | $133 | $137 | $129 | $133 | $125 | $127 | $127 | $126 | – | – | – | – | |||||||||||||||||
| Mining Costs (Waste) | $/t mined | $114.9 | – | $119 | $119 | $115 | $115 | $116 | $116 | $113 | $115 | $113 | $111 | $110 | – | – | – | – | |||||||||||||||||
| Mining Costs (Mineralized material & Waste ) | $/t mined | $126.7 | – | $129 | $123 | $128 | $128 | $130 | $127 | $127 | $124 | $125 | $125 | $124 | |||||||||||||||||||||
| Processing (Heap leach) |
$/t milled | $6.8 | – | $7 | $6 | $7 | $8 | $5 | – | – | – | – | – | – | – | – | – | – | |||||||||||||||||
| Processing (Autoclave) | $/t milled | $117.3 | – | – | – | $117 | $117 | $117 | $117 | $117 | $117 | $117 | $117 | $117 | – | – | – | – | |||||||||||||||||
| Transportation | $/t milled | $42.1 | – | $34 | $42 | $36 | $41 | $43 | $43 | $43 | $43 | $43 | $43 | $43 | – | – | – | – | |||||||||||||||||
| Electrical Power | $/t milled | $6.4 | – | $14 | $6 | $6 | $6 | $7 | $7 | $6 | $5 | $5 | $6 | $97 | – | – | – | – | |||||||||||||||||
| G&A | $/t milled | $17.3 | – | $94 | $29 | $16 | $13 | $14 | $13 | $13 | $13 | $13 | $19 | $310 | – | – | – | – | |||||||||||||||||
| Total | $/t milled | $337.4 | – | $309 | $248 | $329 | $345 | $376 | $336 | $364 | $320 | $326 | $328 | $707 | – | – | – | – | |||||||||||||||||
| CAPITAL EXPENDITURES | |||||||||||||||||||||||||||||||||||
| Construction Capital | $M | $47.3 | $16.5 | $30.8 | – | – | – | – | – | – | – | – | – | – | – | – | – | – | |||||||||||||||||
| Definition & Conversion Drilling(1) | $M | $10.6 | $2.1 | – | $8.5 | – | – | – | – | – | – | – | – | – | – | – | – | – | |||||||||||||||||
| Sustaining Capital | $M | $97.6 | – | – | $22.5 | $33.7 | $26.0 | $4.0 | $5.2 | $3.5 | $2.8 | – | – | – | – | – | – | – | |||||||||||||||||
| Total Capital | $M | $155.5 | $18.6 | $30.8 | $31.0 | $33.7 | $26.0 | $4.0 | $5.2 | $3.5 | $2.8 | – | – | – | – | – | – | – | |||||||||||||||||
| Reclamation(2) | $M | $8.9 | $0.4 | $0.4 | $0.4 | $0.5 | $0.5 | $0.5 | $0.5 | $0.5 | $0.5 | $0.5 | $0.5 | $0.6 | $0.6 | $0.6 | $0.6 | $1.8 | |||||||||||||||||
| CASH COSTS & AISC | |||||||||||||||||||||||||||||||||||
| Total Cash Costs (Incl. Royalty) |
$/oz | $1,769 | – | $2,321 | $1,961 | $1,718 | $1,758 | $1,789 | $1,749 | $1,973 | $1,632 | $1,631 | $1,760 | $3,569 | – | – | – | – | |||||||||||||||||
| All-in Sustaining Costs(2) | $/oz | $1,893 | – | $2,385 | $2,877 | $2,070 | $1,979 | $1,826 | $1,798 | $2,009 | $1,659 | $1,635 | $1,766 | $3,685 | – | – | – | – | |||||||||||||||||
| CASH FLOW ANALYSIS | |||||||||||||||||||||||||||||||||||
| Revenue | $M | $2,018.9 | – | $12 | $74 | $211 | $261 | $260 | $249 | $237 | $264 | $267 | $173 | $11 | – | – | – | – | |||||||||||||||||
| Operating Costs Gold and Royalties | $M | ($1,642.6) | – | ($13) | ($67) | ($167) | ($211) | ($214) | ($200) | ($215) | ($198) | ($200) | ($140) | ($17) | – | – | – | – | |||||||||||||||||
| Reclamation Accrual | $M | ($8.9) | – | ($0.1) | ($0.3) | ($0.9) | ($1.1) | ($1.1) | ($1.1) | ($1.0) | ($1.2) | ($1.2) | ($0.8) | ($0.0) | – | – | – | – | |||||||||||||||||
| Depreciation | $M | ($270.0) | – | ($1) | ($7) | ($24) | ($34) | ($34) | ($34) | ($33) | ($38) | ($38) | ($25) | ($2) | – | – | – | – | |||||||||||||||||
| Net Operating Income (Pre-Tax) | $M | $97.4 | – | ($2) | ($0) | $19 | $15 | $11 | $14 | ($12) | $27 | $27 | $7 | ($8) | – | – | – | – | |||||||||||||||||
| Income Taxes | $M | – | – | – | – | – | – | – | – | – | – | – | – | – | – | – | – | – | |||||||||||||||||
| Net Income | $M | $97.4 | – | ($2) | ($0) | $19 | $15 | $11 | $14 | ($12) | $27 | $27 | $7 | ($8) | – | – | – | – | |||||||||||||||||
| Depreciation | $M | $270.0 | – | $1.0 | $7.2 | $24.1 | $33.7 | $34.3 | $33.9 | $33.2 | $37.9 | $38.4 | $24.8 | $1.5 | – | – | – | – | |||||||||||||||||
| Reclamation | $M | $0.0 | ($0.4) | ($0.3) | ($0.0) | $0.5 | $0.7 | $0.7 | $0.6 | $0.6 | $0.7 | $0.7 | $0.3 | ($0.5) | ($0.6) | ($0.6) | ($0.6) | ($1.8) | |||||||||||||||||
| Working Capital | $M | $0.0 | – | ($1.5) | ($6.2) | ($11.5) | ($5.1) | ($0.4) | $1.5 | ($1.7) | $2.0 | ($0.3) | $7.0 | $14.1 | $2.0 | – | – | – | |||||||||||||||||
| Operating Cash Flow | $M | $367.4 | ($0) | ($3) | $1 | $32 | $44 | $45 | $50 | $20 | $67 | $66 | $39 | $7 | $1 | ($1) | ($1) | ($2) | |||||||||||||||||
| Capital Expenditures | $M | ($155.5) | ($19) | ($31) | ($31) | ($34) | ($26) | ($4) | ($5) | ($3) | ($3) | – | – | – | – | – | – | – | |||||||||||||||||
| NET CASH FLOW | $M | $211.9 | ($19) | ($34) | ($30) | ($1) | $18 | $41 | $45 | $16 | $65 | $66 | $39 | $7 | $1 | ($1) | ($1) | ($2) | |||||||||||||||||
| PROJECT ECONOMICS | |||||||||||||||||||||||||||||||||||
| After-tax NPV 5% Discounting |
$M | $127 | |||||||||||||||||||||||||||||||||
| 23 % | |||||||||||||||||||||||||||||||||||
| Notes to table above:
(1) A portion of the drilling capital ($2.1M) is included in construction capital, while the remaining $8.5M is classified as sustaining capital. (2) The annual calculation for all-in sustaining costs include reclamation costs on a cash basis rather than on an accrual basis. As such, the weighted average of the annual all-in sustaining costs amounts will not agree to the life of mine all-in sustaining costs. |
|||||||||||||||||||||||||||||||||||
Hudbay Minerals Inc. (TSX:HBM) (NYSE: HBM) today released its ann... READ MORE
Strategic acquisition of an established operating gold mine, loca... READ MORE
Cerro de Pasco Resources Inc. (TSX-V: CDPR) (OTCQB: GPPRF) (FRA: ... READ MORE
The Garneau Titanium Project Features Ilmenite-Rich Boulder with ... READ MORE
ValOre Metals Corp. (TSX‐V: VO) (OTCQB: KVLQF) (Frankfurt: KEQ0... READ MORE


