


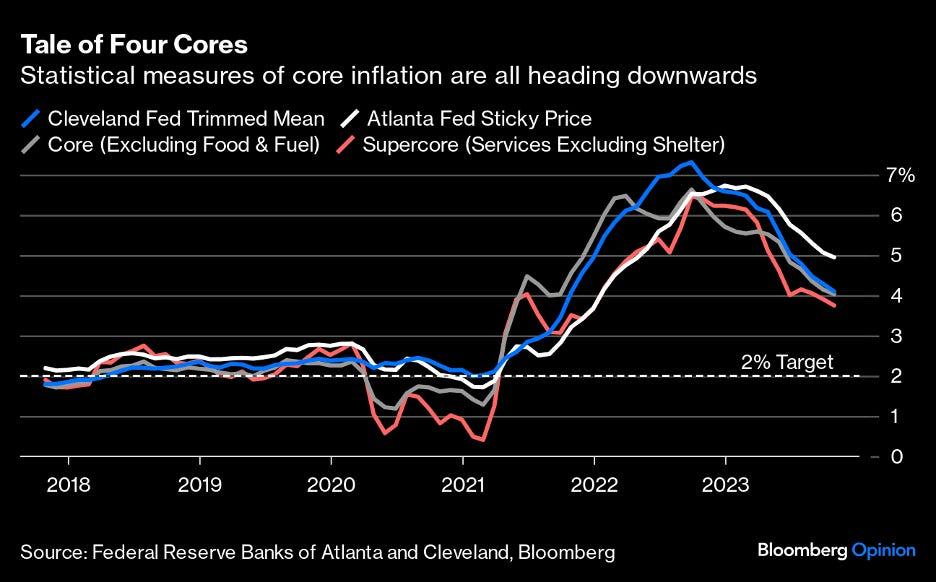
A few good data points sent markets higher this week. Key among those good data points were weak inflation numbers, showing CPI and all its permutation extended steady declines in October. That seems to have cemented the idea that rates have topped, which sent yields down so markedly that it seemed the bond rout of the last year might have ended.
At least, it seemed that way for a day.
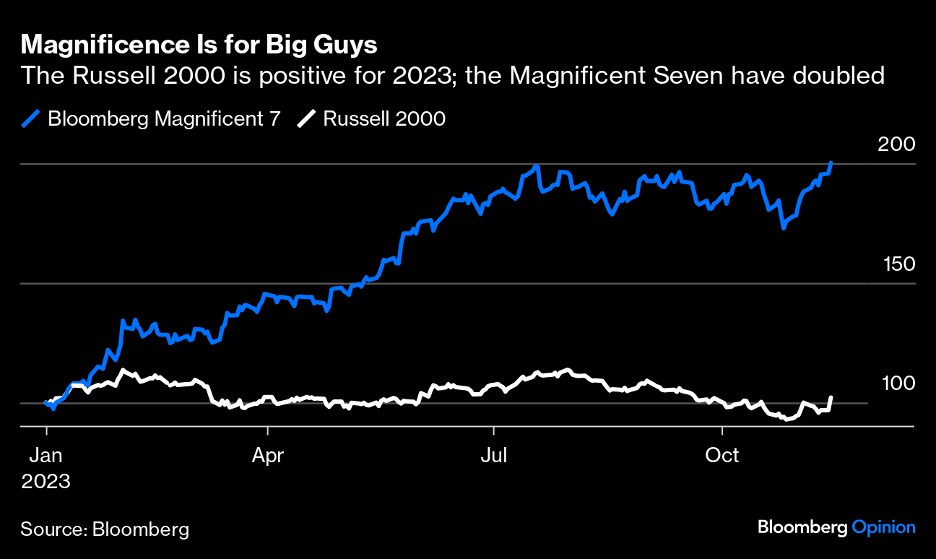
I start with this because man oh man it remains strange out there. Stocks ripping higher while growth slows; bond yields rising while inflation falls; seven stocks responsible for pulling entire stock market higher.
In today’s comment, I want to highlight some of the strangeness. I’ll do it point form, rather than my usual extended blather.
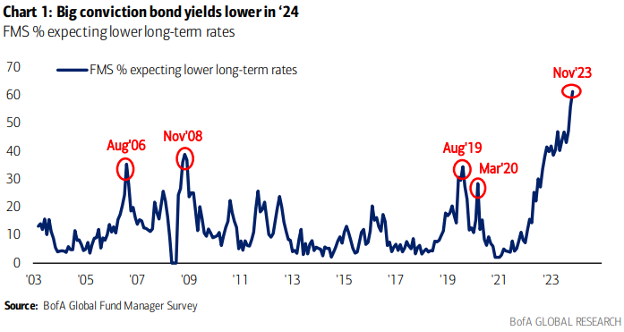
Now, with inflation seemingly under control and unemployment rising, there’s little reason to expect any more rate hikes. Instead the conversation is now all about cuts. That explains the chart below. All kinds of investors have been watching bonds for the last year, waiting for the chance to buy. And this Bank of America survey says fund managers think that time is now: a record number think long-term yields are heading down from here.
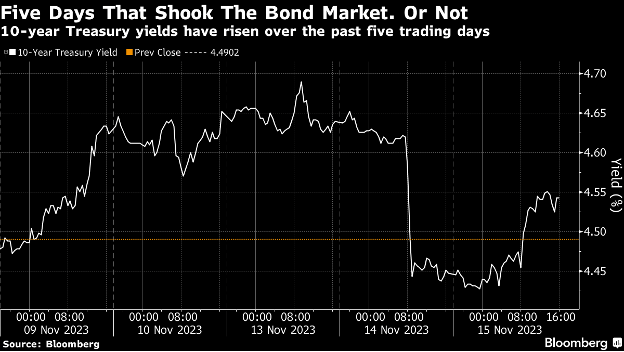
The way bonds yields plummeted on that October inflation print had people proclaiming the bond rout was over, bolstered by charts like this.
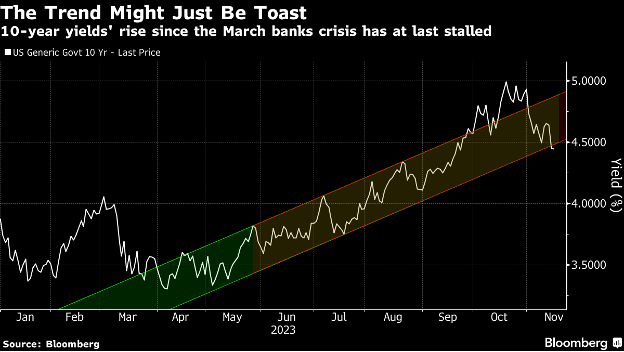
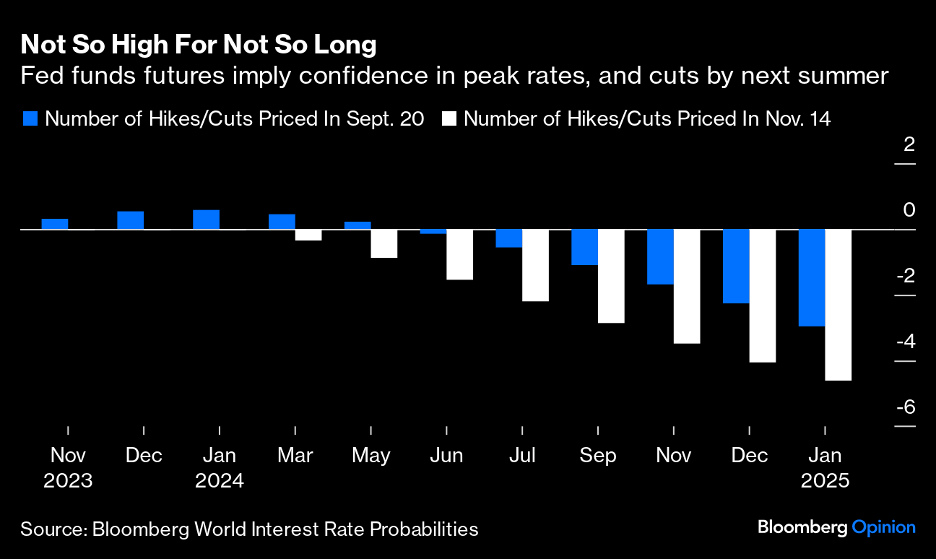
Yields bumped higher again only a day later, a reminder that change takes time. For now markets are expecting rates to still be above 4% entering 2025 (five cuts would bring the rate to 4-4.25%). If we get a recession, cuts will be bigger and faster than that.
When we look at who bid…
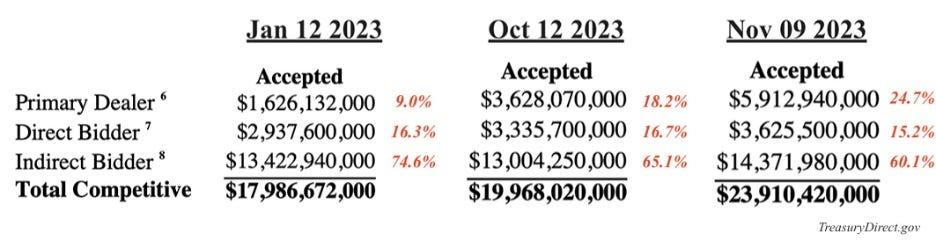
Foreign buyers (indirect bidders) dropped to 60.1% from 74.6% at the start of the year.
Institutions (direct bidders) failed to make up the difference, taking only 15.2% (down slightly over the year). That left primary dealers holding the bag for almost 25%, versus 9% in January.
When the BTC is bad, the tail grows. The tail is the difference between where bond yields trade when issued versus at auction (expected versus actual yield). Tails are usually 2 to 3 basis points. Anything above 4 is bad.
This auction had a 5.3 basis point tail. That’s the worst tail for a 30y auction since 2011, when the S&P downgraded US credit rating from AAA to AA+.
There is one important note to add to this story: ICBC, the Chinese bank, is a big player in the Treasury market. And it was hit with some kind of cyber attack on Thursday that killed its bids, which made the bid side weaker than it really was. It’s impossible to know how much difference ICBC would have made. We’ll just have to see what happens at the next long-dated Treasury auction.
That disastrous auction happened shortly after the US Treasury released an issuance calendar showing less borrowing in Q4 than expected, and a plan to borrow more on the short end of the curve than the long end.
This was obviously an effort to manage fears of a near-term T-bill tsunami. The Treasury even said as much:
“Primary dealers explicitly noted a high degree of uncertainty overall around deficit and growth forecasts, reinforcing Treasury’s need to maintain flexibility.”
My Take: this is the Treasury admitting that primary dealers (the banks that buy T Bills and then resell them to investors) are worried that weak demand is going to leave them stuck having to buy more of the auctions than they want.
Remember the context: the US government is running a $2-trillion annual deficit and therefore must issue more debt every year, even while buyers drift away. The T Bill marketplace is still immense; it isn’t going to dry up quickly. But the Treasury itself just acknowledged there’s an issue.
Uncertainty in the bond market – will yields turn up again because there really is too much supply or is the bond rout done because rates are topped? – makes for a shaky foundation to a market that doesn’t really know which way to go. Inflation seems to be coming down (which is good) but unemployment is rising, growth is slowing, and valuation multiples for Big Tech look rich in that context.
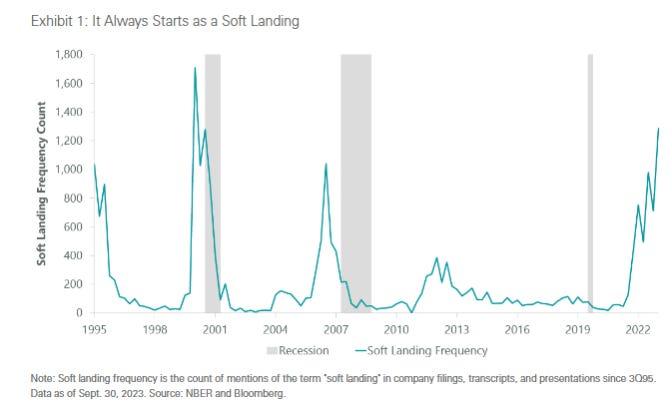
And soft landings are usually not real; they’re the optimist’s view on the lead-up to a recession.
Recession risk is real. Rates are likely topped. Gold could do well in such an environment. Base metals will have to keep waiting.
Courtesy of the Resource Maven
Contango Silver and Gold Inc. (NYSE:CTGO) (TSX: CTGO) is pleased ... READ MORE
Morocco Strategic Minerals Corporation. (TSX-V: MCC) is pleased t... READ MORE
Sun Summit Minerals Corp. (TSX-V: SMN) (OTCQB: SMREF) is pleased ... READ MORE
Grid Metals Corp. (TSX-V:GRDM) (OTCQB:MSMGF) is pleased to report... READ MORE
Brazil Potash Corp. (NYSE: GRO), a mineral exploration and develo... READ MORE


