Gwen Preston – “Is It 1999 Again? The Gold Space Needs New Investors”
Is It 1999 Again?
I have to credit John Authers of Bloomberg for this comparative process; I’m telling the story he told in this Guardian article.
Authers compared the ARKK/Bitcoin/FAANG bubble we just lived through or are still in (I’ll get to that) and the dot-com bubble. All bubbles require easy money and a plausible investment case. Check for both. Bubbles get extreme when central banks are forced to make money easier when they would otherwise be tightening. Another check for both.
From here, Authers pointed out that we have to figure out how recent bank failures fit into the picture. When Silicon Valley Bank failed, many compared it to Bear Stearns. In that 2008 bank collapse, speculators managed a short stock rally before everything crashed hard. If that’s the analogy, everyone should get out of the stock market.
But Authers suggests that perhaps a Long Term Capital Management is a better comparison. LTCM is the hedge fund that melted down in 1998. It was big enough that the Fed rescued it and its collapse scary enough that the Fed soon cut rates to try to calm market fears. After that, the dot-com bubble continued for 18 months (!). The Fed turned back to tightening during that last bull leg but soon had to cut again because it wanted to ensure sufficient liquidity to bolster markets through the fears of Y2K.
A bank or hedge fund melting down and being rescued in the context of a stock market bubble is a start but we need more connections for this comparison to matter. There are several. To start, the Fed is injecting liquidity right now to contain the banking crisis. It created a facility to lend money to banks struggling with deeply underwater bond portfolios and almost all of the S&P 500’s gains for the year happened from March 13 to April 13, coincident with the creation and growth of that facility plus the expansion of the Fed’s balance sheet in response to the banking crisis.
There’s even a parallel for the Y2K challenge: AI, which has the potential to force the Fed into a supportive role (AI replacing jobs on masse would prompt the Fed to cut rates, for instance).
The reason to bring all this up is that, if SVB was LTCM, then markets could keep rallying for another year.
Or the parallels could be meaningless. While less, I have also seen some convincing bear data around. More than 90% of the Treasury curve is inverted, which is a reliable indicator not only that a recession is coming but that it is coming soon. Banks are tightening their lending standards. M2 money supply is falling. Retail sales are sliding. And China’s post-COVID recovery is turning out to be more a whimper than a bang: business and consumer confidence is low, debt is problematic at all levels, households are cutting spending, Beijing has not announced large infrastructure spending programs (tapped out perhaps?), and industrial growth is slow.
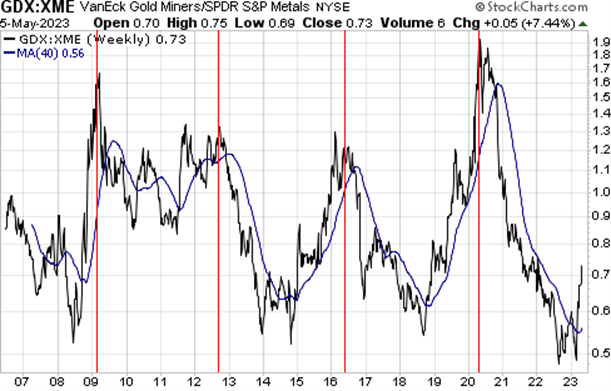
Then there’s that darn debt ceiling thing. If the bear pressures I just noted plus liquidity moving to that flood of Treasuries do push stocks down following a debt deal, it would likely help this chart continue upward.
This shows gold mining stocks (represented by GDX) relative to general mining stocks (represented by XME), the latter as an indication of the overall economy. The ratio double-bottomed in August and February and is now heading up. It’s a nicely cyclical chart and, if the pattern continues, the gold sector should see its next major relative strength peak between late 2023 and mid-2024.
(Note that a decline after that peak could happen because mining stocks start to rise. When that happens, gold stocks don’t necessarily fall; gold usually gets carried along as part of an overall metals bull market. But gold stocks would underperform relative to mining stocks.)
In Need of New Gold Investors
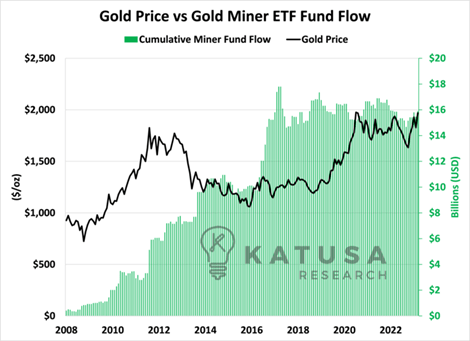
What we need for this to really happen is for new money to come into gold stocks. My old boss Marin Katusa published a really interesting chart on this in his free weekly letter last week
(head to his website to sign up if interested).
This chart shows cumulative monthly fund flows for gold mining ETFs alongside the price of gold. What stands out is that there has been essentially no new money entering the gold mining space since 2016.
The gold mining sector needs new capital. To run, gold stocks need to attract attention from a new swath of investors. It’s possible – a recession would do it as would a broad metals bull market or a renewed surge of investors actively moving their money from mutual funds to ETFs (the chart shows that all of those scenarios pulled significant new fund flows into gold miners).
In the meantime…bond yields are rising, which is strengthening the US Dollar. The USD climbing above its 50-day moving average likely accounts for much of gold’s slide last week. This setup could well persist for some time, as bond yields will remain high until well after a debt deal happens because of all the new debt the Treasury will throw at the market. Lots of supply means it will take higher yields to find buyers.
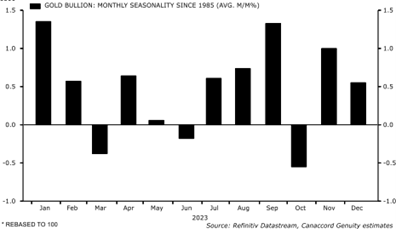
One near-term positive to look forward to is seasonality. Seasonality turns positive for gold in July.
MORE or "UNCATEGORIZED"
Delta Reports New Gold Intercept at Nova Target in Wedge Area, 4 Kilometres West of Eureka; Follow-Up Drill Program Underway
Delta Reports New Gold Intercept at Nova Target in Wedge Area, 4 ... READ MORE
Silver One Announces Closing Of Final Tranche Of $32 Million Financing
Silver One Resources Inc. (TSX-V: SVE) (OTCQX: SLVRF) (FSE: BRK1)... READ MORE
SAGA Metals Achieves 100% Drilling Success in 2025—Reports Final Assays from Trapper South at Radar Critical Minerals Project in Labrador
Exceptional grades of Titanium, Vanadium and Iron in all 15 drill... READ MORE
Near Surface Intersection Yields 6.58 g/t gold over 10.35 metres
Intersection is within 33 metres from surface and contained in a ... READ MORE
Alamos Gold Provides Three-Year Operating Guidance Outlining 46% Production Growth by 2028 at Significantly Lower Costs
Further production growth to one million ounces annually expected... READ MORE


