


Anyone who reads my work knows that I’m bullish on gold going into 2020. The fundamental forces are well aligned, led by negative real rates.
There is one force that isn’t playing along: the US stock market. The bull market in US stocks is the biggest headwind for gold. It captures whether investors need safety or not. As long as stocks keep rising, investors don’t feel much need to flee.
US markets are up 11% since August. On first glance that would suggest gold is being ignored…but it is not.
And so, we get to the thing. The ‘thing’ is that we just don’t know what’s going to happen with US stocks. And that question, combined with the support of negative real interest rates, has gold holding its ground despite the headwind of a risk-on market.
The risk-on market returned in September, after a summer when Google searches for recession ramped right up, stock suffered, and gold rain. So which is it? No one knows. Hard data has been mixed for years now – in the last week, for instance, we saw the manufacturing purchasing managers’ index in contraction territory but a strong employment report from the BLS – but these days all you need is some pervasive optimism to lift stocks 11%.
How is this going to play out for gold? I can’t know, but I can hypothesize.
First of all, the inverse relationship between gold and stocks is well developed. And you can see the same pattern comparing gold with copper, which is a proxy for growth and therefore trades right alongside stocks.
By extension, there’s a strong correlation between the copper-gold price ratio and the yield on the 10- year Treasury. Bond yields rise when investors are confident in the economy; they fall when sentiment turns down. Copper does the same; gold does the opposite. As such the copper-gold ratio and the 10-Year yield correlate closely
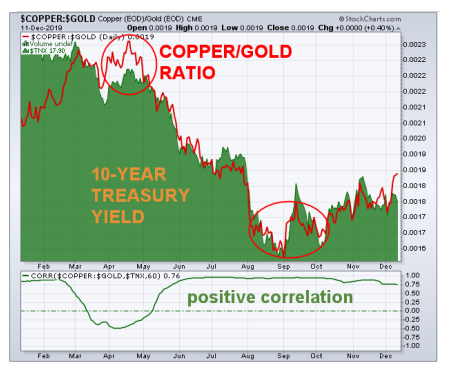
Thanks to John Murphy of StockCharts.com for the graphic.
Bond yields around the world fell in the spring and summer as recession fears took hold; the resulting inversion of the yield curve only reinforced those fears. That drove investors to safe havens and gold benefitted. Those trends reversed starting in September when investors turned more optimistic, the yield curve turned positive, and growth-based assets like copper caught a bid.
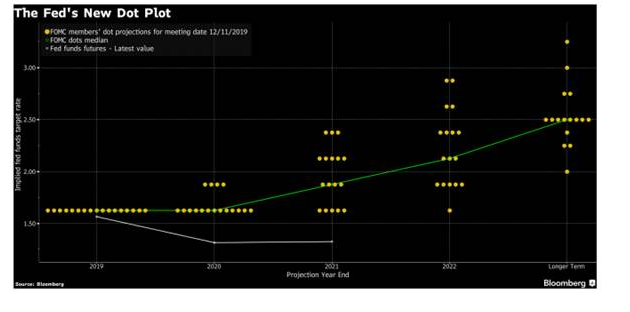
Today’s move by the Federal Reserve to hold interest rates steady continues the current narrative. The Fed had cut rates to support the economy when things looked weak; holding rates steady today reinforces their stance that the cuts worked and things are back on track.
Are they? I don’t know. As I said earlier, manufacturing is slumping (and manufacturing PMIs are a leading indictor). But job growth is strong and wages are rising faster than inflation.
The Fed is as uncertain about the economy as the rest of us. And while the central bank always works to support growth, the Fed will be especially careful to not upset the apple cart in an election year. Put those two forces together and you get today’s dot plot, which shows the Fed planning to do absolutely nothing with interest rates throughout 2020.
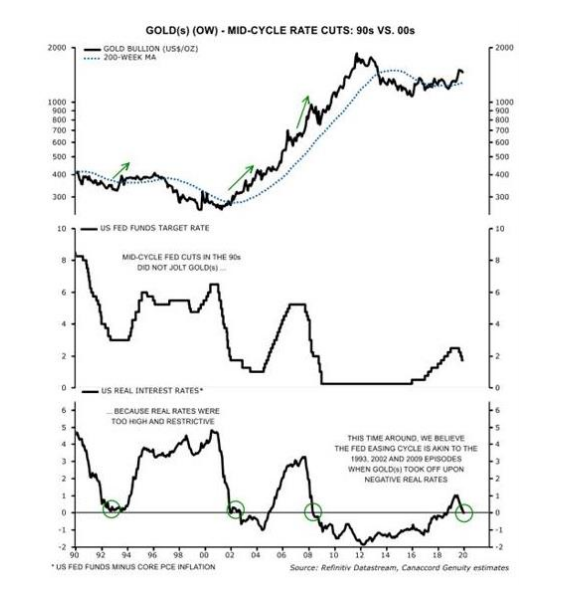
If interest rates stay unchanged, real rates will likely stay negative as inflation, already minimal, can’t really decline. That bodes well for gold, as Martin Roberge of Canaccord makes clear in the graphic below.
That’s the basics. From there, things get more complicated, but most possibilities fall into one of two categories.
I noted base metals here for two reasons. First, they perform very differently in the two situations. Second, there’s been lots of talk about copper in the last few weeks because of the price doing this:
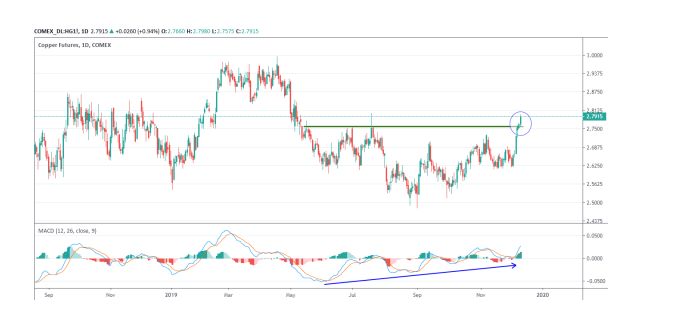
It’s not a dramatic move but copper did break up through resistance that’s held since the spring, despite a trade deal still lacking. I’ve been discussing why; the primary reason is that global visible inventories remain well below average and supply growth is low following miners’ drastic capex cuts from 2014 to 2017.
OK, so which of the two above paths will we head down? Again, I don’t know. I will point out that the Dow having gained 11% in 74 days, from August to November, raises the potential for a correction. In the last two years US stocks have etched out a two-steps-forward-one-step-back pattern that is distinctly different from the more consistent gains of the previous years.
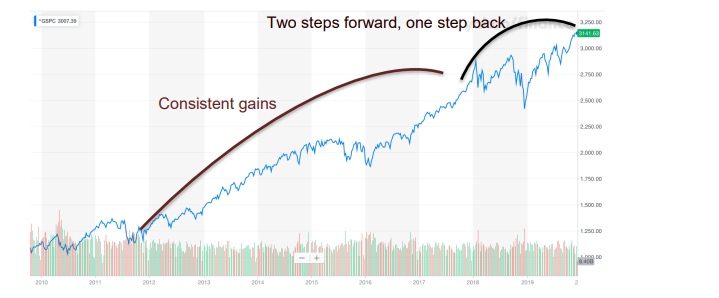
Two years ago markets ran sharply to end 2017 and then corrected, sharply, to start 2018. Nine months later another run corrected. During 2019 we had two corrections, both pulling markets down just when they’d gotten above previous highs.
This bull market is longer than usual and has been fueled in a most unusual way (through ultra low interest rates and active Fed support). As such we can’t use previous patterns to see the future. But I would say the current pattern has corrections as a regular part of the process and so I wouldn’t be surprised to see that repeat early in 2020.
Whether such a correction grows into something larger we shall have to wait and see. Traders aren’t just sitting in wait, though: investors are pouring cash into money market funds, with inflows at the third-highest level year to date since 1984.
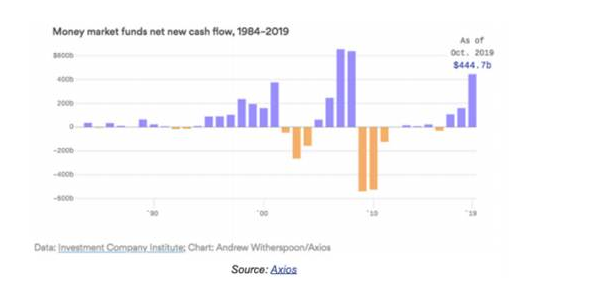
You can see from the chart that inflows into MMFs ramped higher ahead of the last two market crashes and recessions. Several major investment banks are reinforcing that notion; Goldman Sachs, for instance, said in a note that every one of its private equity clients is “bracing for the worst”.
As I outlined in the Two Scenarios above, gold would really perform in the case of a market decline. Steve Saville of the Speculative Investor captured the inverse correlation between gold and the SPX over the last two years nicely with this graphic.
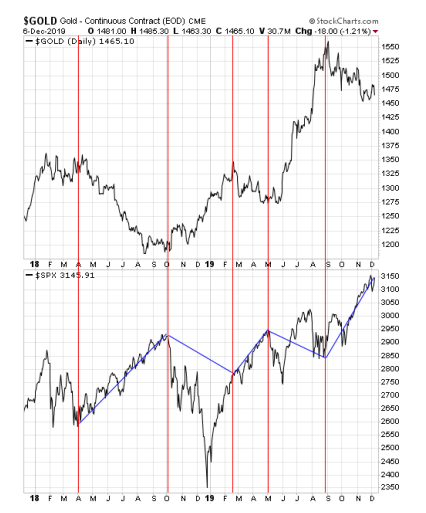
The yellow metal could also perform alongside a rising stock market, should the second, risk-on scenario play out. The fact that it would compete with other asset classes offering good gains means 7 the gold market in that setup wouldn’t be as strong as in the case of a correction, when gold shines bright against a bleak investment landscape.
Bottom line: negative real rates are here to stay for some time. That gives gold strong fundamental support, making it attractive as a safe haven and diversifier whether investors are anxious or not. That said, gold shines brightest when US stocks slide. I can’t know whether that’s coming, though there’s reason to believe a correction at least is in the cards in the near term.
If that correction coincides with gold’s reliable strong season, it will make for a fun few months to start the year…and could well lift the yellow metal enough that generalists can’t help but pay attention.
Significant copper and molybdenum intersections include: HM09: 13... READ MORE
Aya Gold & Silver Inc. (TSX: AYA) (OTCQX: AYASF) is pleased t... READ MORE
Key Highlights – Preliminary Economic Assessment Pre-Tax Net Pr... READ MORE
Aris Mining Corporation (TSX: ARIS) (NYSE-A: ARMN) announces its ... READ MORE
Orla Mining Ltd. (TSX: OLA) (NYSE: ORLA) announces the results fo... READ MORE


