Ero Copper Corp. (TSX: ERO) (NYSE: ERO) is pleased to announce its operating and financial results for the three and nine months ended September 30, 2022.
HIGHLIGHTS
*These are non-IFRS measures and do not have a standardized meaning prescribed by IFRS and might not be comparable to similar financial measures disclosed by other issuers. Please refer to the Company’s discussion of Non-IFRS measures in its Management’s Discussion and Analysis for the three and nine months ended September 30, 2022 and the Reconciliation of Non-IFRS Measures section at the end of this press release.
“Our operations delivered solid third quarter operating performance against a challenging macroeconomic backdrop that resulted in compressed operating margins during the period,” said David Strang, Chief Executive Officer. “While near-term global economic conditions remain dynamic, we are well-positioned with an experienced team, high-quality operations and a solid balance sheet to continue making progress on our strategic growth initiatives.
“At our Tucumã Project, road upgrades and site drainage are now complete ahead of the rainy season, and our mining contractor mobilized to site and commenced pre-stripping activities and waste rock dump construction during the quarter. All activities on site are advancing in- line with the Feasibility Study schedule. At our Caraíba Operations, shaft civil work, raise- boring and underground development related to our Pilar 3.0 initiative are progressing well, and an updated life-of-mine production plan reflecting the integration of Project Honeypot has also been finalized.
“Despite strong operating performance and successful project execution during the period, our operating costs remain higher than we had forecasted at the beginning of the year due to inflationary pressures and the higher allocation of copper sales to international customers that negate some of the tax benefits we receive when we sell to our domestic customer. As we look ahead to the fourth quarter, we expect to be in line with our revised full-year operating cost guidance but acknowledge we are tracking towards the higher end of the range as a result of these impacts.
“While, like our peers, we continue to navigate challenging near-term market conditions, we remain focused on advancing our growth strategy in anticipation of an unprecedented outlook for copper. The timing of our growth initiatives, now well underway at Tucumã and Caraíba, continues to align well with an expected surge in copper demand that is projected to far outpace supply in the years ahead.”
THIRD QUARTER REVIEW
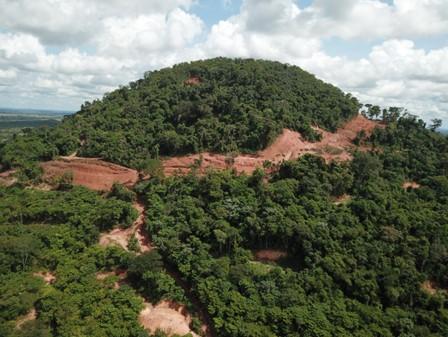
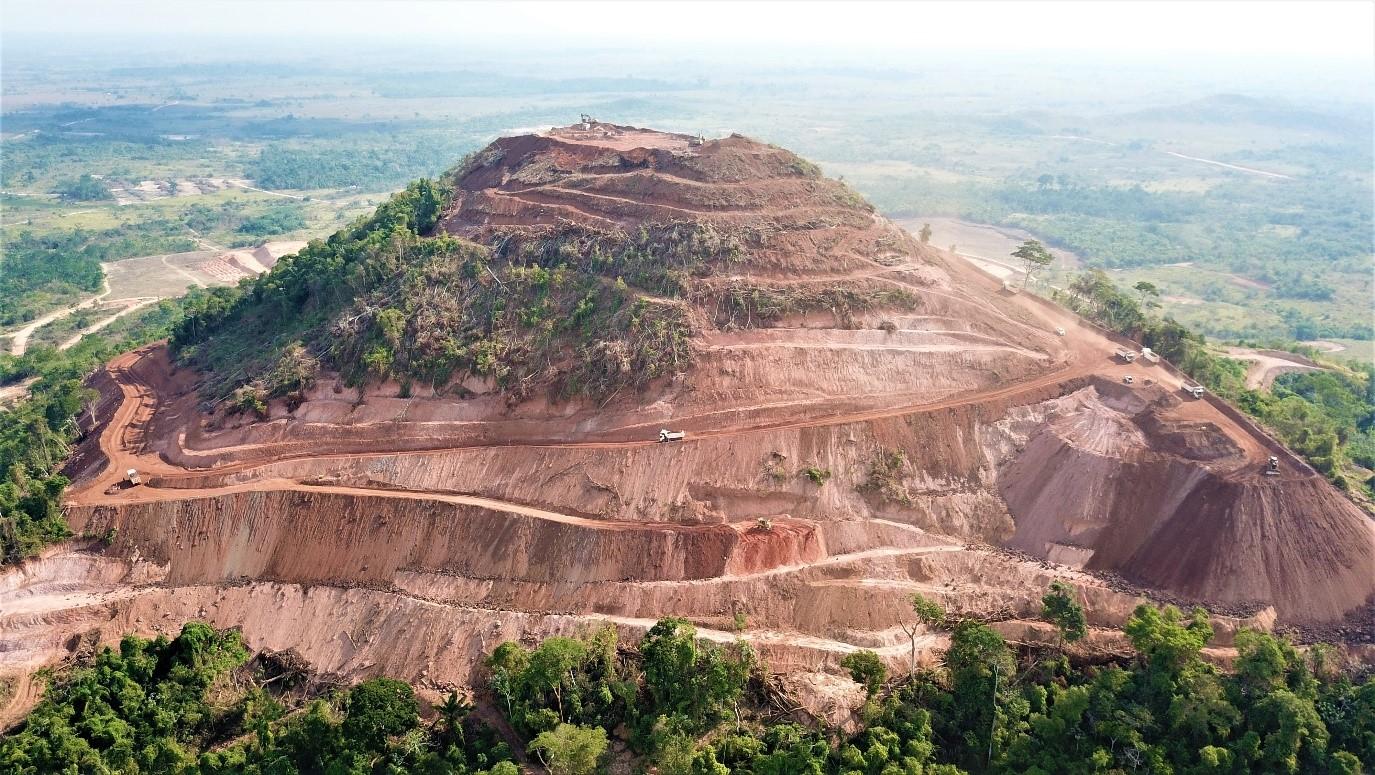
| Figure 1: Tucumã Project site in April 2022 (upper) and August 2022 (lower).
|
||
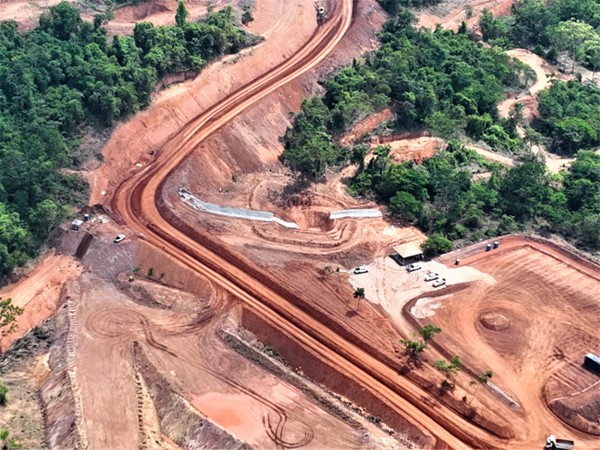
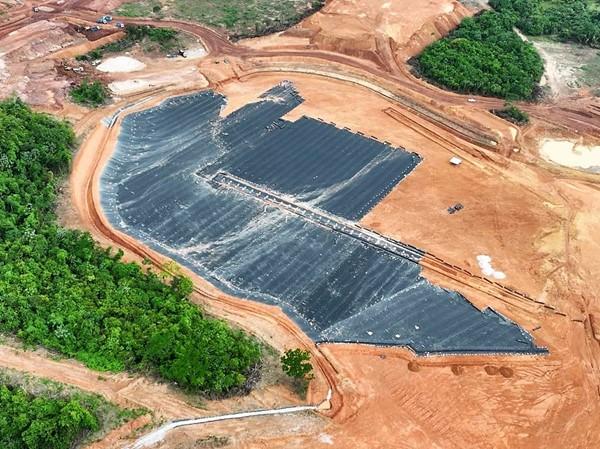
| Figure 2: Tucumã Project mine access road and completed drainage infrastructure (upper) and waste rock dump with installation of HDPE liner underway in October 2022 (lower).
|
||
OPERATING AND FINANCIAL HIGHLIGHTS
| 3 months ended Sep. 30, 2022 |
3 months ended June 30, 2022 |
3 months ended Sep. 30, 2021 |
9 months ended Sep. 30, 2022 |
9 months ended Sep. 30, 2021 |
|||||||||||||
| Operating Highlights | |||||||||||||||||
| Copper (Caraíba Operations) | |||||||||||||||||
| Ore Processed (tonnes) | 720,725 | 801,425 | 572,666 | 2,118,380 | 1,724,252 | ||||||||||||
| Grade (% Cu) | 1.68 | 1.74 | 1.90 | 1.73 | 2.11 | ||||||||||||
| Cu Production (tonnes) | 11,189 | 12,734 | 10,057 | 33,707 | 33,593 | ||||||||||||
| Cu Production (000 lbs) | 24,669 | 28,073 | 22,170 | 74,312 | 74,059 | ||||||||||||
| Cu Sold in Concentrate (tonnes) | 10,522 | 12,948 | 10,762 | 33,515 | 33,324 | ||||||||||||
| Cu Sold in Concentrate (000 lbs) | 23,197 | 28,546 | 23,727 | 73,888 | 73,468 | ||||||||||||
| C1 cash cost of Cu produced (per lb)(1) | $ | 1.46 | $ | 1.24 | $ | 0.94 | $ | 1.34 | $ | 0.70 | |||||||
| Gold (Xavantina Operations) | |||||||||||||||||
| Au Production (oz) | 10,965 | 11,122 | 9,426 | 30,883 | 29,254 | ||||||||||||
| C1 cash cost of Au Produced (per oz)(1) | $ | 537 | $ | 643 | $ | 538 | $ | 604 | $ | 508 | |||||||
| AISC of Au produced (per oz)(1) | $ | 1,135 | $ | 1,169 | $ | 741 | $ | 1,135 | $ | 681 | |||||||
|
Financial Highlights ($ in millions, except per share amounts) |
|||||||||||||||||
| Revenues | $ | 85.9 | $ | 114.9 | $ | 111.8 | $ | 309.7 | $ | 355.0 | |||||||
| Gross profit | 22.8 | 50.7 | 68.0 | 134.5 | 234.5 | ||||||||||||
| EBITDA(1) | 27.9 | 53.9 | 48.5 | 159.9 | 215.7 | ||||||||||||
| Adjusted EBITDA(1) | 32.1 | 55.8 | 72.9 | 150.3 | 245.1 | ||||||||||||
| Cash flow from operations | 43.0 | 22.4 | 150.7 | 109.4 | 297.9 | ||||||||||||
| Net income | 4.0 | 24.1 | 26.4 | 80.6 | 142.4 | ||||||||||||
| Net income attributable to owners of the Company | 3.7 | 23.8 | 26.1 | 79.7 | 141.2 | ||||||||||||
| Per share (basic) | 0.04 | 0.26 | 0.29 | 0.88 | 1.60 | ||||||||||||
| Per share (diluted) | 0.04 | 0.26 | 0.28 | 0.87 | 1.52 | ||||||||||||
| Adjusted net income attributable to owners of the Company(1) | 4.0 | 24.4 | 41.2 | 61.3 | 154.4 | ||||||||||||
| Per share (basic) | 0.04 | 0.27 | 0.47 | 0.68 | 1.75 | ||||||||||||
| Per share (diluted) | 0.04 | 0.27 | 0.44 | 0.67 | 1.66 | ||||||||||||
| Cash, cash equivalents, and short-term investments | 359.8 | 429.9 | 119.1 | 359.8 | 119.1 | ||||||||||||
| Working capital(1) | 343.2 | 417.7 | 81.4 | 343.2 | 81.4 | ||||||||||||
| Net (cash) debt(1) | 51.5 | (10.2 | ) | (63.7 | ) | 51.5 | (63.7 | ) | |||||||||
(1) EBITDA, Adjusted EBITDA, Adjusted net income (loss) attributable to owners of the Company, Adjusted net income (loss) per share attributable to owners of the Company, Net (Cash) Debt, Working Capital, C1 cash cost of copper produced (per lb), C1 cash cost of gold produced (per ounce) and AISC of gold produced (per ounce) are non-IFRS measures. These measures do not have a standardized meaning prescribed by IFRS and might not be comparable to similar financial measures disclosed by other issuers. Please refer to the Company’s discussion of Non-IFRS measures in its Management’s Discussion and Analysis for the three and nine months ended September 30, 2022 and the Reconciliation of Non-IFRS Measures section at the end of this press release.
2022 GUIDANCE(*)
The Company is reaffirming its full-year production guidance as well as its revised 2022 operating cost and capital expenditure guidance. At the Caraíba Operations, copper production in Q4 2022 is expected to be similar to Q3 2022 production levels. At the Xavantina Operations, the Company also expects to achieve similar Q4 2022 gold production levels relative to Q3 2022, resulting from higher anticipated gold grades and lower expected tonnes processed.
Due primarily to a higher allocation of concentrate sales to the international market and the continued influence of inflation on the cost of key consumables, C1 cash costs at the Caraíba Operations are trending towards the high-end of the guidance range of $1.20 to $1.35 per pound of copper produced. At the Xavantina Operations, costs are trending towards the low- end of the full-year C1 cash cost guidance range of $600 to $700 per ounce of gold produced and the high-end of the 2022 AISC range of $1,000 to $1,100 per ounce of gold produced.
2022 PRODUCTION AND COST GUIDANCE(*)
The Company’s cost guidance for 2022 assumes a USD:BRL foreign exchange rate of 5.30, a gold price of $1,725 per ounce and a silver price of $20.00 per ounce for Q4 2022.
| 2022 Guidance | |
| Caraíba Operations | |
| Copper Production (tonnes) | 43,000 – 46,000 |
| C1 Cash Cost Guidance (US$/lb)(1) | $1.20 – $1.35 |
| Xavantina Operations | |
| Gold Production (ounces) | 39,000 – 42,000 |
| C1 Cash Cost Guidance (US$/oz)(1) | $600 – $700 |
| All-in Sustaining Cost (AISC) Guidance (US$/oz)(1) | $1,000 – $1,100 |
(1) These are non-IFRS measures and do not have a standardized meaning prescribed by IFRS and might not be comparable to similar financial measures disclosed by other issuers. See the Reconciliation of Non-IFRS Measures section at the end of this press release for additional information.
2022 CAPITAL EXPENDITURE GUIDANCE(*)
The Company’s capital expenditure guidance for 2022 assumes a USD:BRL foreign exchange rate of 5.30 for Q4 2022 and has been presented below in USD millions.
| 2022 Guidance | |
| Caraíba Operations | |
| Growth | $95 – $110 |
| Sustaining | $85 – $95 |
| Exploration | $25 – $30 |
| Total, Caraíba Operations | $205 – $235 |
| Tucumã Project | |
| Growth | $70 – $80 |
| Exploration | $5 – $6 |
| Total, Tucumã Project | $75 – $86 |
| Xavantina Operations | |
| Growth | $2 – $4 |
| Sustaining | $16 – $18 |
| Exploration | $10 – $11 |
| Total, Xavantina Operations | $28 – $33 |
| Company Total | |
| Growth | $167 – $194 |
| Sustaining | $101 – $113 |
| Exploration | $40 – $47 |
| Total, Company | $308 – $354 |
| (*) Guidance is based on certain estimates and assumptions, including but not limited to, mineral reserve estimates, grade and continuity of interpreted geological formations and metallurgical performance. Please refer to the Company’s SEDAR and EDGAR filings, including the recent Annual Information Form for the year ended December 31, 2021 and dated March 11, 2022 (the “AIF”), for complete risk factors. |
Reconciliation of Non-IFRS Measures
Financial results of the Company are presented in accordance with IFRS. The Company utilizes certain alternative performance (non-IFRS) measures to monitor its performance, including C1 cash cost of copper produced (per lb), C1 cash cost of gold produced (per ounce), AISC of gold produced (per ounce), EBITDA, adjusted EBITDA, adjusted net income attributable to owners of the Company, adjusted net income per share, net (cash) debt, working capital and available liquidity. These performance measures have no standardized meaning prescribed within generally accepted accounting principles under IFRS and, therefore, amounts presented may not be comparable to similar measures presented by other mining companies. These non-IFRS measures are intended to provide supplemental information and should not be considered in isolation or as a substitute for measures of performance prepared in accordance with IFRS.
For additional details please refer to the Company’s discussion of non-IFRS and other performance measures in its Management’s Discussion and Analysis for the three and nine months ended September 30, 2022 which is available on SEDAR at www.sedar.com and on EDGAR at www.sec.gov.
C1 cash cost of copper produced (per lb.)
The following table provides a reconciliation of C1 cash cost of copper produced per pound to cost of production, its most directly comparable IFRS measure.
| Reconciliation: | 2022 – Q3 | 2022 – Q2 | 2021 – Q3 | 2022 – YTD | 2021 – YTD | |||||||||||
| Cost of production | $ | 39,047 | $ | 38,015 | $ | 24,693 | $ | 106,225 | $ | 66,959 | ||||||
| Add (less): | ||||||||||||||||
| Transportation costs & other | 2,209 | 2,579 | 1,842 | 6,657 | 4,333 | |||||||||||
| Treatment, refining, and other | 4,198 | 3,893 | 277 | 10,137 | 1,448 | |||||||||||
| By-product credits | (4,929 | ) | (6,438 | ) | (5,011 | ) | (16,179 | ) | (16,733 | ) | ||||||
| Incentive payments | (902 | ) | (1,016 | ) | (663 | ) | (2,822 | ) | (2,045 | ) | ||||||
| Net change in inventory | (3,849 | ) | (1,907 | ) | (384 | ) | (5,179 | ) | (2,351 | ) | ||||||
| Foreign exchange translation and other | 212 | (178 | ) | (3 | ) | 420 | 196 | |||||||||
| C1 cash costs | $ | 35,986 | $ | 34,948 | $ | 20,751 | $ | 99,259 | $ | 51,807 | ||||||
|
|
||||||||||||||||
| Mining | $ | 23,594 | $ | 23,933 | $ | 15,706 | $ | 67,653 | $ | 41,307 | ||||||
| Processing | 7,687 | 7,988 | 5,282 | 22,122 | 15,220 | |||||||||||
| Indirect | 5,436 | 5,572 | 4,497 | 15,526 | 10,565 | |||||||||||
| Production costs | 36,717 | 37,493 | 25,485 | 105,301 | 67,092 | |||||||||||
| By-product credits | (4,929 | ) | (6,438 | ) | (5,011 | ) | (16,179 | ) | (16,733 | ) | ||||||
| Treatment, refining and other | 4,198 | 3,893 | 277 | 10,137 | 1,448 | |||||||||||
| C1 cash costs | $ | 35,986 | $ | 34,948 | $ | 20,751 | $ | 99,259 | $ | 51,807 | ||||||
|
|
||||||||||||||||
| Payable copper produced (lb, 000) | 24,669 | 28,073 | 22,170 | 74,312 | 74,059 | |||||||||||
| Mining | $ | 0.96 | $ | 0.85 | $ | 0.71 | $ | 0.91 | $ | 0.56 | ||||||
| Processing | $ | 0.31 | $ | 0.28 | $ | 0.24 | $ | 0.30 | $ | 0.21 | ||||||
| Indirect | $ | 0.22 | $ | 0.20 | $ | 0.20 | $ | 0.21 | $ | 0.14 | ||||||
| By-product credits | $ | (0.20 | ) | $ | (0.23 | ) | $ | (0.23 | ) | $ | (0.22 | ) | $ | (0.23 | ) | |
| Treatment, refining and other | $ | 0.17 | $ | 0.14 | $ | 0.02 | $ | 0.14 | $ | 0.02 | ||||||
| C1 cash costs of copper produced (per lb) | $ | 1.46 | $ | 1.24 | $ | 0.94 | $ | 1.34 | $ | 0.70 | ||||||
C1 cash cost of gold produced and All-in Sustaining Cost of gold produced (per ounce)
The following table provides a reconciliation of C1 cash cost of gold produced per ounce and AISC of gold produced per ounce to cost of production, its most directly comparable IFRS measure.
| Reconciliation: | 2022 – Q3 | 2022 – Q2 | 2021 – Q3 | 2022 – YTD | 2021 – YTD | ||||||||||
| Cost of production | $ | 7,317 | $ | 7,225 | $ | 4,936 | $ | 19,934 | $ | 15,100 | |||||
| Add (less): | |||||||||||||||
| Incentive payments | (177 | ) | (188 | ) | (145 | ) | (950 | ) | (638 | ) | |||||
| Net change in inventory | (1,031 | ) | (73 | ) | (176 | ) | (377 | ) | (11 | ) | |||||
| By-product credits | (145 | ) | (145 | ) | (153 | ) | (414 | ) | (458 | ) | |||||
| Foreign exchange translation and other | (80 | ) | 327 | 608 | 453 | 865 | |||||||||
| C1 cash costs | $ | 5,884 | $ | 7,146 | $ | 5,070 | $ | 18,646 | $ | 14,858 | |||||
| Site general and administrative | 1,011 | 882 | 601 | 2,452 | 1,277 | ||||||||||
| Accretion of mine closure and rehabilitation provision | 106 | 112 | 285 | 330 | 173 | ||||||||||
| Sustaining capital expenditure | 4,105 | 3,690 | 552 | 10,091 | 1,564 | ||||||||||
| Sustaining leases | 1,036 | 894 | 216 | 2,752 | 1,243 | ||||||||||
| Royalties and production taxes | 298 | 277 | 261 | 779 | 801 | ||||||||||
| AISC | $ | 12,440 | $ | 13,001 | $ | 6,985 | $ | 35,050 | $ | 19,916 | |||||
| 2022 – Q3 | 2022 – Q2 | 2021 – Q3 | 2022 – YTD | 2021 – YTD | |||||||||||
| Costs | |||||||||||||||
| Mining | $ | 3,071 | $ | 3,929 | $ | 2,247 | $ | 10,218 | $ | 6,991 | |||||
| Processing | 1,867 | 2,285 | 2,005 | 5,850 | 5,622 | ||||||||||
| Indirect | 1,091 | 1,077 | 971 | 2,992 | 2,703 | ||||||||||
| Production costs | 6,029 | 7,291 | 5,223 | 19,060 | 15,316 | ||||||||||
| By-product credits | (145 | ) | (145 | ) | (153 | ) | (414 | ) | (458 | ) | |||||
| C1 cash costs | $ | 5,884 | $ | 7,146 | $ | 5,070 | $ | 18,646 | $ | 14,858 | |||||
| Site general and administrative | 1,011 | 882 | 601 | 2,452 | 1,277 | ||||||||||
| Accretion of mine closure and rehabilitation provision | 106 | 112 | 285 | 330 | 173 | ||||||||||
| Sustaining capital expenditure | 4,105 | 3,690 | 552 | 10,091 | 1,564 | ||||||||||
| Sustaining leases | 1,036 | 894 | 216 | 2,752 | 1,243 | ||||||||||
| Royalties and production taxes | 298 | 277 | 261 | 779 | 801 | ||||||||||
| AISC | $ | 12,440 | $ | 13,001 | $ | 6,985 | $ | 35,050 | $ | 19,916 | |||||
| Costs per ounce | |||||||||||||||
| Payable gold produced (ounces) | 10,965 | 11,122 | 9,426 | 30,883 | 29,254 | ||||||||||
| Mining | $ | 280 | $ | 353 | $ | 238 | $ | 331 | $ | 239 | |||||
| Processing | $ | 170 | $ | 205 | $ | 213 | $ | 189 | $ | 192 | |||||
| Indirect | $ | 99 | $ | 97 | $ | 103 | $ | 97 | $ | 92 | |||||
| By-product credits | $ | (12 | ) | $ | (12 | ) | $ | (16 | ) | $ | (13 | ) | $ | (15 | ) |
| C1 cash costs of gold produced (per ounce) | $ | 537 | $ | 643 | $ | 538 | $ | 604 | $ | 508 | |||||
| AISC of gold produced (per ounce) | $ | 1,135 | $ | 1,169 | $ | 741 | $ | 1,135 | $ | 681 | |||||
Earnings before interest, taxes, depreciation and amortization (EBITDA) and Adjusted EBITDA
The following table provides a reconciliation of EBITDA and Adjusted EBITDA to net income, its most directly comparable IFRS measure.
| Reconciliation: | 2022 – Q3 | 2022 – Q2 | 2021 – Q3 | 2022 – YTD | 2021 – YTD | |||||||
| Net Income | $ | 3,999 | $ | 24,110 | $ | 26,384 | $ | 80,595 | $ | 142,420 | ||
| Adjustments: | ||||||||||||
| Finance expense | 7,283 | 8,154 | 3,787 | 20,933 | 9,863 | |||||||
| Income tax expense | 1,887 | 5,283 | 6,069 | 15,776 | 29,760 | |||||||
| Amortization and depreciation | 14,743 | 16,360 | 12,233 | 42,608 | 33,615 | |||||||
| EBITDA | $ | 27,912 | $ | 53,907 | $ | 48,473 | $ | 159,912 | $ | 215,658 | ||
| Foreign exchange loss (gain) | 65 | 3,303 | 19,642 | (15,341 | ) | 17,549 | ||||||
| Share based compensation | 4,151 | (2,333 | ) | 2,041 | 3,808 | 6,867 | ||||||
| Incremental COVID-19 costs | — | 952 | 1,485 | 1,956 | 3,790 | |||||||
| NX Gold stream transaction fees | — | — | 1,219 | — | 1,219 | |||||||
| Adjusted EBITDA | $ | 32,128 | $ | 55,829 | $ | 72,860 | $ | 150,335 | $ | 245,083 | ||
Adjusted net income attributable to owners of the Company and Adjusted net income per share attributable to owners of the Company
The following table provides a reconciliation of Adjusted net income attributable to owners of the Company and Adjusted EPS to net income attributable to the owners of the Company, its most directly comparable IFRS measure.
| Reconciliation: | 2022 – Q3 | 2022 – Q2 | 2021 – Q3 | 2022 – YTD | 2021 – YTD | ||||||||||||||
| Net income as reported attributable to the owners of the Company | $ | 3,745 | $ | 23,820 | $ | 26,081 | $ | 79,672 | $ | 141,249 | |||||||||
| Adjustments: | |||||||||||||||||||
| Share based compensation | 4,151 | (2,333 | ) | 2,041 | 3,808 | 6,867 | |||||||||||||
| Unrealized foreign exchange loss on USD denominated balances in MCSA | 2,106 | 1,038 | 4,618 | 1,807 | 3,706 | ||||||||||||||
| Unrealized foreign exchange (gain) loss on foreign exchange derivative contracts | (6,733 | ) | 1,405 | 10,417 | (29,943 | ) | (637 | ) | |||||||||||
| Incremental COVID-19 costs | — | 946 | 1,479 | 1,944 | 3,770 | ||||||||||||||
| NX Gold stream transaction fees | — | — | 1,219 | — | 1,219 | ||||||||||||||
| Unrealized gain on interest rate derivative contracts | — | — | (147 | ) | — | (556 | ) | ||||||||||||
| Tax effect on the above adjustments | 706 | (519 | ) | (4,511 | ) | 3,995 | (1,222 | ) | |||||||||||
| Adjusted net income attributable to owners of the Company | $ | 3,975 | $ | 24,357 | $ | 41,197 | $ | 61,283 | $ | 154,396 | |||||||||
| Weighted average number of common shares | |||||||||||||||||||
| Basic | 90,845,229 | 90,539,647 | 88,449,567 | 90,543,185 | 88,256,703 | ||||||||||||||
| Diluted | 91,797,437 | 91,850,321 | 93,255,615 | 91,950,181 | 93,217,714 | ||||||||||||||
| Adjusted EPS | |||||||||||||||||||
| Basic | $ | 0.04 | $ | 0.27 | $ | 0.47 | $ | 0.68 | $ | 1.75 | |||||||||
| Diluted | $ | 0.04 | $ | 0.27 | $ | 0.44 | $ | 0.67 | $ | 1.66 | |||||||||
Net (Cash) Debt
The following table provides a calculation of net (cash) debt based on amounts presented in the Company’s condensed consolidated interim financial statements as at the periods presented.
| September 30, 2022 | June 30, 2022 | December 31, 2021 | September 30, 2021 | |||||||||
| Current portion of loans and borrowings | $ | 9,049 | $ | 16,219 | $ | 4,344 | $ | 3,713 | ||||
| Long-term portion of loans and borrowings | 402,275 | 403,492 | 54,906 | 51,667 | ||||||||
| Less: | ||||||||||||
| Cash and cash equivalents | (210,244 | ) | (329,292 | ) | (130,129 | ) | (92,646 | ) | ||||
| Short-term investments | (149,554 | ) | (100,589 | ) | — | (26,408 | ) | |||||
| Net (cash) debt | $ | 51,526 | $ | (10,170 | ) | $ | (70,879 | ) | $ | (63,674 | ) | |
Working capital and Available liquidity
The following table provides a calculation for these based on amounts presented in the Company’s condensed consolidated interim financial statements as at the periods presented.
| September 30, 2022 | June 30, 2022 | December 31, 2021 | September 30, 2021 | |||||||||
| Current assets | $ | 444,188 | $ | 523,201 | $ | 208,686 | $ | 187,042 | ||||
| Less: Current liabilities | (100,943 | ) | (105,527 | ) | (122,660 | ) | (105,683 | ) | ||||
| Working capital | $ | 343,245 | $ | 417,674 | $ | 86,026 | $ | 81,359 | ||||
| Cash and cash equivalents | 210,244 | 329,292 | 130,129 | 92,646 | ||||||||
| Short-term investments | 149,554 | 100,589 | — | 26,408 | ||||||||
| Available undrawn revolving credit | ||||||||||||
| facilities | 75,000 | 75,000 | 100,000 | 100,000 | ||||||||
| Available liquidity | $ | 434,798 | $ | 504,881 | $ | 230,129 | $ | 219,054 | ||||
ABOUT ERO COPPER CORP
Ero is a high-margin, high-growth, clean copper producer with operations in Brazil and corporate headquarters in Vancouver, B.C. The Company’s primary asset is a 99.6% interest in the Brazilian copper mining company, Mineração Caraíba S.A. 100% owner of the Company’s Caraíba Operations (formerly known as the MCSA Mining Complex), which are located in the Curaçá Valley, Bahia State, Brazil and include the Pilar and Vermelhos underground mines and the Surubim open pit mine, and the Tucumã Project (formerly known as Boa Esperança), an IOCG-type copper project located in Pará, Brazil. The Company also owns 97.6% of NX Gold S.A. which owns the Xavantina Operations (formerly known as the NX Gold Mine), comprised of an operating gold and silver mine located in Mato Grosso, Brazil.
Newmont Corporation (NYSE: NEM) (ASX: NEM) (PNGX: NEM) issued the... READ MORE
Northern Discovery Metals Inc. is pleased to announce that... READ MORE
Pacific Ridge Exploration Ltd. (TSX-V: PEX) (OTCQB: PEXZF) (FSE: ... READ MORE
Completes Geochemical Survey at Nessa Properties in Domeyko Fault... READ MORE
Copper Fox Metals Inc. (TSX-V: CUU) (OTCQX: CPFXF) (FSE: HPU) i... READ MORE