


Ero Copper Corp. (TSX: ERO) (NYSE: ERO) is pleased to announce its operating and financial results for the three months ended March 31, 2023. Management will host a conference call tomorrow, Tuesday, May 9, 2023, at 11:30 a.m. eastern time to discuss the results. Dial-in details for the call can be found near the end of this press release.
HIGHLIGHTS
*These are non-IFRS measures and do not have a standardized meaning prescribed by IFRS and might not be comparable to similar financial measures disclosed by other issuers. Please refer to the Company’s discussion of Non-IFRS measures in its Management’s Discussion and Analysis for the three months ended March 31, 2023 and the Reconciliation of Non-IFRS Measures section at the end of this press release.
“Our solid operating performance in the first quarter was bolstered by a favorable metal price environment reflective of the accelerating decarbonization movement,” said David Strang, Chief Executive Officer. “During the quarter, we also made strong progress on our key growth projects with the Tucumã Project and the Pilar Mine’s new external shaft reaching approximately 30% and 20% physical completion, respectively, as of quarter-end.
“Looking ahead to the remainder of the year, we anticipate increased production levels driven by planned mine sequencing and the completion of additional growth projects at our operations. We expect commencement of mining from the Matinha vein to result in higher gold production at our Xavantina Operations in the second half of the year. At the Caraíba Operations, ramp up and commissioning of the new ball mill during the fourth quarter is expected to drive higher mill throughput levels and copper production over the same period.
“We are proud to say that with each quarter, the ongoing execution of our peer-leading organic growth strategy is bringing our Company closer to doubling copper production to over 100,000 tonnes in 2025, and achieving higher sustained gold production levels of 55,000 to 60,000 ounces per year beginning in 2024. As the outlook for both metals continues to strengthen, the timing of our growth trajectory couldn’t be better.”
FIRST QUARTER REVIEW
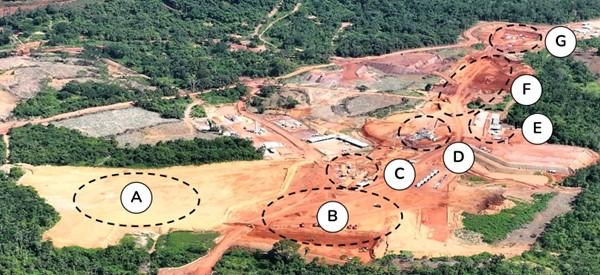
Figure 1: April 2023 aerial view of the Tucumã Project, including (A) administrative offices, laboratories, fuel station, and equipment maintenance area, (B) flotation and filtration, (C) ball mill, (D) crushed ore stockpile, (E) main substation, (F) secondary and tertiary crushers, and (G) primary crusher.
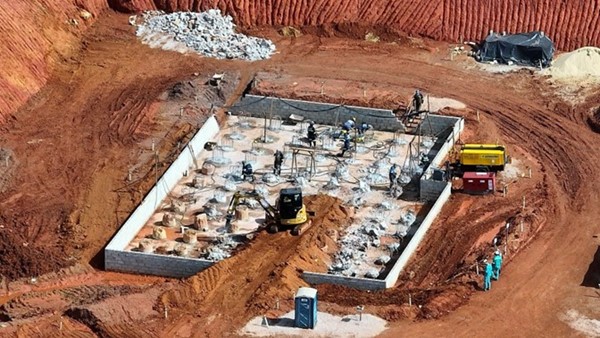
Figure 2: Civil works underway at the Tucumã Project’s primary crushing area (April 2023).
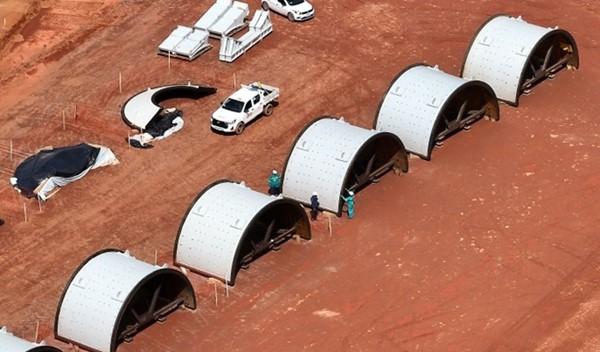
Figure 3: Ball mill components upon arrival at the Tucumã Project (April 2023).
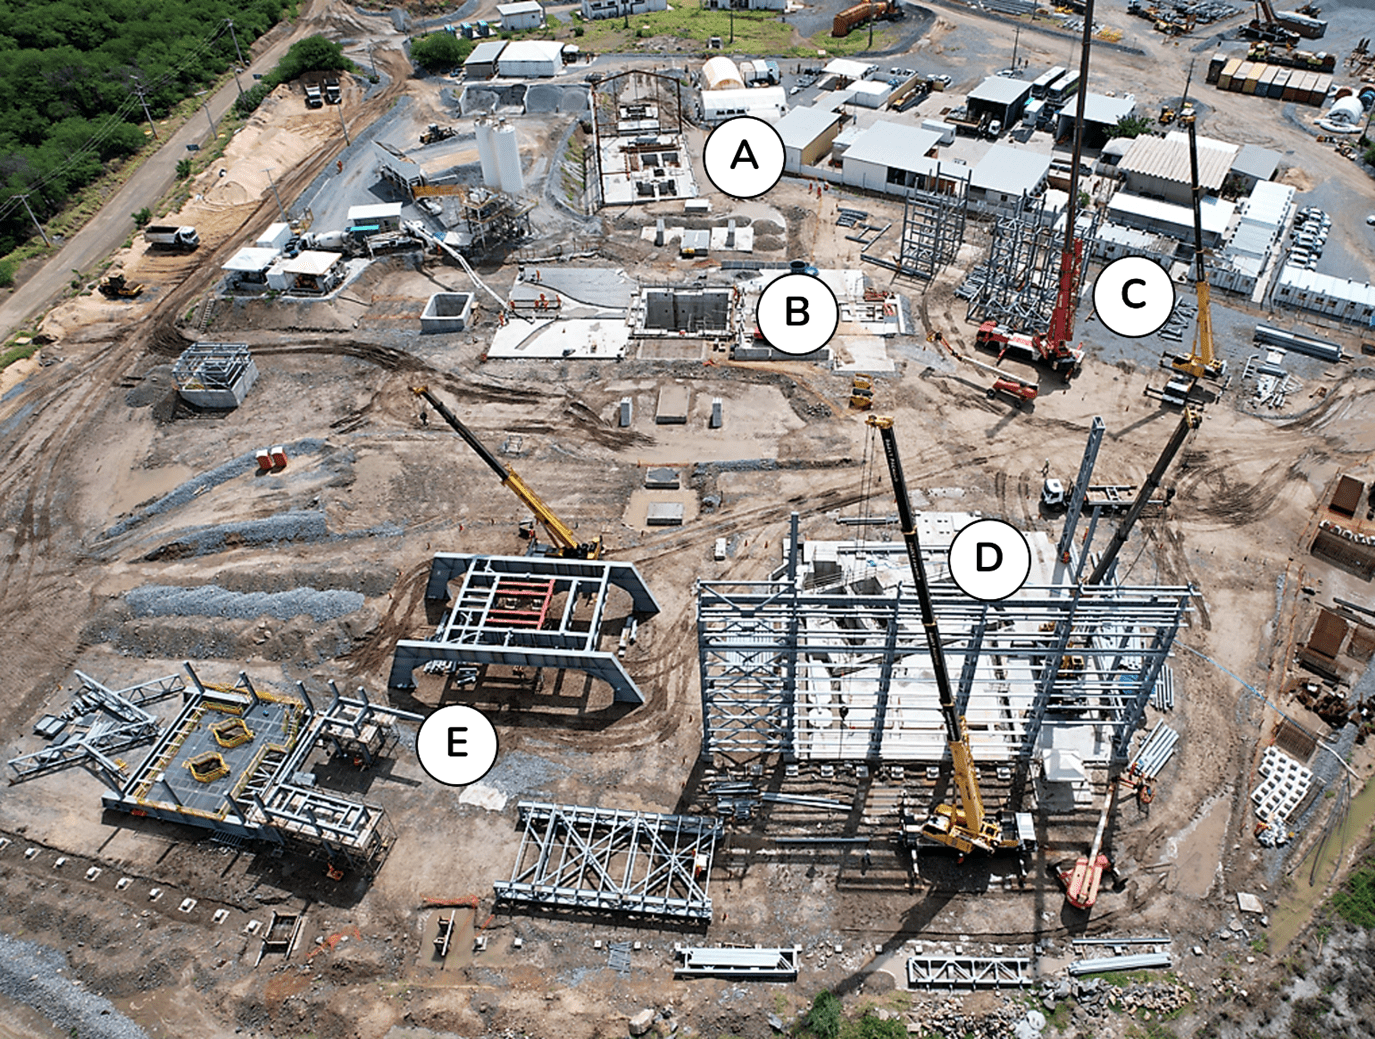
Figure 4: Surface infrastructure as of April 2023 at the Caraíba Operations’ new external shaft, including (A) the stage winder foundation, (B) shaft collar, (C) center tower steel erection, (D) foundation and exterior steel frame for the permanent rock and personnel winders, and (E) headgear steel erection.
Management Changes
Anthea Bath has ceased as Chief Operating Officer by mutual agreement with the Company. The Company would like to take this opportunity to express its gratitude for Ms. Bath’s contributions over the past five years. Her dedication and hard work have been greatly appreciated, and the executive team wishes her all the best in her future endeavors.
The Board has appointed Makko DeFilippo as President and Chief Operating Officer of the Company. Mr. DeFilippo, who has been with the Company since 2017, has served as President of the Company since January 2021 and prior to that as Vice President, Corporate Development.
OPERATING AND FINANCIAL HIGHLIGHTS
| 3 months ended Mar. 31, 2023 |
3 months ended Dec. 31, 2022 |
3 months ended Mar. 31, 2022 |
||||||||
| Operating Highlights | ||||||||||
| Copper (Caraíba Operations) | ||||||||||
| Ore Processed (tonnes) | 772,548 | 745,850 | 596,230 | |||||||
| Grade (% Cu) | 1.33 | 1.84 | 1.78 | |||||||
| Cu Production (tonnes) | 9,327 | 12,664 | 9,784 | |||||||
| Cu Production (000 lbs) | 20,564 | 27,918 | 21,570 | |||||||
| Cu Sold in Concentrate (tonnes) | 9,464 | 13,301 | 10,045 | |||||||
| Cu Sold in Concentrate (000 lbs) | 20,865 | 29,323 | 22,145 | |||||||
| C1 cash cost of Cu produced (per lb)(1) | $ | 1.70 | $ | 1.41 | $ | 1.31 | ||||
| Gold (Xavantina Operations) | ||||||||||
| Ore Processed (tonnes) | 35,763 | 39,715 | 49,990 | |||||||
| Au Production (oz) | 12,443 | 11,786 | 8,796 | |||||||
| C1 cash cost of Au Produced (per oz)(1) | $ | 436 | $ | 445 | $ | 638 | ||||
| AISC of Au produced (per oz)(1) | $ | 946 | $ | 1,096 | $ | 1,092 | ||||
| Financial Highlights ($ in millions, except per share amounts) | ||||||||||
| Revenues | $ | 101.0 | $ | 116.7 | $ | 108.9 | ||||
| Gross profit | 40.1 | 52.7 | 61.0 | |||||||
| EBITDA(1) | 51.8 | 58.7 | 78.1 | |||||||
| Adjusted EBITDA(1) | 48.2 | 58.2 | 62.4 | |||||||
| Cash flow from operations | 16.4 | 34.0 | 44.0 | |||||||
| Net income | 24.5 | 22.5 | 52.5 | |||||||
| Net income attributable to owners of the Company | 24.2 | 22.2 | 52.1 | |||||||
| Per share (basic) | 0.26 | 0.24 | 0.58 | |||||||
| Per share (diluted) | 0.26 | 0.24 | 0.57 | |||||||
| Adjusted net income attributable to owners of the Company(1) | 22.5 | 22.2 | 33.0 | |||||||
| Per share (basic) | 0.24 | 0.24 | 0.37 | |||||||
| Per share (diluted) | 0.24 | 0.24 | 0.36 | |||||||
| Cash, cash equivalents, and short-term investments | 236.6 | 317.4 | 465.5 | |||||||
| Working capital(1) | 218.8 | 263.3 | 443.7 | |||||||
| Net (cash) debt(1) | 174.2 | 100.7 | (54.4 | ) | ||||||
(1) EBITDA, Adjusted EBITDA, Adjusted net income (loss) attributable to owners of the Company, Adjusted net income (loss) per share attributable to owners of the Company, Net (Cash) Debt, Working Capital, C1 cash cost of copper produced (per lb), C1 cash cost of gold produced (per ounce) and AISC of gold produced (per ounce) are non-IFRS measures. These measures do not have a standardized meaning prescribed by IFRS and might not be comparable to similar financial measures disclosed by other issuers. Please refer to the Company’s discussion of Non-IFRS measures in its Management’s Discussion and Analysis for the three months ended March 31, 2023 and the Reconciliation of Non-IFRS Measures section at the end of this press release.
2023 PRODUCTION AND COST GUIDANCE(*)
The Caraíba Operations are expected to produce 44,000 to 47,000 tonnes of copper in concentrate in 2023 with Q1 2023 expected to be the lowest production quarter of the year, as previously noted. Production from the Caraíba Operations is expected to be slightly weighted towards H2 2023 due to higher anticipated mill throughput volumes during ramp up and commissioning of the new ball mill installation in Q4 2023. Higher mined and processed copper grades are also expected through the remainder of the year based on planned stope sequencing.
C1 cash costs at the Caraíba Operations are expected to be between $1.40 and $1.60 per pound of copper produced in 2023 with higher anticipated copper grades and production expected to result in lower unit operating costs in the remaining quarters of the year. While the Company has resumed shipments to its domestic smelter on a limited and prepaid basis, the associated reduction in concentrate sales costs has been offset to date by a stronger BRL to U.S. dollar exchange rate.
At the Xavantina Operations, the Company is reaffirming its 2023 gold production guidance range of 50,000 to 53,000 ounces with slightly higher gold production expected in H2 2023 due to increased mill throughput volumes following the expected commencement of production from the Matinha vein.
The Company is also reaffirming its full-year cost guidance for the Xavantina Operations with C1 cash costs expected to be between $475 and $575 per ounce of gold produced and AISC expected to be $725 to $825 per ounce of gold produced.
The Company’s cost guidance for 2023 assumes a USD:BRL foreign exchange rate of 5.30, a gold price of $1,725 per ounce and a silver price of $20.00 per ounce.
| 2023 Guidance | ||
| Caraíba Operations | ||
| Copper Production (tonnes) | 44,000 – 47,000 | |
| C1 Cash Cost (US$/lb)(1) | $1.40 – $1.60 | |
| Xavantina Operations | ||
| Gold Production (ounces) | 50,000 – 53,000 | |
| C1 Cash Cost (US$/oz)(1) | $475 – $575 | |
| All-in Sustaining Cost (AISC) (US$/oz)(1) | $725 – $825 |
(1) These are non-IFRS measures and do not have a standardized meaning prescribed by IFRS and might not be comparable to similar financial measures disclosed by other issuers. See the Reconciliation of Non-IFRS Measures section at the end of this press release for additional information.
2023 CAPITAL EXPENDITURE GUIDANCE(*)
The Company’s capital expenditure guidance for 2023 assumes a USD:BRL foreign exchange rate of 5.30 and has been presented below in USD millions.
| 2023 Guidance | ||
| Caraíba Operations | ||
| Growth | $80 – $90 | |
| Sustaining | $65 – $75 | |
| Exploration | $22 – $27 | |
| Total, Caraíba Operations | $167 – $192 | |
| Tucumã Project | ||
| Growth | $150 – $165 | |
| Exploration | $0 – $1 | |
| Total, Tucumã Project | $150 – $166 | |
| Xavantina Operations | ||
| Growth | $4 – $5 | |
| Sustaining | $12 – $14 | |
| Exploration | $6 – $7 | |
| Total, Xavantina Operations | $22 – $26 | |
| Company Total | ||
| Growth | $234 – $260 | |
| Sustaining | $77 – $89 | |
| Exploration | $31 – $40 | |
| Total, Company | $342 – $389 |
(*) Guidance is based on certain estimates and assumptions, including but not limited to, mineral reserve estimates, grade and continuity of interpreted geological formations and metallurgical performance. Please refer to the Company’s SEDAR and EDGAR filings, including the recent Annual Information Form for the year ended December 31, 2022 and dated March 7, 2023 (the “AIF”), for complete risk factors.
Reconciliation of Non-IFRS Measures
Financial results of the Company are presented in accordance with IFRS. The Company utilizes certain alternative performance (non-IFRS) measures to monitor its performance, including C1 cash cost of copper produced (per lb), C1 cash cost of gold produced (per ounce), AISC of gold produced (per ounce), EBITDA, adjusted EBITDA, adjusted net income attributable to owners of the Company, adjusted net income per share, net (cash) debt, working capital and available liquidity. These performance measures have no standardized meaning prescribed within generally accepted accounting principles under IFRS and, therefore, amounts presented may not be comparable to similar measures presented by other mining companies. These non-IFRS measures are intended to provide supplemental information and should not be considered in isolation or as a substitute for measures of performance prepared in accordance with IFRS.
For additional details please refer to the Company’s discussion of non-IFRS and other performance measures in its Management’s Discussion and Analysis for the three months ended March 31, 2023 which is available on SEDAR at www.sedar.com and on EDGAR at www.sec.gov.
C1 cash cost of copper produced (per lb)
The following table provides a reconciliation of C1 cash cost of copper produced per pound to cost of production, its most directly comparable IFRS measure.
| Reconciliation: | 2023 – Q1 | 2022 – Q4 | 2022 – Q1 | |||||||||
| Cost of production | $ | 36,285 | $ | 40,067 | $ | 29,163 | ||||||
| Add (less): | ||||||||||||
| Transportation costs & other | 1,339 | 2,362 | 1,869 | |||||||||
| Treatment, refining, and other | 2,527 | 4,949 | 2,046 | |||||||||
| By-product credits | (2,810 | ) | (6,103 | ) | (4,812 | ) | ||||||
| Incentive payments | (1,237 | ) | (1,092 | ) | (904 | ) | ||||||
| Net change in inventory | (1,185 | ) | (861 | ) | 577 | |||||||
| Foreign exchange translation and other | 15 | (47 | ) | 386 | ||||||||
| C1 cash costs | $ | 34,934 | $ | 39,275 | $ | 28,325 | ||||||
| Mining | $ | 23,210 | $ | 26,433 | $ | 20,126 | ||||||
| Processing | 6,554 | 8,033 | 6,447 | |||||||||
| Indirect | 5,453 | 5,963 | 4,518 | |||||||||
| Production costs | 35,217 | 40,429 | 31,091 | |||||||||
| By-product credits | (2,810 | ) | (6,103 | ) | (4,812 | ) | ||||||
| Treatment, refining and other | 2,527 | 4,949 | 2,046 | |||||||||
| C1 cash costs | $ | 34,934 | $ | 39,275 | $ | 28,325 | ||||||
| Payable copper produced (lb, 000) | 20,564 | 27,918 | 21,570 | |||||||||
| Mining | $ | 1.13 | $ | 0.95 | $ | 0.93 | ||||||
| Processing | $ | 0.32 | $ | 0.29 | $ | 0.30 | ||||||
| Indirect | $ | 0.27 | $ | 0.21 | $ | 0.21 | ||||||
| By-product credits | $ | (0.14 | ) | $ | (0.22 | ) | $ | (0.22 | ) | |||
| Treatment, refining and other | $ | 0.12 | $ | 0.18 | $ | 0.09 | ||||||
| C1 cash costs of copper produced (per lb) | $ | 1.70 | $ | 1.41 | $ | 1.31 | ||||||
C1 cash cost of gold produced and All-in Sustaining Cost of gold produced (per ounce)
The following table provides a reconciliation of C1 cash cost of gold produced per ounce and AISC of gold produced per ounce to cost of production, its most directly comparable IFRS measure.
| Reconciliation: | 2023 – Q1 | 2022 – Q4 | 2022 – Q1 | |||||||||
| Cost of production | $ | 6,107 | $ | 4,834 | $ | 5,392 | ||||||
| Add (less): | ||||||||||||
| Incentive payments | (407 | ) | (167 | ) | (585 | ) | ||||||
| Net change in inventory | (352 | ) | 258 | 727 | ||||||||
| By-product credits | (176 | ) | (199 | ) | (124 | ) | ||||||
| Smelting and refining costs | 76 | 61 | 42 | |||||||||
| Foreign exchange translation and other | 176 | 462 | 164 | |||||||||
| C1 cash costs | $ | 5,424 | $ | 5,249 | $ | 5,616 | ||||||
| Site general and administrative | 1,232 | 1,196 | 559 | |||||||||
| Accretion of mine closure and rehabilitation provision | 105 | 106 | 112 | |||||||||
| Sustaining capital expenditure | 3,013 | 4,547 | 2,296 | |||||||||
| Sustaining leases | 1,660 | 1,559 | 822 | |||||||||
| Royalties and production taxes | 338 | 262 | 204 | |||||||||
| AISC | $ | 11,772 | $ | 12,919 | $ | 9,609 | ||||||
|
Costs |
||||||||||||
| Mining | $ | 2,567 | $ | 2,311 | $ | 3,218 | ||||||
| Processing | 1,905 | 2,067 | 1,698 | |||||||||
| Indirect | 1,052 | 1,009 | 782 | |||||||||
| Production costs | 5,524 | 5,387 | 5,698 | |||||||||
| Smelting and refining costs | 76 | 61 | 42 | |||||||||
| By-product credits | (176 | ) | (199 | ) | (124 | ) | ||||||
| C1 cash costs | $ | 5,424 | $ | 5,249 | $ | 5,616 | ||||||
| Site general and administrative | 1,232 | 1,196 | 559 | |||||||||
| Accretion of mine closure and rehabilitation provision | 105 | 106 | 112 | |||||||||
| Sustaining capital expenditure | 3,013 | 4,547 | 2,296 | |||||||||
| Sustaining leases | 1,660 | 1,559 | 822 | |||||||||
| Royalties and production taxes | 338 | 262 | 204 | |||||||||
| AISC | $ | 11,772 | $ | 12,919 | $ | 9,609 | ||||||
| Costs per ounce | ||||||||||||
| Payable gold produced (ounces) | 12,443 | 11,786 | 8,796 | |||||||||
| Mining | $ | 206 | $ | 196 | $ | 366 | ||||||
| Processing | $ | 153 | $ | 175 | $ | 193 | ||||||
| Indirect | $ | 85 | $ | 86 | $ | 89 | ||||||
| Smelting and refining | $ | 6 | $ | 6 | $ | 5 | ||||||
| By-product credits | $ | (14 | ) | $ | (17 | ) | $ | (15 | ) | |||
| C1 cash costs of gold produced (per ounce) | $ | 436 | $ | 445 | $ | 638 | ||||||
| AISC of gold produced (per ounce) | $ | 946 | $ | 1,096 | $ | 1,092 | ||||||
Earnings before interest, taxes, depreciation and amortization (EBITDA) and Adjusted EBITDA
The following table provides a reconciliation of EBITDA and Adjusted EBITDA to net income, its most directly comparable IFRS measure.
| Reconciliation: | 2023 – Q1 | 2022 – Q4 | 2022 – Q1 | |||||||||
| Net Income | $ | 24,500 | $ | 22,472 | $ | 52,486 | ||||||
| Adjustments: | ||||||||||||
| Finance expense | 6,526 | 12,290 | 5,496 | |||||||||
| Income tax expense | 4,666 | 7,540 | 8,606 | |||||||||
| Amortization and depreciation | 16,083 | 16,361 | 11,504 | |||||||||
| EBITDA | $ | 51,775 | $ | 58,663 | $ | 78,092 | ||||||
| Foreign exchange gain | (8,621 | ) | (4,569 | ) | (18,709 | ) | ||||||
| Share based compensation | 5,017 | 4,123 | 1,990 | |||||||||
| Incremental COVID-19 costs | — | — | 1,004 | |||||||||
| Adjusted EBITDA | $ | 48,171 | $ | 58,217 | $ | 62,377 | ||||||
Adjusted net income attributable to owners of the Company and Adjusted net income per share attributable to owners of the Company
The following table provides a reconciliation of Adjusted net income attributable to owners of the Company and Adjusted EPS to net income attributable to the owners of the Company, its most directly comparable IFRS measure.
| Reconciliation: | 2023 – Q1 | 2022 – Q4 | 2022 – Q1 | |||||||||
| Net income as reported attributable to the owners of the Company | $ | 24,154 | $ | 22,159 | $ | 52,107 | ||||||
| Adjustments: | ||||||||||||
| Share based compensation | 5,017 | 4,123 | 1,990 | |||||||||
| Unrealized foreign exchange gain on USD denominated balances in MCSA | (4,753 | ) | (1,782 | ) | (1,337 | ) | ||||||
| Unrealized foreign exchange gain on foreign exchange derivative contracts | (3,152 | ) | (3,017 | ) | (24,615 | ) | ||||||
| Incremental COVID-19 costs | — | — | 998 | |||||||||
| Tax effect on the above adjustments | 1,208 | 731 | 3,808 | |||||||||
| Adjusted net income attributable to owners of the Company | $ | 22,474 | $ | 22,214 | $ | 32,951 | ||||||
| Weighted average number of common shares | ||||||||||||
| Basic | 92,294,045 | 91,522,358 | 90,238,008 | |||||||||
| Diluted | 93,218,281 | 92,551,916 | 92,050,104 | |||||||||
| Adjusted EPS | ||||||||||||
| Basic | $ | 0.24 | $ | 0.24 | $ | 0.37 | ||||||
| Diluted | $ | 0.24 | $ | 0.24 | $ | 0.36 | ||||||
Net (Cash) Debt
The following table provides a calculation of net (cash) debt based on amounts presented in the Company’s condensed consolidated interim financial statements as at the periods presented.
| March 31, 2023 | December 31, 2022 | March 31, 2022 | |||||||||
| Current portion of loans and borrowings | $ | 9,221 | $ | 15,703 | $ | 8,740 | |||||
| Long-term portion of loans and borrowings | 401,595 | 402,354 | 402,345 | ||||||||
| Less: | |||||||||||
| Cash and cash equivalents | (209,908 | ) | (177,702 | ) | (365,465 | ) | |||||
| Short-term investments | (26,739 | ) | (139,700 | ) | (100,018 | ) | |||||
| Net (cash) debt | $ | 174,169 | $ | 100,655 | $ | (54,398 | ) | ||||
Working Capital and Available Liquidity
The following table provides a calculation for these based on amounts presented in the Company’s condensed consolidated interim financial statements as at the periods presented.
| March 31, 2023 | December 31, 2022 | March 31, 2022 | |||||||||
| Current assets | $ | 331,241 | $ | 392,427 | $ | 546,439 | |||||
| Less: Current liabilities | (112,448 | ) | (129,121 | ) | (102,743 | ) | |||||
| Working capital | $ | 218,793 | $ | 263,306 | $ | 443,696 | |||||
| Cash and cash equivalents | 209,908 | 177,702 | 365,465 | ||||||||
| Short-term investments | 26,739 | 139,700 | 100,018 | ||||||||
| Available undrawn revolving credit facilities | 150,000 | 75,000 | 75,000 | ||||||||
| Available liquidity | $ | 386,647 | $ | 392,402 | $ | 540,483 | |||||
ABOUT ERO COPPER CORP
Ero is a high-margin, high-growth, clean copper producer with operations in Brazil and corporate headquarters in Vancouver, B.C. The Company’s primary asset is a 99.6% interest in the Brazilian copper mining company, Mineração Caraíba S.A. 100% owner of the Company’s Caraíba Operations (formerly known as the MCSA Mining Complex), which are located in the Curaçá Valley, Bahia State, Brazil and include the Pilar and Vermelhos underground mines and the Surubim open pit mine, and the Tucumã Project (formerly known as Boa Esperança), an IOCG-type copper project located in Pará, Brazil. The Company also owns 97.6% of NX Gold S.A. which owns the Xavantina Operations (formerly known as the NX Gold Mine), comprised of an operating gold and silver mine located in Mato Grosso, Brazil. Additional information on the Company and its operations, including technical reports on the Caraíba Operations, Xavantina Operations and Tucumã Project, can be found on the Company’s website (www.erocopper.com), on SEDAR (www.sedar.com), and on EDGAR (www.sec.gov).
Newmont Corporation (NYSE: NEM) (ASX: NEM) (PNGX: NEM) issued the... READ MORE
Northern Discovery Metals Inc. is pleased to announce that... READ MORE
Pacific Ridge Exploration Ltd. (TSX-V: PEX) (OTCQB: PEXZF) (FSE: ... READ MORE
Completes Geochemical Survey at Nessa Properties in Domeyko Fault... READ MORE
Copper Fox Metals Inc. (TSX-V: CUU) (OTCQX: CPFXF) (FSE: HPU) i... READ MORE


