


Aura Minerals Inc. (TSX: ORA) (B3: AURA33) (OTCQX: ORAAF) announces that it has filed unaudited consolidated financial statements and management discussion and analysis for the period ended September 30, 2022, which also contains the Annual Guidance Update and a new long term production target. The full version of the Financial and Operational Results can be viewed on the Company’s website at www.auraminerals.com or on SEDAR at www.sedar.com. All amounts are in U.S. dollars unless stated otherwise.
Q3 2022 Highlights (Compared to Q3 2021):
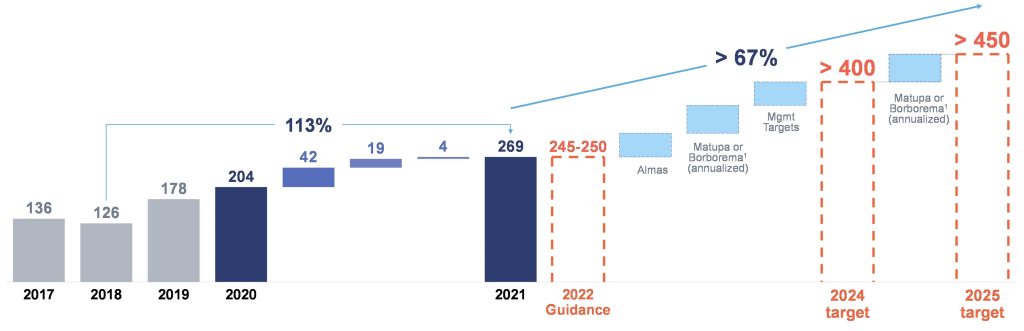
Rodrigo Barbosa, President and CEO of Aura, commented: “We continued to increase production at our mines in Q3 and expect to continue on this path in Q4. Lower copper prices and weaker-than-expected production at San Andres pushed our 2022 production guidance to a lower range. Despite the short-term challenges in San Andres, we are moving forward with our growth pipeline: construction of Almas is on time and on budget, we recently released the Feasibility Study of the Matupá project and closed the acquisition of 80% of Big River Gold Limited. Now, we not only aim to produce over 400,000 GEO annualized by 2024 but to reach over 450,000 GEO annualized by 2025, all of it while paying dividends and under the highest ESG standards which we call Aura 360.”
Operational And Financial Overview (US$ thousand)
| For the three months ended September 30, 2022 |
For the three months ended September 30, 2021 |
For the nine months ended September 30, 2022 |
For the nine months ended September 30, 2021 |
|||||
| Total Production1 (GEO) | 58,175 | 61,588 | 174,861 | 191,389 | ||||
| Sales2 (GEO) | 57,963 | 63,669 | 179,138 | 201,786 | ||||
| Net Revenue | 81,189 | 97,060 | 286,849 | 310,158 | ||||
| Adjusted EBITDA | 16,661 | 39,144 | 97,195 | 134,096 | ||||
| Cash costs per GEO sold | 971 | 825 | 924 | 799 | ||||
| Ending Cash balance | 120,916 | 165,059 | 120,916 | 165,059 | ||||
| Net Debt | 80,723 | (7,695 | ) | 80,723 | (7,695 | ) | ||
| Recurring Capex | (12,060 | ) | (17,262 | ) | (21,567 | ) | (37,321 | ) |
| 1 Considers capitalized production | ||||||||
| 2 Does not consider capitalized production | ||||||||
Guidance Update
2022 Guidance:
The Company’s updated gold equivalent production, cash operating cost per gold equivalent ounce produced and Capex guidance for 2022 is detailed below.
Production
The table below details the Company’s updated GEO production guidance for 2022 by business unit:
| Production (‘000 GEO) 2022 |
||||
| Updated | Previous | |||
| Aranzazu | 109 – 110 | 115 – 120 | ||
| EPP Mines | 69 – 71 | 70 – 75 | ||
| San Andrés | 67 – 69 | 75 – 80 | ||
| Total | 245 – 250 | 260 – 275 | ||
Factors that contributed to the change in the Company’s guidance include:
In addition to production guidance for 2022, management’s targets for production for 2024-2025 across its business units are presented below.
Management maintains the previous annualized production target of more than 400,000 GEO by the year ending December 31, 2024, and has added a production target of more than 450,000 annualized GEO for the year ending December 31, 2025:
A chart accompanying this announcement is available at
https://www.globenewswire.com/NewsRoom/AttachmentNg/77fb9a3a-8145-481d-a608-5f3efb91cfd7
1) Considering 80% of the ounces to be produced by the Borborema project
Notes: 2022 figures are based on current technical reports for the Company’ s projects, except as otherwise noted. Please refer to the heading “Technical Information”. Figures for 2024 and 2025 are based on management’s expectations based on a variety of factors, including preliminary, high-level studies for each of the assets. These targets are management’ s objectives only and are subject to certain risks and assumptions. See “Forward-Looking Information”. Includes ounces capitalized from EPP projects and Gold Road in 2020 and 2021.
Cash costs
The table below shows the Company’s updated cash operating costs per GEO sold guidance for 2022 by Business Unit:
| Cash Cost per GEO (US$ thousand) 2022 |
||||
| Updated | Previous | |||
| Aranzazu | 672 – 696 | 645 – 690 | ||
| EPP Mines | 963 – 987 | 955 – 992 | ||
| San Andrés | 1,115 – 1,139 | 910 – 980 | ||
| Total | 875 – 899 | 803 – 853 | ||
Capex:
The table below shows the breakdown of estimated capital expenditures by type of investment, and a comparison to the previous guidance:
| Capex (US$ million) 2022 |
||||
| Updated | Previous | |||
| New projects + Expansion | 66 – 68 | 55 – 61 | ||
| Exploration | 8 – 9 | 12 – 14 | ||
| Sustaining | 32 – 33 | 33 – 36 | ||
| 106 – 110 | 100 – 111 | |||
Key Factors
The Company’s future profitability, operating cash flows, and financial position will be closely related to the prevailing prices of gold and copper. Key factors influencing the price of gold and copper include, but are not limited to, the supply of and demand for gold and copper, the relative strength of currencies (particularly the United States dollar), and macroeconomic factors such as current and future expectations for inflation and interest rates. Management believes that the short-to-medium term economic environment is likely to remain relatively supportive for commodity prices but with continued volatility.
To decrease risks associated with commodity prices and currency volatility, the Company will continue to evaluate and implement available protection programs. For additional information on this, please refer to the AIF.
Other key factors influencing profitability and operating cash flows are production levels (impacted by grades, ore quantities, process recoveries, labor, country stability, plant, and equipment availabilities), production and processing costs (impacted by production levels, prices, and usage of key consumables, labor, inflation, and exchange rates), among other factors.
Non-GAAP Measures
In this press release, the Company has included Adjusted EBITDA, cash operating costs per gold equivalent ounce sold and net debt which are non-GAAP measures. These non-GAAP measures do not have any standardized meaning within IFRS and therefore may not be comparable to similar measures presented by other companies. The Company believes that these measures provide investors with additional information which is useful in evaluating the Company’s performance and should not be considered in isolation or as a substitute for measures of performance prepared in accordance with IFRS. The below tables provide a reconciliation of the non-GAAP measures presented:
Reconciliation from Income for the Quarter for EBITDA and Adjusted EBITDA:
| For the three months ended September 30, 2022 |
For the three months ended September 30, 2021 |
For the nine months ended September 30, 2022 |
For the nine months ended September 30, 2021 |
||||
| Profit (loss) from continued operation | 70 | 11,190 | 43,934 | 61,882 | |||
| Income tax (expense) recovery | 2,099 | 8,240 | 23,084 | 25,369 | |||
| Deferred income tax (expense) recovery | 2,822 | 6,117 | (262 | ) | 16,147 | ||
| Finance costs | 5,912 | 5,065 | 5,626 | 6,447 | |||
| Other gains (losses) | (3,330 | ) | 33 | (2,255 | ) | (1,098 | ) |
| Depreciation | 9,088 | 8,499 | 27,068 | 25,349 | |||
| EBITDA | 16,661 | 39,144 | 97,195 | 134,096 | |||
| Impairment | – | – | – | – | |||
| ARO Change | – | – | – | – | |||
| Adjusted EBITDA | 16,661 | 39,144 | 97,195 | 134,096 | |||
Reconciliation from the consolidated financial statements to cash operating costs per gold equivalent ounce sold:
| For the three months ended September 30, 2022 |
For the three months ended September 30, 2021 |
For the nine months ended September 30, 2022 |
For the nine months ended September 30, 2021 |
|||||
| Cost of goods sold | (65,361 | ) | (59,421 | ) | (192,335 | ) | (178,588 | ) |
| Depreciation | 9,061 | 8,337 | 26,753 | 24,820 | ||||
| COGS w/o Depreciation | (56,300 | ) | (51,084 | ) | (165,582 | ) | (153,768 | ) |
| Gold Equivalent Ounces sold(2) | 57,963 | 61,715 | 179,138 | 191,794 | ||||
| Cash costs per gold equivalent ounce sold | 971 | 825 | 924 | 799 | ||||
| (1) Considers exclusively finished product | ||||||||
| (2) Do not considers pre-commercial production and sale, capitalized | ||||||||
| (3) Do not consider Gold Road, due to reclassification | ||||||||
Reconciliation Net Debt:
| September 30, 2022 |
December 31, 2021 |
|||||
| Short Term Loans | 84,045 | 58,169 | ||||
| Long-Term Loans | 123,731 | 99,862 | ||||
| Plus / (Less): Derivative Financial Instrument | (5,537 | ) | 2,779 | |||
| Less: Cash and Cash Equivalents | (120,916 | ) | (161,490 | ) | ||
| Less: Restricted Cash | (600 | ) | (944 | ) | ||
| Net Debt | 80,723 | (1,624 | ) | |||
Qualified Person
Farshid Ghazanfari, P.Geo., Geology and Mineral Resources Director for Aura Minerals Inc. has reviewed and confirmed the scientific and technical information contained within this news release and serves as the Qualified Person as defined in National Instrument 43-101.
About Aura 360° Mining
Aura is focused on mining in complete terms – thinking holistically about how its business impacts and benefits every one of our stakeholders: our company, our shareholders, our employees, and the countries and communities we serve. We call this 360° Mining.
Aura is a mid-tier gold and copper production company focused on the development and operation of gold and base metal projects in the Americas. The Company’s producing assets include the San Andres gold mine in Honduras, the Ernesto/Pau-a -Pique gold mine in Brazil and the Aranzazu copper-gold-silver mine in Mexico. In addition, the Company has four additional gold projects in Brazil: Almas, under construction; Borborema and Matupá, in development, and São Francisco, in care & maintenance, and one gold project in Colombia, Tolda Fria.
Aura Minerals Inc. (NASDAQ: AUGO) (B3: AURA33) is pleased to anno... READ MORE
GR Silver Mining Ltd. (TSX-V: GRSL) (OTCQX: GRSLF) (FRANKF... READ MORE
Empress Royalty Corp. (TSX-V: EMPR | OTCQX: EMPYF) is pleased to ... READ MORE
JZR Gold Inc. (TSX-V: JZR) (OTCPK: JZRIF) is pleased to announce ... READ MORE
Colibri Resource Corporation (TSX-V: CBI) is pleased to announce ... READ MORE


