


i-80 GOLD CORP. (TSX: IAU) (NYSE: IAUX) is pleased to announce the results of an updated preliminary economic assessment for the Cove Project, an advanced underground exploration project located on the Battle Mountain-Eureka Trend in Northern Nevada, United States. The 2025 PEA confirms that the high-grade Cove Project has the potential to become a key component of the Company’s regional “hub-and-spoke” mining and processing strategy.
The 2025 PEA replaces the previous PEA for the Project completed in 2021. The Study has been updated to reflect a remodeling of the deposit using a more confined mining geometry, further advancement of the hydrology model, as well as using updated precious metals prices, capital and operating costs. All amounts are in United States dollars, unless otherwise stated.
“The 2025 PEA for the Cove Project represents an important first step in delivering updated technical information across i-80 Gold’s asset portfolio. The results validate our planned regional hub-and-spoke model of feeding a central processing plant with high-grade material from three underground mines, which is expected to form the production base for i-80 Gold moving forward. In the coming weeks, we look forward to releasing updated PEAs for Granite Creek (both open pit and underground) and the Ruby Hill Complex (Archimedes underground and Mineral Point open pit),” stated Richard Young, Chief Executive Officer of i-80 Gold.
2025 PEA Highlights
Mineral Estimates, Production and Mine Life
Project Economics
Mining and Processing
Table 1: Summary of 2025 PEA Key Operating and Financial Metrics
| Project Economics | Unit | |
| Gold Price | $/oz | $2,175 |
| Silver Price | $/oz | $27.25 |
| Pre-Tax NPV(5%)(2) | $M | $337 |
| After-Tax Cash Flow(2) | $M | $397 |
| After-Tax NPV(5%)(2) | $M | $271 |
| After-Tax IRR | % | 30 % |
| Production Profile | ||
| Mine Life | years | 8 |
| Mineralized Material Mined | 000s tonnes |
2,675.6 |
| Gold Grade of Mineralized Material Mined | g/t Au | 10.4 |
| Silver Grade of Mineralized Material Mined | g/t Ag | 6.2 |
| Waste Tonnes Mined | 000s tonnes |
226.1 |
| Total Tonnes Mined | 000s tonnes |
2,901.8 |
| Total Mineralized Material Processed | 000s tonnes |
2,675.6 |
| Gold Grade Processed | g/t Au | 10.4 |
| Silver Grade Processed | g/t Ag | 6.2 |
| Average Gold Recovery | % | 83 % |
| Average Silver Recovery | % | 24 % |
| Total Gold Recovered | 000s oz | 739.6 |
| Total Silver Recovered | 000s oz | 114.5 |
| Average Annual Gold Production (LOM) | 000s oz | 92.4 |
| Average Annual Gold Production (following production ramp up) |
000s oz | 100 |
| Unit Operating Costs | ||
| LOM Operating Cost | ||
| Mineralized Material Mined | $/t | 142.2 |
| Mineralized Material and Waste Mined | $/t | 141.0 |
| Processed | $/t milled | 80.0 |
| Transportation Costs | $/t milled | 20.8 |
| Electricity Dewatering | $/t milled | 26.5 |
| G&A | $/t milled | 21.5 |
| LOM Total Cash Costs(1) (net of by-product credit) |
$/oz | $1,194 |
| LOM All-in Sustaining Costs(1) (net of by-product credit) |
$/oz | $1,303 |
| Total Capital Costs | ||
| Pre-Development Capital | $M | $17.3 |
| Construction Capital | $M | $157.4 |
| LOM Sustaining Capital | $M | $49.1 |
| Closure Costs | $M | $31.3 |
| Total Capital & Closure Costs(3) | $M | $255.1 |
“The Study highlights the value Cove brings to our gold portfolio, showcasing high-grade mineralization on a brownfield site in a top-tier mining jurisdiction, with low capital requirements and a high return on invested capital,” added Matthew Gili, President and Chief Operating Officer of i-80 Gold. “The Study primarily updates the 2021 PEA’s economic model and includes findings from hydrological studies, which have increased our understanding of the Project’s dewatering needs. Additionally, the completion of an exploration decline has enabled infill resource drilling and advanced metallurgical test work, which will be included in a feasibility study planned for the fourth quarter of 2025.”
Mineral Resource Update
The 2025 PEA is based on a revised resource model with no additional drilling results included, relative to the 2021 PEA. The updated resource estimate has been calculated using stope optimizer software, whereas the previous mineral resource was not. The new methodology generates optimal mineable stope geometries while considering several factors including geological constraints, grade distribution and stope dimensions. This significantly improves the accuracy of mineral resource estimates and has become an industry standard for underground deposits in Nevada.
The updated mineral resource estimate includes a total of 311,000 ounces of gold at 8.2 g/t Au in the indicated category and 1,156,000 ounces of inferred resources at 8.9 g/t in the inferred category (see Table 2). The majority of the indicated resource is currently hosted in the Helen deposit (see Figure 1). The updated estimate resulted in additional mineralized body constraints resulting in indicated and inferred tonnes decreasing by 6% and 13% respectively. Moreover, gold ounces decreased by 20% in the indicated and inferred categories, however the updated mineral resource represents more mineable shapes than the prior resource estimate.
The ongoing Cove drilling program has been designed to infill mineralization in the Helen and Gap zones ahead of a planned feasibility study in 2025. The Project offers substantial exploration potential as the bulk of the work completed to date has been focused on the main deposit areas only. Exploration from 2014 through 2019 resulted in the identification of several new zones of mineralization that have received minimal follow-up, including mineralization in the 2201 zone (153,000 tonnes at 26.7 g/t Au) beneath the Cove pit (see Figure 1).
Table 2: Cove Mineral Resource Estimate as at December 31, 2024
| Indicated Mineral Resources | ||||||
| Tonnes | Au | Ag | Au | Ag | ||
| (000) | (g/t) | (g/t) | (000 oz) | (000 oz) | ||
| Helen | 674 | 9.3 | 2.6 | 201 | 55 | |
| Gap | 254 | 7.5 | 8.9 | 61 | 72 | |
| CSD | 249 | 6.0 | 55.0 | 48 | 441 | |
| Total Indicated | 1,178 | 8.2 | 15.0 | 311 | 569 | |
| Inferred Mineral Resources | ||||||
| Tonnes | Au | Ag | Au | Ag | ||
| (000) | (g/t) | (g/t) | (000 oz) | (000 oz) | ||
| Helen | 1,582 | 8.4 | 2.9 | 427 | 146 | |
| Gap | 2,022 | 8.4 | 9.0 | 543 | 585 | |
| CSD | 290 | 5.9 | 57.8 | 55 | 538 | |
| 2201 | 153 | 26.7 | 34.8 | 131 | 171 | |
| Total Inferred | 4,046 | 8.9 | 11.1 | 1,156 | 1,439 | |
|
Notes to table above: |
||||||
| I. | Mineral resources have been estimated at a gold price of $2,175 per troy ounce and a silver price of $27.25 per troy ounce; | |||||
| II. | Mineral resources have been estimated using gold metallurgical recoveries ranging from 73.2% to 93.3% for roasting and 78.5% to 95.1 % for pressure oxidation; | |||||
| III. | Roaster cutoff grades range from 4.15 to 5.29 Au g/t (0.121 to 0.154 opt) and pressure oxidation cutoff grades range from 3.83 to 4.64 Au g/t (0.112 to 0.135 opt); | |||||
| IV. | The effective date of the mineral resource estimate is December 31, 2024; | |||||
| V. | Mineral resources, which are not mineral reserves, do not have demonstrated economic viability. The estimate of mineral resources may be materially affected by environmental, permitting, legal, title, socio-political, marketing, or other relevant factors; | |||||
| VI. | An inferred mineral resource is that part of a mineral resource for which quantity and grade or quality are estimated on the basis of limited geological evidence and sampling. Geological evidence is sufficient to imply but not verify geological and grade or quality continuity. An inferred mineral resource has a lower level of confidence than that applying to an indicated mineral resource and must not be converted to a mineral reserve. It is reasonably expected that the majority of Inferred Mineral Resources could be upgraded to Indicated Mineral Resources with continued exploration; and | |||||
| VII. | The reference point for mineral resources is in situ. | |||||
Economic Analysis
Cove’s NPV and IRR in relation to fluctuations in the long-term gold price are demonstrated in Table 3 and the Project’s cost sensitivities are illustrated in Figure 2 below.
Table 3: Cove Project Gold Price Sensitivity After-tax Analysis
| Gold Price ($/oz) | |||||||
| $1,850 | $2,000 | $2,175 | $2,500 | $2,750 | $2,900 | $3,000 | |
| NPV5%(2) ($M) | $134 | $198 | $271 | $409 | $516 | $582 | $626 |
| IRR (%) | 19 % | 24 % | 30 % | 40 % | 47 % | 52 % | 54 % |
Project Overview
The Project is located 25 miles southwest of the town of Battle Mountain, in the McCoy mining district in the Fish Creek Mountains of Lander County, Nevada (see Figure 3). The Cove deposit was mined by Echo Bay Mines Ltd. (Echo Bay) between 1988 and 2000 during which period the Cove deposit produced 2.6 million ounces of gold and 100 million ounces of silver. Gold and silver production from heap leach pads continued until 2006. The Project benefits from extensive historical geological datasets, its location in a jurisdiction with deep mining pedigree, and access to both local and regional infrastructure, including proximity to paved highways, electrical power, pre-existing mine infrastructure, and a skilled labor force.
i-80 Gold’s predecessor purchased the Cove project in 2012 and has since conducted significant exploration and infill drilling, metallurgical testing, and has advanced the permitting process. The Company expects to begin expending development capital, primarily for dewatering activities in late 2027 or early 2028 and for production to ramp up during 2029.
Geology and Mineralization
The Cove deposit consists of Helen, Gap, CSD, and 2201 zones. They are located beneath the historically mined Cove open pit and extend approximately 2,000 feet northwest from the pit (see Figure 1). The current mine plan includes Helen and Gap while CSD and 2021 could be included in a future mine plan, subject to the completion of additional technical work.
Three main types of mineralization occur at Cove. The Helen and Gap zones are Carlin-style disseminated refractory gold deposits. The Cove South Deep (CSD) gold and silver mineralization is similar in character to that at Helen and Gap but is characterized by silver to gold ratios of 50:1 to over 100:1. The 2201 zone is comprised of disseminated sulfides within sheeted stockwork veins and massive sulfide lenses replacing carbonate. Both styles of mineralization in the 2201 zone contain locally high concentrations of lead and zinc in addition to gold and silver. Structural controls on mineralization include the broad, gently southeast-plunging Cove anticline, several northeast striking dike-filled normal faults (Cay, Blasthole, Bay, 110, Gold Dome), mafic sills, and rheology contrasts.
Although most well-known Carlin-type deposits are hosted in Paleozoic slope and shelf carbonates, host rocks at Cove are silty to massive limestones and dolomites of the Triassic Star Peak Group. Limestone and silty limestone of the Favret Formation (approximately 700 feet thick) are the primary host for Carlin-style mineralization, and the Dixie Valley Formation conglomerates are the primary host of polymetallic vein mineralization in the 2201 zone.
Mining and Processing
The Study demonstrates an initial 8-year mine life with average annual gold production of approximately 100,000 ounces of gold following ramp up. The Study represents a preliminary point-in-time estimate of the mine plan. Once underground infrastructure is constructed a significant exploration program is planned to follow up on earlier positive drill results in a more cost-effective manner with a goal of extending the mine life beyond the current 8 years.
The high-grade mine will be accessed by a single ramp extending from the surface (elevation 4,625 ft) to the lowest extent of planned mining (elevation 3,430 ft). The access ramp will be large enough to accommodate 30-ton trucks. A series of raises will provide secondary egress and ventilation. A mining contractor will extract the mineralization using drift and fill mining methods at an average rate of approximately 1,100tonnes per day.
Metallurgical testing has demonstrated that both Helen and Gap resources are generally refractory and require an oxidation process to increase gold extraction using whole cyanidation of mineralized material. Composite testing has shown that Helen samples are generally more amenable to roasting and carbon-in-leach (“CIL”) processing, while the Gap zone is more amenable to an autoclave process followed by CIL. Upon the commencement of mining and processing, a detailed and systematic mineralized material control sampling program will be utilized to determine which of the two facilities (roaster vs. autoclave) the material should be routed to, to maximize recovery rates.
The PEA incorporates toll-milling arrangements with associated over-the-road trucking costs for both process streams. The PEA contemplates the use of the Lone Tree autoclave (owned by the Company and in respect of which an autoclave refurbishment class 3 engineering study is expected to be completed in 2025) and a third-party roaster for which a toll-milling agreement has been negotiated for the treatment of that material.
Capital Cost Summary
Mine construction capital is estimated to be $157.4 million. Approximately 60% of capital expenditures is for dewatering activities with the balance to be used for portal and underground development to gain access to the mineralized bodies (see Table 4). The low development capital required to construct Cove is due in part to the existence of significant infrastructure, including a portal to the Helen deposit and 5,739 feet of development work already completed. Permitting activities are well underway (see Permitting section for more detail). The permitting process is expected to take approximately three years to complete followed by 18 months of construction which is primarily dewatering and underground development, as well as some light surface infrastructure work.
Cove is expected to generate an estimated $379 million in net cash flow over the current 8-year mine life (see Figure 5).
Table 4: Capital Cost Estimates
| Pre- Development |
Mine Construction |
Sustaining | |
| ($M) | ($M) | ($M) | |
| Environmental, Permitting and Feasibility | $7.0 | – | – |
| Dewatering – Helen | – | $39.5 | – |
| Dewatering – Gap | – | $48.4 | – |
| Electrical Service and Powerline | – | $10.5 | – |
| Mine Development – Helen | – | $24.8 | $21.0 |
| Mine Development – Gap | – | $0.4 | $20.3 |
| Mine Facilities | – | $2.2 | $1.3 |
| Pre-production Expense | $5.0 | $3.6 | – |
| Resource Conversion Drilling | $2.0 | – | – |
| Contingency (15% Drilling and Development; 25% Facilities) |
$3.3 | $28.0 | $6.5 |
| Total Capital Cost(3) | $17.3 | $157.4 | $49.1 |
Operating Cost Summary
The 2025 PEA estimates a cash cost(1) of $1,194 per ounce of gold and an all-in sustaining costs(1) of $1,303 per ounce of gold for the LOM (see Table 5). Figure 6 illustrates these operating costs over Cove’s estimated production profile.
Table 5: Total and Unit Operating Costs
| Total Costs | Unit Cost | Cost per Ounce | |
| ($M) | ($/t milled) | ($/oz Au) | |
| Mining | $408 | $152 | $552 |
| Transportation & Processing | $270 | $101 | $365 |
| Electrical Power | $71 | $26 | $96 |
| G&A, Royalties & Net Proceeds Tax | $138 | $51 | $186 |
| By-Product Credits | ($3) | ($1) | ($4) |
| Total Operating Cost/Cash Cost | $883 | $330 | $1,194 |
| Closure & Reclamation | $31 | $12 | $42 |
| Sustaining Capital | $49 | $18 | $66 |
| All-in Sustaining Costs(1) | $963 | $360 | $1,303 |
Permitting
National Environmental Policy Act (NEPA) associated permitting activities continue to progress with all baseline study reports and the Plan of Operations Amendment having been submitted to the Bureau of Land Management (BLM). The permitting action is anticipated to require a Notice of Intent to Complete an Environmental Impact Statement (EIS). Following the EIS notification process, a public scoping period will be completed and a draft EIS will be prepared and subsequently posted for public review and comment. The public comments and associated responses will be incorporated into the Final EIS document for BLM acceptance.
Nevada Division of Environmental Protection (NDEP) permitting activities are also in progress, focusing on the submittal and subsequent acceptance of modification applications to the site’s Water Pollution Control Permits and Reclamation Permit, in addition to, a new Air Quality Operating Permit application, submittal, and issuance.
These permitting activities are well underway and are expected to take approximately three years to complete from the effective date of the technical report, with permits anticipated by the end of 2027.
Next Steps to Feasibility Study
As stated earlier, a feasibility study under NI 43-101 with an updated mineral resource estimate is expected to be completed in the fourth quarter of 2025, in addition to a report prepared under S-K 1300. The updated resource will include 45,000 meters of drilling conducted since the completion of the exploration drift in the first quarter of 2023. Below is a summary of additional work to be conducted.
Resource Delineation and Exploration
Mining
Metallurgical Testing
The current resource delineation drilling program will provide samples needed for additional metallurgical testing to confirm the variability and viability of Helen and Gap resources to roasting and pressure oxidation (autoclave) with CIL. The objectives for the testing include:
Technical Disclosure and Qualified Persons
The 2025 PEA was prepared in accordance with National Instrument 43-101 Standards of Disclosure for Mineral Projects (“NI 43-101”). The full 2025 PEA will be filed within 45 days under the Company’s issuer profile on SEDAR+ at www.sedarplus.ca and on i-80 Gold’s profile. An Initial Assessment for the Cove Project (“S-K 1300 Report”) was also prepared in accordance with Subpart 1300 (“S-K 1300”) and Item 601 of the Regulation S-K and the S-K 1300 Report will be filed on EDGAR at www.sec.gov. Both reports will be available on the Company’s website at www.i80gold.com. The mineral estimates and project economics are the same under the 2025 PEA and the S-K 1300 Report.
The technical information contained in this press release has been prepared under the supervision of, and has been reviewed and approved by Dagny Odell, P.E., (SME No. 2402150) Practical Mining LLC, and Tyler Hill CPG., Vice President Geology for the Company, who are all qualified persons within the meaning of NI 43-101 and S-K 1300.
For a description of the data verification, assay procedures and the quality assurance program and quality control measures applied by the Company, please see the Company’s Annual Information
Form dated March 12, 2024 filed under the Company’s profile on SEDAR+ at www.sedarplus.ca and filed with the Company’s Form 40-F under the Company’s profile on EDGAR at www.sec.gov. Further information about the 2025 PEA referenced in this news release, including information in respect of data verification, key assumptions, parameters, risks and other factors, will be contained in the 2025 PEA.
The Study is preliminary in nature and includes an economic analysis that is based, in part, on inferred mineral resources. Inferred mineral resources that are considered too speculative geologically to have for the application of economic considerations applied to them that would enable them to be categorized as mineral reserves, and there is no certainty that the results of the Study will be realized. Mineral resources do not have demonstrated economic viability and are not mineral reserves.
Endnotes
| (1) | This is a non-IFRS/non-GAAP measure. Please see both sections titled “Non-IFRS Performance Measures/Non-GAAP Financial Performance Measures” below. |
| (2) | Cash flow and NPV are calculated as of the start of construction, which is anticipated to commence in January 2028. |
| (3) | Total Capital Cost in Table 4 excludes $7.2 million of contingent payments related to the acquisition of the property in 2012. These amounts are anticipated to be incurred in 2033 and 2034 and are based on reaching production milestones of 250,000 and 500,000 gold ounces, respectively. |
About i-80 Gold Corp.
i-80 Gold Corp. is a Nevada-focused mining company with the fourth largest gold mineral resources in the state of Nevada. The recapitalization plan underway is designed to unlock the value of the Company’s high-grade gold deposits to create a Nevada mid-tier gold producer. i-80 Gold’s common shares are listed on the TSX and the NYSE American under the trading symbol IAU:TSX and IAUX:NYSE. Further information about i-80 Gold’s portfolio of assets and long-term growth strategy is available at www.i80gold.com or by email at info@i80gold.com.
APPENDIX
Cove Project Detailed Cash Flow Model
All amounts are in United States dollars, unless otherwise stated.
| Cove Underground | UNITS | TOTAL LOM | 2025E | 2026E | 2027E | 2028E | 2029E | 2030E | 2031E | 2032E | 2033E | 2034E | 2035E | 2036E | 2037E | 2038E | 2039E | 2040+1 |
| Y -3 | Y -2 | Y -1 | Y 1 | Y 2 | Y 3 | Y 4 | Y 5 | Y 6 | Y 7 | Y 8 | Y 9 | Y 10 | Y 11 | Y 12 | Y 13 +1 |
|||
| MINING | ||||||||||||||||||
| Mine Life | Years | 8 | ||||||||||||||||
| Mineralized Material Mined | k tonnes | 2,676 | – | – | – | – | 150.3 | 156.8 | 444.3 | 429.9 | 452.3 | 383.7 | 397.2 | 261.0 | – | – | – | – |
| Waste Moved | k tonnes | 226 | – | – | – | – | 33.7 | 12.2 | 41.9 | 41.0 | 24.5 | 29.1 | 31.2 | 12.5 | – | – | – | – |
| Total Moved | k tonnes | 2,902 | – | – | – | – | 184.1 | 169.0 | 486.1 | 471.0 | 476.8 | 412.9 | 428.4 | 273.4 | – | – | – | – |
| Mineralized Material Moved Daily | tpd | 916 | – | – | – | – | 411.9 | 429.7 | 1,217.2 | 1,177.9 | 1,239.3 | 1,051.3 | 1,088.2 | 715.0 | – | – | – | – |
| Backfill Placed | k tonnes | 1,756 | – | – | – | – | 98.7 | 102.9 | 291.5 | 282.2 | 296.8 | 251.8 | 260.7 | 171.3 | – | – | – | – |
| Capitalized Mining | k tonnes | 467 | – | – | – | 3.2 | 190.8 | 86.3 | 39.1 | 97.7 | 4.4 | 45.2 | – | – | – | – | – | – |
| PROCESSING | ||||||||||||||||||
| Total Material for Processing | k tonnes | 2,676 | – | – | – | – | 150 | 157 | 245 | 272 | 594 | 600 | 397 | 261 | – | – | – | – |
| Au Average Grade | g/t Au | 10.4 | – | – | – | – | 8.83 | 10.06 | 11.06 | 11.71 | 11.32 | 9.44 | 9.64 | 10.78 | – | – | – | – |
| Contained Gold | ‘000 oz Au | 894 | – | – | – | – | 37.73 | 42.73 | 69.32 | 80.83 | 177.59 | 151.09 | 102.88 | 77.39 | – | – | – | – |
| Autoclave Processing | ||||||||||||||||||
| Total Tonnes Processed | k tonnes | 1,518 | – | – | – | – | 81 | 85 | – | 86 | 312 | 342 | 351 | 261 | – | – | – | – |
| Gold Grade | g/t Au | 10.02 | – | – | – | – | 9.37 | 10.06 | – | 12.26 | 10.94 | 9.20 | 9.02 | 10.78 | – | – | – | – |
| Silver Grade | g/t Au | 8.40 | – | – | – | – | 3.45 | 3.50 | – | 4.58 | 13.98 | 9.43 | 7.15 | 6.42 | – | – | – | – |
| Contained Gold | ‘000 oz Au | 489 | – | – | – | – | 24.3 | 27.3 | – | 34.1 | 109.8 | 101.1 | 101.9 | 90.4 | – | – | – | – |
| Contained Silver | ‘000 oz Ag | 410 | – | – | – | – | 9.0 | 9.5 | – | 12.7 | 140.4 | 103.6 | 80.7 | 53.9 | – | – | – | – |
| Gold Average Recovery | % | 86 % | – | – | – | – | 85.6 % | 85.6 % | – | 85.6 % | 85.6 % | 85.6 % | 85.6 % | 85.6 % | – | – | – | – |
| Silver Average Recovery | % | 25 % | – | – | – | – | 25.0 % | 25.0 % | – | 25.0 % | 25.0 % | 25.0 % | 25.0 % | 25.0 % | – | – | – | – |
| Recovered Gold | ‘000 oz Au | 418 | – | – | – | – | 20.8 | 23.4 | – | 29.1 | 94.0 | 86.5 | 87.2 | 77.4 | – | – | – | – |
| Recovered Silver | ‘000 oz Ag | 102 | – | – | – | – | 2.2 | 2.4 | – | 3.2 | 35.1 | 25.9 | 20.2 | 13.5 | – | – | – | – |
| Roaster Processing | ||||||||||||||||||
| Total Tonnes Processed | k tonnes | 1,158 | – | – | – | – | 70 | 72 | 245 | 185 | 282 | 258 | 46 | – | – | – | – | – |
| Gold Grade | g/t Au | 10.89 | – | – | – | – | 8.20 | 10.07 | 11.06 | 11.45 | 11.74 | 9.76 | 14.37 | – | – | – | – | – |
| Silver Grade | g/t Ag | 3.23 | – | – | – | – | 3.49 | 4.20 | 2.69 | 3.26 | 3.69 | 2.66 | 4.47 | – | – | – | – | – |
| Contained Gold | ‘000 oz Au | 406 | – | – | – | – | 18.4 | 23.4 | 87.1 | 68.2 | 106.3 | 81.0 | 21.2 | – | – | – | – | – |
| Contained Silver | ‘000 oz Ag | 120 | – | – | – | – | 7.8 | 9.8 | 21.2 | 19.4 | 33.4 | 22.1 | 6.6 | – | – | – | – | – |
| Gold Average Recovery | % | 79 % | – | – | – | – | 79.2 % | 79.2 % | 79.2 % | 79.2 % | 79.2 % | 79.2 % | 79.2 % | – | – | – | – | – |
| Silver Average Recovery | % | 10 % | – | – | – | – | 10.0 % | 10.0 % | 10.0 % | 10.0 % | 10.0 % | 10.0 % | 10.0 % | – | – | – | – | – |
| Recovered Gold | ‘000 oz Au | 321 | – | – | – | – | 16.9 | 19.3 | 69.3 | 51.7 | 83.6 | 64.6 | 15.7 | – | – | – | – | – |
| Recovered Silver | ‘000 oz Au | 12 | – | – | – | – | 0.8 | 1.0 | 2.1 | 1.9 | 3.3 | 2.2 | 0.7 | – | – | – | – | – |
| Total Tonnes Processed | k tonnes | 2,675.6 | – | – | – | – | 150.3 | 156.8 | 244.9 | 271.6 | 593.9 | 599.9 | 397.2 | 261.0 | – | – | – | – |
| Total Gold Production | ‘000 oz Au | 739.6 | – | – | – | – | 37.7 | 42.7 | 69.3 | 80.8 | 177.6 | 151.1 | 102.9 | 77.4 | – | – | – | – |
| Total Silver Production | ‘000 oz Ag | 114.5 | – | – | – | – | 3.0 | 3.4 | 2.1 | 5.1 | 38.4 | 28.1 | 20.8 | 13.5 | – | – | – | – |
| Total Gold Equivalent Production | ‘000 oz Au | 741.0 | – | – | – | – | 37.8 | 42.8 | 69.3 | 80.9 | 178.1 | 151.4 | 103.1 | 77.6 | – | – | – | – |
| REVENUE | ||||||||||||||||||
| Gold Price | $/oz Au | $2,175 | $2,175 | $2,175 | $2,175 | $2,175 | $2,175 | $2,175 | $2,175 | $2,175 | $2,175 | $2,175 | $2,175 | $2,175 | $2,175 | $2,175 | $2,175 | $2,175 |
| Silver Price | $/oz Ag | $27 | $27.25 | $27.25 | $27.25 | $27.25 | $27.25 | $27.25 | $27.25 | $27.25 | $27.25 | $27.25 | $27.25 | $27.25 | $27.25 | $27.25 | $27.25 | $27.25 |
| Revenues | $M | $1,612 | – | – | – | – | $82 | $93 | $151 | $176 | $387 | $329 | $224 | $169 | – | – | – | – |
| OPERATING COSTS | ||||||||||||||||||
| Mining Costs (incl. backfill) | $M | $381 | – | – | – | – | $21.6 | $22.4 | $62.4 | $61.9 | $64.2 | $54.7 | $57.1 | $36.2 | – | – | – | – |
| Mining Costs (waste) | $M | $27 | – | – | – | – | $4.1 | $1.5 | $5.1 | $5.0 | $3.0 | $3.6 | $3.7 | $1.5 | – | – | – | – |
| Autoclave Processing | $M | $118 | – | – | – | – | $6.3 | $6.6 | – | $6.7 | $24.4 | $26.7 | $27.4 | $20.4 | – | – | – | – |
| Roaster Processing | $M | $96 | – | – | – | – | $5.8 | $6.0 | $20.3 | $15.3 | $23.3 | $21.3 | $3.8 | – | – | – | – | – |
| Transportation | $M | $56 | – | – | – | – | $3.2 | $3.3 | $6.6 | $6.4 | $12.6 | $12.5 | $6.9 | $4.2 | – | – | – | – |
| Electrical Power | $M | $71 | – | – | – | – | $7.9 | $9.0 | $9.1 | $8.0 | $9.5 | $9.1 | $8.8 | $8.3 | $0.8 | $0.2 | – | – |
| G&A | $M | $58 | – | – | – | – | $7.2 | $7.2 | $7.2 | $7.2 | $7.2 | $7.2 | $7.2 | $7.2 | – | – | – | – |
| Total Operating Cost | $M | $806 | – | – | – | – | $56.1 | $56.0 | $110.6 | $110.5 | $144.1 | $135.0 | $114.9 | $77.8 | $0.8 | $0.2 | – | – |
| Refining & Sales | $M | $1 | – | – | – | – | $0.1 | $0.1 | $0.1 | $0.2 | $0.3 | $0.3 | $0.2 | $0.1 | – | – | – | – |
| Royalties & State Taxes | $M | $79 | – | – | – | – | $3.3 | $4.2 | $4.2 | $8.1 | $21.8 | $17.0 | $11.7 | $8.4 | – | – | – | – |
| Mining Costs (mineralized material) |
$/t mined | $142.2 | – | – | – | – | $144 | $143 | $140 | $144 | $142 | $143 | $144 | $139 | – | – | – | – |
| Mining Costs (waste) | $/t mined | $121.4 | – | – | – | – | $122 | $122 | $121 | $121 | $122 | $122 | $120 | $122 | – | – | – | – |
| Autoclave Processing | $/t milled | $78.1 | – | – | – | – | $78 | $78 | – | $78 | $78 | $78 | $78 | $78 | – | – | – | – |
| Roaster Processing | $/t milled | $82.7 | – | – | – | – | $83 | $83 | $83 | $83 | $83 | $83 | $83 | – | – | – | – | – |
| Transportation | $/t milled | $20.8 | – | – | – | – | $21 | $21 | $27 | $23 | $21 | $21 | $17 | $16 | – | – | – | – |
| Electrical Power | $/t milled | $26.5 | – | – | – | – | $52 | $57 | $37 | $30 | $16 | $15 | $22 | $32 | – | – | – | – |
| G&A | $/t milled | $21.5 | – | – | – | – | $48 | $46 | $29 | $26 | $12 | $12 | $18 | $28 | – | – | – | – |
| Total | $/t milled | $301.3 | – | – | – | – | $266 | $266 | $168 | $247 | $231 | $231 | $238 | $244 | – | – | – | – |
| CAPITAL EXPENDITURES | ||||||||||||||||||
| Contingent Payments | $M | $7 | – | – | – | – | – | – | – | – | $3.6 | $3.6 | – | – | – | – | – | – |
| Pre-Development Capital | $M | $17 | $9.4 | $4.6 | $3.3 | – | – | – | – | – | – | – | – | – | – | – | – | – |
| Capitalized Development & Construction | $M | $69 | – | – | – | $35.3 | $34.2 | – | – | – | – | – | – | – | – | – | – | – |
| Dewatering | $M | $88 | – | – | – | $69.9 | $18.0 | – | – | – | – | – | – | – | – | – | – | – |
| Sustaining Capital | $M | $49 | – | – | – | – | – | $15.2 | $6.8 | $14.4 | $0.7 | $12.0 | – | – | – | – | – | – |
| Total Capital | $M | $231 | $9.4 | $4.6 | $3.3 | $105.2 | $52.2 | $15.2 | $6.8 | $14.4 | $4.3 | $15.6 | – | – | – | – | – | – |
| Reclamation | $M | $31 | $0.2 | $0.2 | $0.2 | $0.8 | $0.8 | $0.8 | $0.8 | $0.8 | $0.8 | $0.8 | $0.8 | $4.6 | $4.6 | $4.6 | $4.6 | $5.8 |
| CASH COSTS & AISC | ||||||||||||||||||
| Total Cash Costs (Inc. Royalty) |
$/oz | $1,194 | – | – | – | – | $1,573 | $1,408 | $1,658 | $1,467 | $930 | $1,003 | $1,227 | $1,112 | – | – | – | – |
| AISC(1) | $/oz | $1,303 | – | – | – | – | $1,595 | $1,782 | $1,768 | $1,656 | $938 | $1,088 | $1,235 | $1,171 | – | – | – | – |
| CASH FLOW ANALYSIS | ||||||||||||||||||
| Revenue | $M | $1,612 | – | – | – | – | $82 | $93 | $151 | $176 | $387 | $329 | $224 | $169 | – | – | – | – |
| Operating Costs Gold & Royalties | $M | ($886) | – | – | – | – | ($59) | ($60) | ($115) | ($119) | ($166) | ($152) | ($127) | ($86) | ($1) | ($0) | – | – |
| Reclamation Accrual | $M | ($31) | – | – | – | – | ($2) | ($2) | ($3) | ($3) | ($8) | ($6) | ($4) | ($3) | – | – | – | – |
| Depreciation | $M | ($295) | – | – | – | – | ($13) | ($16) | ($25) | ($32) | ($70) | ($64) | ($44) | ($30) | – | – | – | – |
| Net Operating Income (Pre-Tax) |
$M | $400 | – | – | – | – | $8 | $15 | $8 | $22 | $143 | $107 | $50 | $49 | ($1) | ($0) | – | – |
| Income Taxes | $M | ($84) | – | – | – | – | ($3) | ($5) | ($2) | ($6) | ($33) | ($23) | ($11) | ($7) | $1 | $1 | $1 | $1 |
| Net Income | $M | $315 | – | – | – | – | $5 | $10 | $6 | $16 | $111 | $84 | $39 | $42 | $0 | $1 | $1 | $1 |
| Depreciation | $M | $295 | – | – | – | – | $13.3 | $16.0 | $25.2 | $32.1 | $70.2 | $63.8 | $43.5 | $30.3 | – | – | – | – |
| Reclamation | $M | – | ($0.2) | ($0.2) | ($0.2) | ($0.8) | $0.9 | $1.1 | $2.1 | $2.7 | $6.8 | $5.5 | $3.5 | ($1.6) | ($4.6) | ($4.6) | ($4.6) | ($5.8) |
| Working Capital | $M | $0 | – | – | – | – | ($6.9) | ($0.1) | ($6.3) | ($0.4) | ($5.5) | $1.6 | $2.9 | $4.7 | $9.9 | $0.1 | $0.0 | – |
| Operating Cash Flow | $M | $610 | ($0) | ($0) | ($0) | ($1) | $12 | $27 | $27 | $50 | $182 | $155 | $89 | $75 | $6 | ($4) | ($4) | ($5) |
| Capital Expenditures | $M | ($231) | ($9) | ($5) | ($3) | ($105) | ($52) | ($15) | ($7) | ($14) | ($4) | ($16) | – | – | – | – | – | – |
| NET CASH FLOW | $M | $379 | ($10) | ($5) | ($3) | ($106) | ($40) | $12 | $20 | $36 | $178 | $139 | $89 | $75 | $6 | ($4) | ($4) | ($5) |
| PROJECT ECONOMICS | As of Q1/2025 | As of Q1/2028 | ||||||||||||||||
| After-tax NPV 5% discounting | $M | $214 | $271 | |||||||||||||||
| Notes to table above: (1) AISC annual calculations include reclamation costs on a cash basis rather than on an accrual basis. As such, the weighted average of the annual AISC amounts will not agree to the life of mine AISC. |
||||||||||||||||||
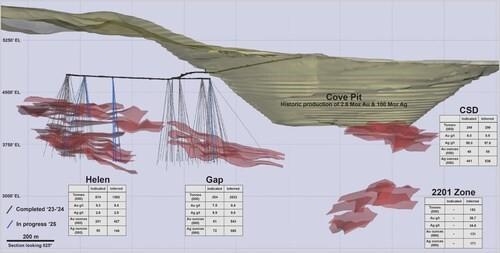
Figure 1: Cove Longitudinal Section of Mineralized Bodies and Drill Holes (Looking Northeast) (CNW Group/i-80 Gold Corp)
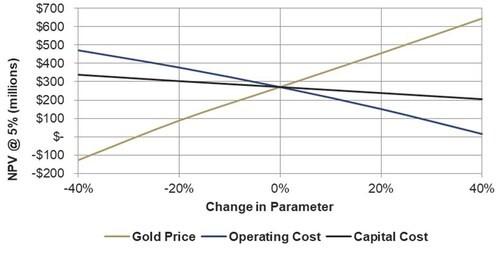
Figure 2: Cove Project Gold Price Sensitivity Cost Analysis (CNW Group/i-80 Gold Corp)
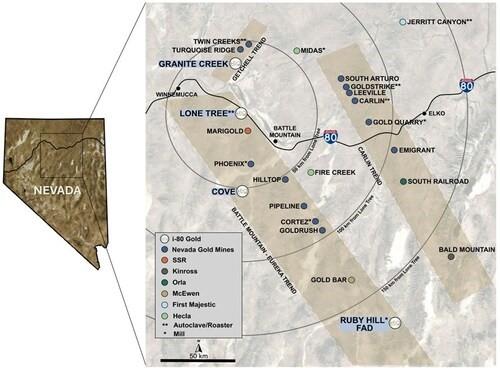
Figure 3: Cove Regional Map (CNW Group/i-80 Gold Corp)
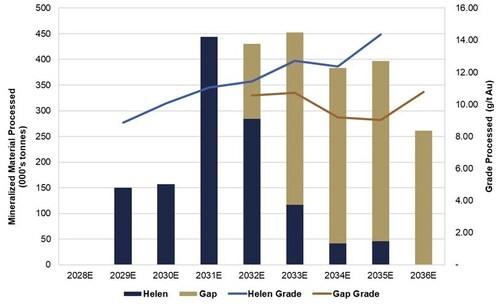
Figure 4: LOM Processing Schedule (CNW Group/i-80 Gold Corp)
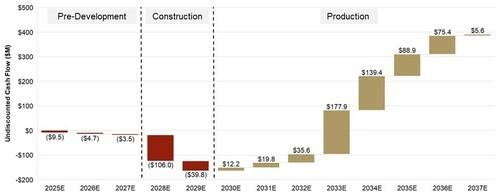
Figure 5: LOM Annual Cash Flow (CNW Group/i-80 Gold Corp)
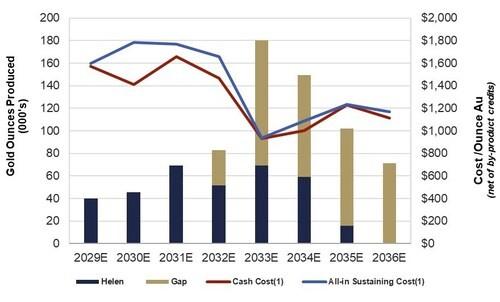
Figure 6: LOM Gold Production Profile vs Cost per Ounce (CNW Group/i-80 Gold Corp)
Cygnus Metals Limited (ASX: CY5) (TSX-V: CYG) (OTCQB: CYGGF) is pleased to announce final in... READ MORE
Scorpio Gold Corp. (TSX-V: SGN) (OTCQB: SRCRF) (FSE: RY9) ... READ MORE
Cassiar Gold Corp. (TSX-V: GLDC) (OTCQX: CGLCF) is pleased to announce that, further to its news rel... READ MORE
Midland Exploration Inc. (TSX-V: MD) is pleased to announce that it has completed a second and fina... READ MORE
Wallbridge Mining Company Limited (TSX: WM) (OTCQB:WLBMF) is pleased to announce that it has closed... READ MORE


