


Gold has reached the first of a handful of measured upside targets at $2350.
It has another measured upside target of $2350 and the cup and handle targets of roughly $3000 and $4000.
Many observers will naturally worry about the next correction after unexpected and sudden strength. It is almost a knee-jerk reaction after many fits and starts in recent years.
A review of history helps us to understand that post-breakout corrections in Gold are usually minor.
Let’s examine how Gold performed and corrected after similar major breakouts to new all-time highs. We use the 50-day, 100-day, and 150-day moving averages as support levels.
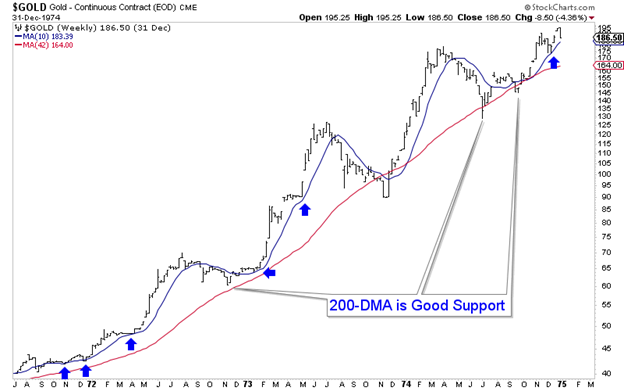
After President Nixon ended the Gold Standard, the price of Gold climbed from $35/oz in 1971 to nearly $200/oz at the end of 1974.
Gold enjoyed three strong legs higher and a fourth that was not as strong—during those three legs higher, Gold never lost its 50-day moving average.
Gold surged from $35 in 1971 to $125 in 1973, with only one 13% decline and single test of the 200-day moving average in between.
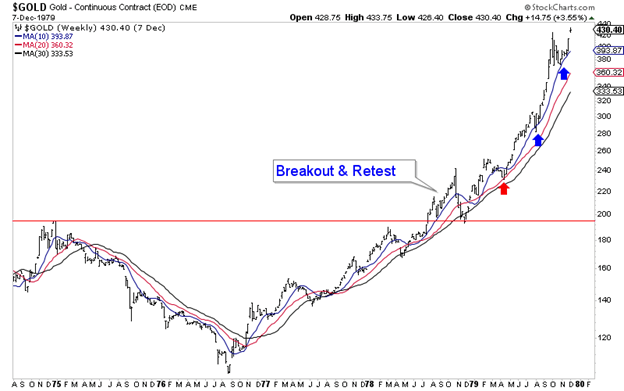
In the second half of 1978, Gold broke out to a new all-time high but quickly retested the breakout successfully.
After the successful retest in 1978, Gold had one pullback to its 100-day moving average in 1979 and remained above its 50-day moving average until its secular peak in January 1980.
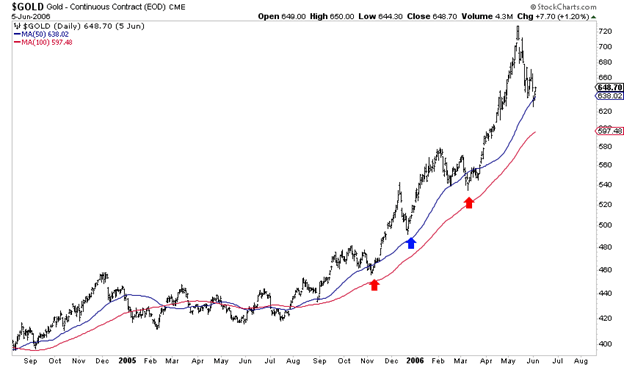
The 2005 breakout was significant because although Gold did not break to a new all-time high, it broke a 23-year sideways range to a slight downtrend. It was the first time Gold had traded at $500 since the early 1980s.
After Gold broke out in September 2005, it carried to above $700 without even testing its 100-day moving average. (The 2007 breakout was similar).
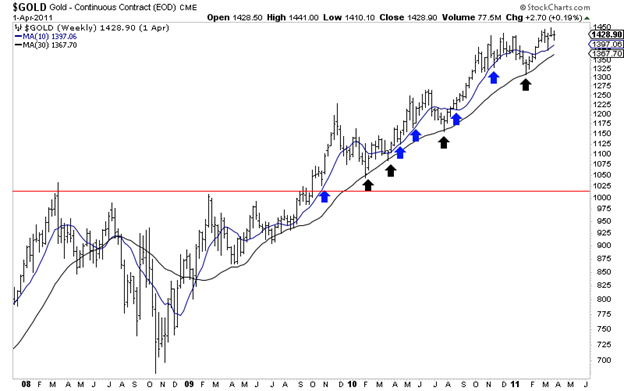
The 2009 breakout to a new all-time high led to a strong but steady advance.
After the initial breakout move, Gold would test its 150-day moving average (black) four times over the next 12 months. Gold had slowed down after gaining 70% over the previous 13 months.
We can draw two conclusions from this analysis of history.
The first is that the corrections are minor unless Gold made a huge move in the previous year.
Gold, before its 20% snapback retest in late 1978, had rebounded 135% in the preceding two years. In 2010, Gold tested the 150-day moving average three different times. Those tests were preceded by a 70% rebound in 13 months.
The second conclusion is that when Gold moves higher impulsively, it tends to hold above its 50-day moving average.
Gold closed Wednesday near $2350. It is only 12% above the major breakout line, so there is no need to worry about a significant correction.
However, Gold is stretched above its 50-day moving average, and Silver now faces stiff resistance at $28-$29. It is reasonable for things to cool down and for Gold to test its 50-day moving average.
Nevertheless, Gold is only weeks past its most significant breakout in 50 years. We should expect gold stocks, especially junior gold stocks and silver stocks, to continue to outperform Gold over the next year or two.
Contango Silver and Gold Inc. (NYSE-A:CTGO) (TSX: CTGO) announced... READ MORE
NevGold Corp. (TSX-V:NAU) (OTCQX:NAUFF) (Frankfurt:5E50) is pleas... READ MORE
Guanajuato Silver Company Ltd. (TSX-V:GSVR) (OTCQX:GSVRF) is plea... READ MORE
Aya Gold & Silver Inc. (TSX: AYA) (NASDAQ: AYA) announced its... READ MORE
Sun Summit Minerals Corp. (TSX-V: SMN) (OTCQB: SMREF) is pleased to anno... READ MORE


