







West Red Lake Gold Mines Ltd. (TSX-V: WRLG) (OTCQB: WRLGF) announces its financial and operating results for the three and six months ended June 30, 2026 from the Madsen Mine located in the Red Lake mining district of Ontario. The Company will hold a webcast on August 26, 2026 to discuss the results. Please refer to the webcast details provided near the end of this release for information on how to attend.
Q2 2026 Highlights
Shane Williams, President and CEO, commented, “Q2 demonstrated the progress we are making at Madsen, with higher mining rates and gold production translating into stronger financial performance. Gold production increased 51% and gold sales increased 34% over Q1, contributing to a 30% reduction in AISC to US$3,284 per ounce, within our 2026 guidance range, while Madsen generated $9.7 million of positive free cash flow.”
“Our focus for the balance of 2026 is on consistent execution while continuing to invest in underground development and infrastructure to build production inventory and greater operating flexibility. These investments are important to strengthening the operation over the longer term, and the progress achieved during our first six months of commercial production has provided a stronger foundation from which to continue advancing Madsen.”
Financial key results for three months ended June 30, 2026
(expressed in thousands of Canadian dollars, unless otherwise stated)
| Operating Statistics | Units | For the three months ended, March 31, 2026 |
For the three months ended, June 30, 2026 |
% Change | For the six months ended, June 30, 2026 |
||||
| Gold produced | ounces | 5,667 | 8,576 | 51 | % | 14,243 | |||
| Gold sold | ounces | 6,165 | 8,260 | 34 | % | 14,425 | |||
| Average realized gold price(1) | US$ per ounce | 4,938 | 4,288 | (13 | %) | 4,567 | |||
|
Financial Information |
|||||||||
| Gold revenue | $ | 41,755 | 49,035 | 17 | % | 90,790 | |||
| Income from mining operations | $ | 15,289 | 20,083 | 31 | % | 35,372 | |||
| Operating margin | % | 37 | % | 41 | % | 11 | % | 39 | % |
| Adjusted EBITDA(2) | $ | 14,398 | 22,106 | 54 | % | 36,504 | |||
| Adjusted net earnings(2) | $ | 6,376 | 12,632 | 98 | % | 19,008 | |||
| Adjusted earnings per share – basic(2) | $ | 0.02 | 0.03 | 50 | % | 0.05 | |||
| Sustaining capital(2) | $ | 15,365 | 12,265 | (20 | %) | 27,630 | |||
| All in sustaining costs | $ | 39,563 | 37,549 | (5 | %) | 77,112 | |||
| Cash cost per gold ounce(1)(2) | US$ per ounce | 2,594 | 2,000 | (23 | %) | 2,254 | |||
| AISC per gold ounce(1)(2) | US$ per ounce | 4,678 | 3,284 | (30 | %) | 3,879 | |||
| Free cash flow | $ | (6,140 | ) | 9,664 | 257 | % | 3,524 | ||
| Cash and cash equivalents | $ | 35,917 | 31,214 | (13 | %) | 31,214 | |||
(1) Foreign exchange rate of CAD$/USD$ 1.3843 Q2 and CAD$/USD$ 1.3781 Year to Date
(2) Refer to Non-IFRS Measures
Financial Results
Financial performance strengthened during Q2 as higher gold production and sales contributed to improved margins, lower unit costs and positive free cash flow as operating and sustaining costs were allocated across a greater number of ounces sold. Cash costs decreased 23% to US$2,000 per ounce sold, while AISC decreased 30% to US$3,284 per ounce sold, within the Company’s 2026 guidance range.
Gold sold increased 34% to 8,260 ounces, generating revenue of approximately $49.0 million, a 17% increase from Q1. Income from mining operations increased 31% to $20.1 million, with operating margin improving to 41% from 37% in Q1.
Adjusted EBITDA increased 54% to $22.1 million, compared with $14.4 million in Q1, while adjusted net earnings increased 98% to $12.6 million, or $0.03 per basic share, compared with $6.4 million, or $0.02 per basic share, in Q1.
Non sustaining growth capital expenditures totaled $6,322 in Q2 primarily related to the continued advancement of the Fork Deposit access drift and the Madsen shaft refurbishment project, positioning the Company to access additional mining areas while supporting future production growth, increased hauling capacity and improved operating flexibility.
The Company generated $9.7 million of positive free cash flow during Q2 while continuing to invest in underground development and infrastructure. The Company ended the quarter with approximately $31.2 million in cash and cash equivalents.
Operating Results
Operating performance improved during Q2 as additional mining areas became available and mine sequencing continued to advance (see news release dated July 15, 2026).
The Company mined 75,524 tonnes during Q2, a 46% increase from Q1, while average mined grade increased 18% to 4.3 g/t Au. Together, these improvements resulted in 10,459 mined ounces, a 73% increase from Q1. Gold production increased 51% to 8,576 ounces, while average mill throughput increased 47% to approximately 842 tpd. Gold recovery remained approximately 95%. Over the second half of 2026, processing rates expected to increase to approximately 1,000 tpd.
Higher mining rates relative to mill throughput allowed the Company to establish a surface stockpile during the quarter. At June 30, 2026, the stockpile contained approximately 10,768 tonnes of ore. The stockpile provides additional flexibility between underground mining and mill processing.
Qualified Persons
The technical information presented in this news release has been reviewed and approved by Will Robinson, P.Geo., Vice President of Exploration for West Red Lake Gold and the Qualified Person for exploration at the West Red Lake Project, and by Hayley Halsall-Whitney, P.Eng., Vice President of Operations for West Red Lake Gold and the Qualified Person for technical services at the West Red Lake Project, as defined by National Instrument 43-101 – Standards of Disclosure for Mineral Projects.
About West Red Lake Gold Mines
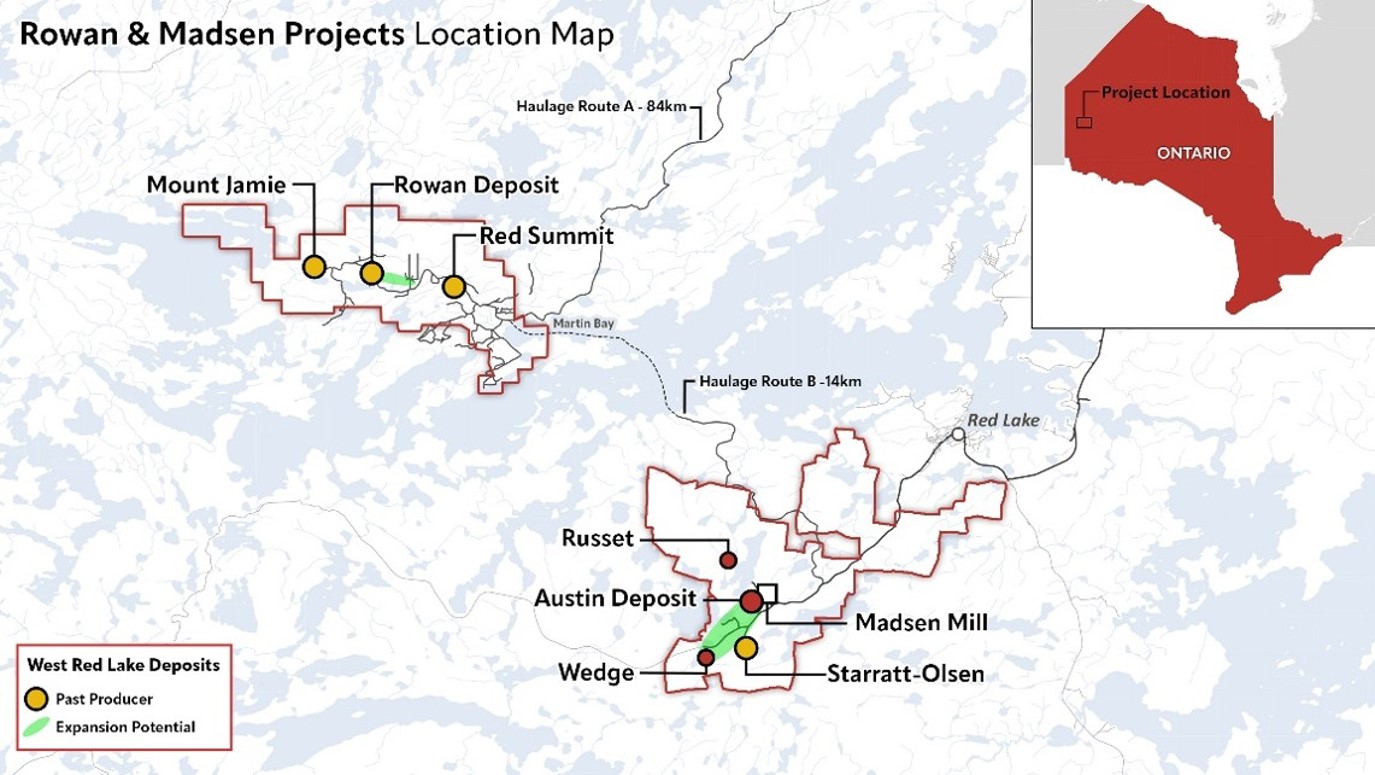
West Red Lake Gold Mines Ltd. is a Canadian gold producer and developer advancing a high-grade, district scale opportunity in the Red Lake district of Ontario. The Company’s flagship Madsen Mine has recently achieved commercial production and is positioned as the central hub of a growing multi asset platform. The Company controls a 47 km² land package in one of the world’s most prolific mining districts, which has historically produced over 20 million ounces of gold from high grade systems1. West Red Lake also owns the Rowan Property in Red Lake, covering 31 km² that includes three past producing mines (Rowan, Mount Jamie and Red Summit) and represents a key source of future production growth.
________________________________
1 Twomey, T. and McGibbon, S. Red Lake Mine, Goldcorp Inc. (2022). “The Geological Setting and Estimation of Gold Grade of the High-Grade Zone, Red Lake Mine.” Exploration Mining Geology, Vol. 10, Nos. 1–2, pp. 19–34. Canadian Institute of Mining, Metallurgy and Petroleum (“CIM”).
Brutus Mining Inc. (CSE: BRU) (FSE: ZI3) is pleased to announce that it has closed its non-brokered ... READ MORE
Jaguar Uranium Corp. (NYSE American: JAGU) is pleased to announce an independent Mineral Resource E... READ MORE
Auro Metals Inc. (TSX-V: AURO) (OTCQB: AURFF), is pleased to announce the assay results of the fina... READ MORE
Endeavour Silver Corp. (NYSE: EXK) (TSX: EDR) is pleased to announce that repairs to the primary bal... READ MORE
Scorpio Gold Corp. (NASDAQ: SGLD) (TSX-V: SGLD) (OTCQB: SRCRF) (FSE: RY9) is pleased to announce re... READ MORE


