







Record Throughput and Plant Expansion Drive Strong Performance and the Next Phase of Growth
TRX Gold Corporation (TSX: TRX) (NYSE American: TRX) reported its results for the third quarter of 2026 for the three and nine months ended May 31, 2026. Financial results are available on the Company’s website at www.TRXgold.com. Unless otherwise noted, all references to currency in this press release refer to US dollars.
TRX Gold’s CEO, Stephen Mullowney commented: “Our Q3 2026 results demonstrate that our investments in plant optimization are delivering measurable improvements and further reinforce the strength and scalability of our asset. Over the last twelve months (“LTM”) we have generated $115.5 million in revenues, adjusted EBITDA1 of $66.8 million and operating cash flow of $28.9 million – in Q3 alone we achieved adjusted EBITDA1 of $20.7 million. Over the same LTM time period we have made $46.4 million in investments at Buckreef Gold, including $27.1 million in capital assets and $19.3 million in working capital. With a current adjusted EBITDA run rate higher than the LTM period, cash on hand of $26.8 million, working capital investment having already been made, significant undrawn credit lines, and essentially being debt free, we are currently well positioned to fund our capital program over time. Our accelerated plant expansion is laying the foundation for the next stage of growth, which will include both a 3,500 tpd SAG mill circuit and significant upgrades to our existing 2,000 tpd plant – with a combined processing capacity which is well beyond the 3,000 tpd plant capacity as outlined in our PEA last year, unlocking significant value. As an added bonus, we have already achieved our full year guidance as of today, having produced over 25,000 ounces of gold fiscal year to date.”
Key highlights for Q3 2026 and Year to Date in 2026 include:
Selected Operating and Financial Data
Select operating and financial information from the operation for the three and nine months ended May 31, 2026, follows below:
|
Select Operating and Financial Data |
||||||||||||
| Unit | Three months ended May 31, 2026 |
Three months ended May 31, 2025 |
Nine months ended May 31, 2026 |
Nine months ended May 31, 2025 |
||||||||
| Operating Data | ||||||||||||
| Ore Mined | k tonnes | 183 | 147 | 551 | 364 | |||||||
| Waste Mined | k tonnes | 2,272 | 1,195 | 5,429 | 2,937 | |||||||
| Total Mined | k tonnes | 2,455 | 1,342 | 5,979 | 3,301 | |||||||
| Strip Ratio | w:o | 12.4 | 8.1 | 9.9 | 8.1 | |||||||
| Mining Rate | tpd | 26,681 | 14,588 | 21,903 | 12,091 | |||||||
| Mining Cost | US$/t | $ | 3.02 | $ | 3.63 | $ | 3.93 | $ | 3.82 | |||
| Plant Ore Milled | k tonnes | 155 | 134 | 436 | 402 | |||||||
| Head Grade | g/t | 1.96 | 1.72 | 1.93 | 1.38 | |||||||
| Plant Utilization | % | 93 | 91 | 91 | 87 | |||||||
| Plant Recovery Rate | % | 84.9 | 67 | 81.4 | 71 | |||||||
| Processing Cost | US$/t | $ | 25.66 | $ | 14.60 | $ | 23.86 | $ | 14.20 | |||
| Plant Mill Throughput | tpd | 1,690 | 1,461 | 1,597 | 1,474 | |||||||
| Gold Ounces Poured | oz | 7,426 | 4,687 | 21,476 | 12,532 | |||||||
| Gold Ounces Sold | oz | 6,983 | 3,995 | 20,789 | 12,236 | |||||||
| Financial Data | ||||||||||||
| Revenue1 | $ (‘000s) | 32,848 | 12,474 | 92,037 | 34,109 | |||||||
| Gross profit | $ (‘000s) | 19,449 | 4,383 | 54,716 | 11,361 | |||||||
| Net income (loss) | $ (‘000s) | 8,371 | 1,105 | (5,902 | ) | 1,301 | ||||||
| Adjusted net income2 | $ (‘000s) | 10,077 | 1,989 | 29,464 | 3,750 | |||||||
| Adjusted EBITDA2 | $ (‘000s) | 20,680 | 3,979 | 54,136 | 9,338 | |||||||
| Operating cash flow | $ (‘000s) | 8,758 | 1,870 | 20,493 | 6,148 | |||||||
| Working capital5 | $ (‘000s) | 36,304 | (3,274 | ) | 36,304 | (3,274 | ) | |||||
| Average realized price (gross)2 | $/oz | 4,704 | 3,122 | 4,427 | 2,788 | |||||||
| Average realized price (net)2,3,4 | $/oz | 4,703 | 3,114 | 4,423 | 2,829 | |||||||
| Cash cost2 | $/oz | 1,648 | 1,819 | 1,555 | 1,635 | |||||||
| 1Revenue includes immaterial amounts from the sale of by-product silver. | ||||||||||||
| 2Refer to the “Non-IFRS Performance Measures” section. | ||||||||||||
| 3Net of revenue and ounces of gold sold related to OCIM gold prepaid purchase agreement. | ||||||||||||
| 4Net of interest related to Auramet gold prepaid purchase agreement. | ||||||||||||
| 5Working capital for the three and nine months ended May 31, 2025 are adjusted for derivative liabilities which will only be settled by issuing equity of the Company and for the current portion of deferred revenue (non-cash) related to the Auramet prepaid gold purchase agreement. During Q2 2026, all outstanding warrants of the Company were either exercised or expired. In Q2 2026, the Company received total gross proceeds of approximately $21.0 million from the exercise of warrants. The Company now has a clean capital structure with no remaining warrants outstanding. | ||||||||||||
Figure 1: Buckreef Gold Open Pit Main Zone Aerial View
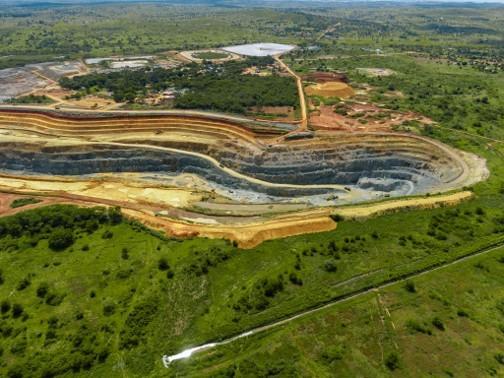
Figure 2: Buckreef Gold Mining Fleet
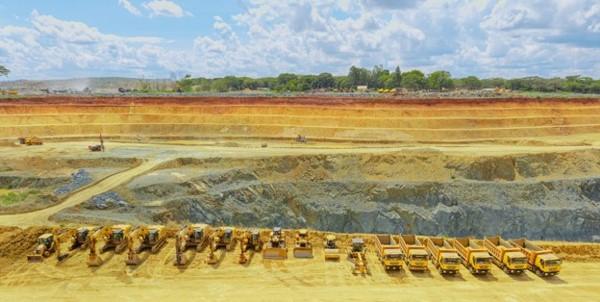
Figure 3: Buckreef Gold’s Ball Milling Circuit
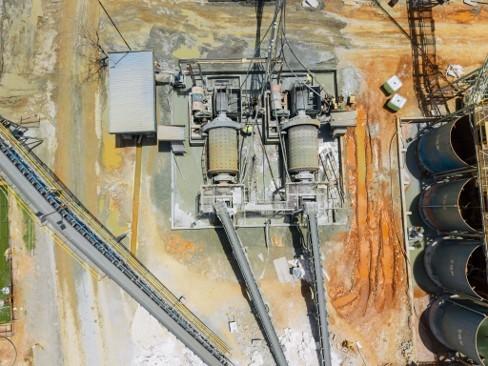
Figure 4: Installation of Oxygen Plant to Improve Slurry Oxidation
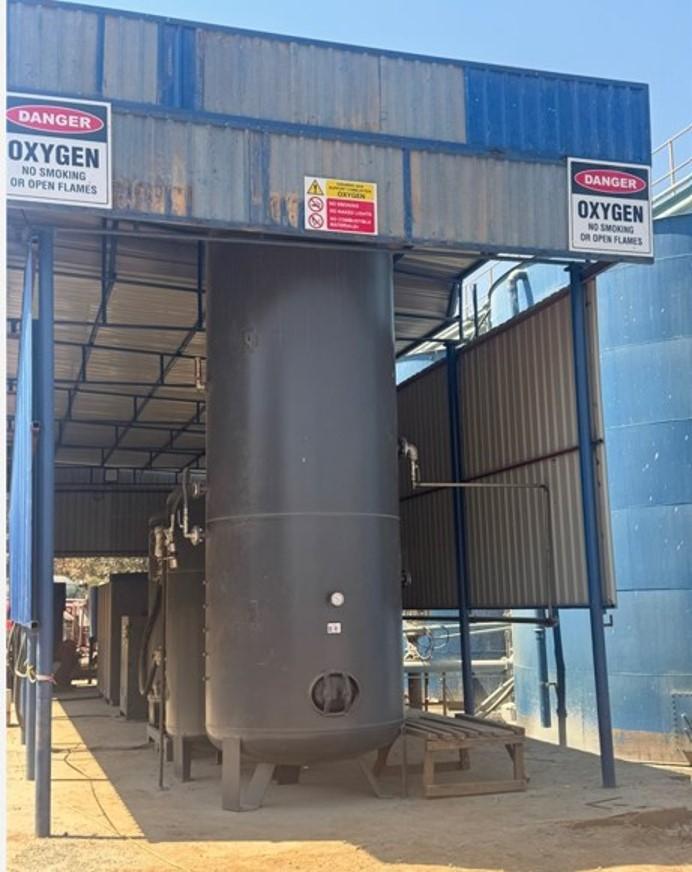
Figure 5: Installation of Pre-Leach Thickener
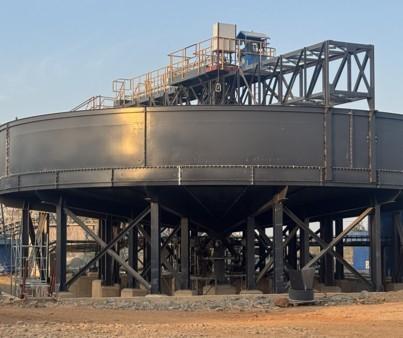
Figure 6: Aachen ® Reactor Installed and Commissioned to Improve Processing Efficiency
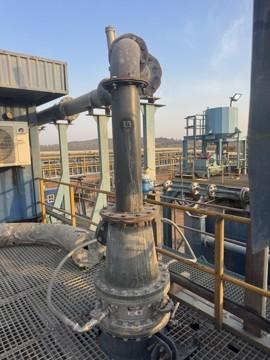
Figure 7: Buckreef Gold Inventory Stockpile
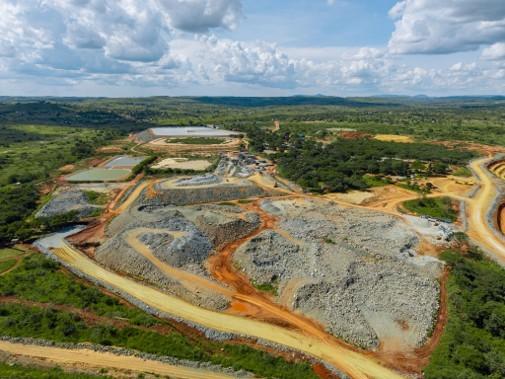
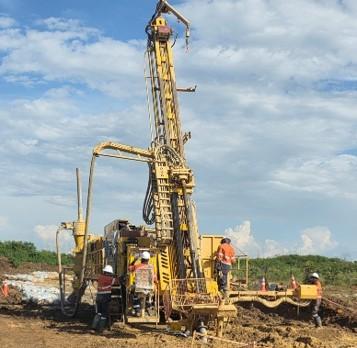
Figure 8: Reverse Circulation Drilling at Eastern Porphyry
About TRX Gold Corporation
TRX Gold is a high margin and growing gold company advancing the Buckreef Gold Project in Tanzania. Buckreef Gold includes an established open pit operation and 2,000 tonnes per day process plant with upside potential demonstrated in the May 2025 Preliminary Economic Assessment. The PEA outlines average gold production of 62,000 oz per annum over 17.6 years at 3,000 tonnes per day of throughput capacity, and a US$1.9 –US$2.6 billion pre-tax NPV5% at average life of mine gold prices of US$4,000-US$5,000/oz2. The Buckreef Gold Project hosts a Measured and Indicated Mineral Resource of 10.8 million tonnes at 2.57 grams per tonne (“g/t”) gold containing 893,000 ounces of gold and an Inferred Mineral Resource of 9.1 MT at 2.47 g/t gold for 726,000 oz of gold. The leadership team is focused on creating both near-term and long-term shareholder value by increasing gold production to generate positive cash flow to fund the expansion as outlined in the PEA, grow Mineral Resources through exploration, and update the PEA with a larger capacity beyond 3,000 tpd. TRX Gold’s actions are led by the highest environmental, social and corporate governance (“ESG”) standards, evidenced by the relationships and programs that the Company has developed during its nearly two decades of presence in the Geita Region, Tanzania.
Qualified Person
Mr. Richard Boffey, BE Mining (Hons) F AusIMM, Chief Operating Officer of TRX Gold Corporation, is the Company’s in-house Qualified Person under National Instrument 43-101 “Standards of Disclosure for Mineral Projects” and has reviewed and assumes responsibility for the scientific and technical content in this press release.
Brutus Mining Inc. (CSE: BRU) (FSE: ZI3) is pleased to announce that it has closed its non-brokered ... READ MORE
Jaguar Uranium Corp. (NYSE American: JAGU) is pleased to announce an independent Mineral Resource E... READ MORE
Auro Metals Inc. (TSX-V: AURO) (OTCQB: AURFF), is pleased to announce the assay results of the fina... READ MORE
Endeavour Silver Corp. (NYSE: EXK) (TSX: EDR) is pleased to announce that repairs to the primary bal... READ MORE
Scorpio Gold Corp. (NASDAQ: SGLD) (TSX-V: SGLD) (OTCQB: SRCRF) (FSE: RY9) is pleased to announce re... READ MORE


