








Thunder Gold Corp. (TSX-V: TGOL) (FSE: Z25) (OTCQB: TGOLF) is pleased to announce the following infill diamond drill results from the Bench Target, at the Company’s flagship Tower Mountain Property, 40 kilometres west of Thunder Bay, Ontario.
Highlights:
TM25-188X (13.5 metres averaging 0.755 g/t Au) and TM26-219 (6.0 metres averaging 0.637 g/t Au) were exploration holes targeting the interpreted northern contact of the Bench-3738-Ellen (“B-E“) trend (Reference Table 1.0, Figure 1.0 and Figure 2.0).
TM26-223 (290.1 metres averaging 0.527 g/t Au) tested the current, interpreted southeast limit of the B-E trend (Reference Table 1.0, Figure 1.0 and Figure 3.0). The hole is located approximately 50 metres below hole TM04-031 (250.5 metres averaging 0.567 g/t Au) and 150 metres above hole TM26-214 (111.0 metres averaging 0.514 g/t Au).
Wes Hanson, President and CEO states, “Our Infill drilling continues to return long, continuously mineralized intervals within the currently defined Inferred Resource component of the 2026 Mineral Resource Estimate. Both TM25-188X and TM26-223 correlate well with the MRE model and both holes support our interpretation of sub-vertical continuity of the 700-metre-long x 200-metre-wide B-E trend which we have successfully extended to a depth of 500 metres from surface. Since mid-August, we have delivered a total of 3.9 kilometres of semi-continuous gold mineralization, averaging 0.467 g/t Au, from the thirteen (13) holes completed to date. Our ongoing, fully funded, infill drill program remains on track to increase that total before the Christmas break. Average drilled grade of the thirteen (13) holes continues to demonstrate positive variance relative to the model predicted grade estimated by the 2026 MRE.”
“Twelve of thirteen holes reported to date include continuously mineralized intervals at a 0.40 g/t cut-off grade, ranging in drilled length from 13.5 metres to 228.5 metres with length-weight averaged grades ranging from 0.503 g/t Au to 2.237 g/t Au (Reference Table 3.0). This population, collectively, totals 1.2 kilometres of mineralization at a cut-off grade of 0.40 g/t Au.”
Table 1.0 provides the location and orientation of holes TM25-188/188X, TM26-219 and TM26-223.
Figure 1.0 is a plan view showing the location of the drill holes reported in this news release.
Table 2.0 summarizes the highlights of the three holes that are the subject of this news release.
Table 1.0 – B-E Target – Drill Hole Location Bearing and Dip
| Hole ID | Easting | Northing | Elevation | Bearing | Dip | TD |
| TM25-188 | 300442 | 5377598 | 453.5 | 41.5 | -55.4 | 276 |
| TM25-188X | 300553 | 5377716 | 208.006 | 46.33 | -53.8 | 201 |
| TM26-219 | 300550 | 5377693 | 426 | 40 | -54.7 | 252 |
| TM26-223 | 300891 | 5377410 | 497 | 40 | -54.9 | 402 |
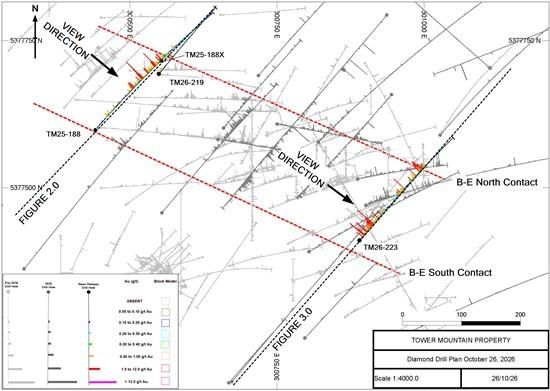
Figure 1.0 Bench Target Diamond Drill Plan – October 26, 2026
TM25-188/188X
TM25-188X (Figures 1.0 and 2.0) confirmed the location of the interpreted northern contact of the B-E trend, collaring in mineralization at the end of hole TM25-188 and extending the mineralization an additional 63.0 metres averaging 0.371 g/t Au. The remainder of the hole returned gold grades below the current cut-off grade used to report mineral resources (0.190 g/t Au) to the end-of-hole with scattered results greater than 0.19 g/t Au included in the reported intervals provided in Table 2.0.
Collectively, TM25-188/188X intersected semi-continuous gold mineralization over a combined interval of 336.0 metres averaging 0.407 g/t Au from the drill hole collar to the northern B-E contact. Gold mineralization is disrupted by two, late, barren dikes totaling 52.5 metres with the remainder of the interval returning gold values ranging from 0.10 g/t Au to a maximum of 8.32 g/t Au.
The average grade of TM25-188X compares favourably to the grade predicted by the Jan. 19, 2026, MRE model, demonstrating a positive variance for the 201.0 metres drilled (Reference Figure 4.0).
Table 2.0 – TM25-188/188X, TM26-219 and TM26-223 Significant Results
| Hole ID | From (m) |
To (m) |
Length (m) |
Grade (Au g/t) |
True Width (m) |
| TM25-188 | 3.0 | 339.0 | 336.0 | 0.407 | 184.8 |
| includes | 3.0 | 51.0 | 48.0 | 0.100 | 26.4 |
| and | 51.0 | 67.5 | 16.5 | 0.429 | 9.1 |
| and | 67.5 | 82.5 | 15.0 | 0.119 | 8.3 |
| and | 82.5 | 109.5 | 27.0 | 0.266 | 14.9 |
| and | 109.5 | 148.5 | 39.0 | 0.094 | 21.5 |
| and | 148.5 | 208.5 | 60.0 | 0.822 | 33.0 |
| and | 208.5 | 222.0 | 13.5 | 0.038 | 7.4 |
| and | 222.0 | 339.0 | 117.0 | 0.532 | 64.4 |
| includes | 222.0 | 276.0 | 54.0 | 0.720 | 29.7 |
| and TM25-188X | 276.0 | 339.0 | 63.0 | 0.371 | 34.7 |
| includes | 276.0 | 289.5 | 13.5 | 0.755 | 7.4 |
| and | 289.5 | 339.0 | 49.5 | 0.267 | 27.2 |
| and | 339.0 | 399.0 | 60.0 | 0.123 | Unknown |
| and | 399.0 | 439.5 | 40.5 | 0.035 | Unknown |
| and | 439.5 | 477.0 | 37.5 | 0.134 | Unknown |
| TM26-219 | 0.0 | 15.0 | 15.0 | 0.069 | Unknown |
| and | 15.0 | 19.5 | 4.5 | 0.431 | Unknown |
| and | 19.5 | 58.5 | 39.0 | 0.048 | Unknown |
| and | 58.5 | 64.5 | 6.0 | 0.637 | Unknown |
| and | 64.5 | 84.0 | 19.5 | 0.088 | Unknown |
| and | 84.0 | 90.0 | 6.0 | 0.298 | Unknown |
| and | 90.0 | 117.0 | 27.0 | 0.107 | Unknown |
| and | 117.0 | 129.0 | 12.0 | 0.211 | Unknown |
| and | 129.0 | 252.0 | 123.0 | 0.043 | Unknown |
| TM26-223 | 3.9 | 294.0 | 290.1 | 0.527 | 159.7 |
| includes | 3.9 | 10.5 | 6.6 | 0.111 | 3.6 |
| and | 10.5 | 67.5 | 57.0 | 1.071 | 31.4 |
| and | 67.5 | 126.0 | 58.5 | 0.396 | 32.2 |
| and | 126.0 | 177.0 | 51.0 | 0.089 | 28.1 |
| and | 177.0 | 205.5 | 28.5 | 0.643 | 15.7 |
| and | 205.5 | 225.0 | 19.5 | 0.151 | 10.7 |
| and | 225.0 | 256.5 | 31.5 | 0.499 | 17.3 |
| and | 256.5 | 267.0 | 10.5 | 0.119 | 5.8 |
| and | 267.0 | 294.0 | 27.0 | 0.923 | 14.9 |
| and | 294.0 | 402.0 | 108.0 | 0.077 | Unknown |
True width is estimated where sufficient data allows. Where True Width is not estimated it is due to insufficient data.
TM26-219
TM26-219 was drilled to clarify the limit of the northern B-E contact near surface. TM26-219 intersected semi-continuous gold values from the collar to the end-of hole with scattered intervals greater than the 0.190 g/t Au cut-off grade over intervals of up to 6.0 metres in length. The average grade of TM26-219 compares unfavourably to the model predicted grade (Reference Figure 4.0).
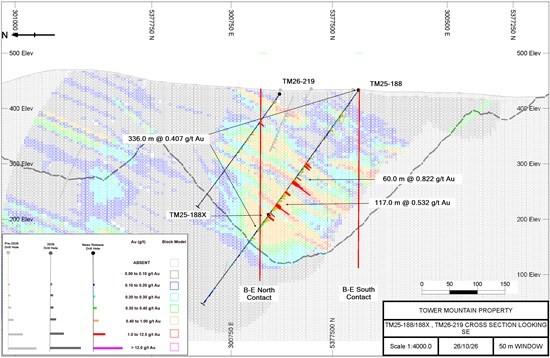
Figure 2.0 – Cross Section TM25-188/188X and TM26-219
TM26-223
TM26-223 was collared north of the current interpreted northern contact of the B-E trend (Reference Figures 1.0 and 3.0). This hole collared and remained in semi-continuous to continuous gold mineralization for a down-hole length of 290.1 metres averaging 0.527 g/t Au (Reference Table 2.0), with intervals of 57.0 metres averaging 1.071 g/t Au (starting at 10.5 metres), 28.5 metres averaging 0.643 g/t Au and 27.0 metres averaging 0.923 g/t Au. The estimated true width of the intercept is 159.7 metres. TM26-223 bisects a large block of inferred resources previously defined by holes TM04-031 (250.5 metres averaging 0.567 g/t Au) and TM26-214 (111.0 metres averaging 0.514 g/t Au).
The southern B-E contact was intersected where anticipated (Reference Figure 3.0) and the comparison between model predicted grade to the actual drill intersected grade for the entire hole is favourable with actual grade slightly higher than modeled grade (Reference Figure 4.0).
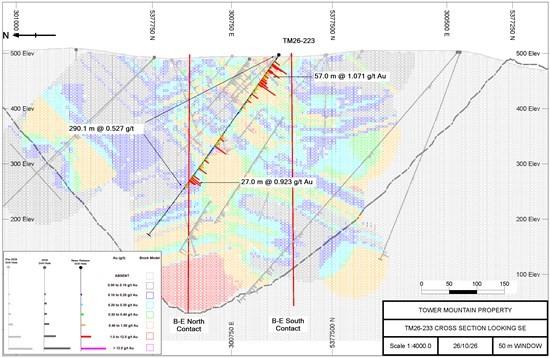
Figure 3.0 – Cross Section TM26-223
Summary of Infill Drill Program
Since August 11, 2026, we have released results for thirteen (13) infill drill holes totalling 5,798.8 metres, all of which targeted Inferred resources within the B-E trend. These holes have all intersected continuous to semi-continuous gold grades from surface to the current maximum drill depth, approximately 600 metres vertically from surface.
More than 56% of the results received to date have returned gold grades greater than 0.10 g/t Au. This is 5% higher than the historical drill data for the project (1988 to 2025).
Approximately 22% of the results to date have returned gold grades greater than 0.40 g/t Au. This is almost double the population defined by the historical drill data (1988 to 2025).
Table 3.0 summarizes the intervals greater than 0.40 g/t Au intersected to date during the 2026 infill drill campaign.
Table 3.0 – Infill Drilling – Project to Date – Intervals Greater Than a 0.40 g/t Au Cut-off Grade
| Hole ID | From (metres) |
To (metres) |
Interval (metres) |
Au (g/t) |
| TM26-210 | 196.50 | 211.50 | 15.00 | 1.650 |
| 430.50 | 448.50 | 18.00 | 2.327 | |
| 504.00 | 517.50 | 13.50 | 1.070 | |
| 525.00 | 552.00 | 27.00 | 1.117 | |
| 619.50 | 678.00 | 58.50 | 1.397 | |
| TM21-107X | 209.50 | 438.00 | 228.50 | 0.557 |
| TM23-137X | 447.00 | 469.50 | 22.50 | 0.602 |
| 486.00 | 522.00 | 36.00 | 0.670 | |
| 675.00 | 702.00 | 27.00 | 0.830 | |
| TM26-205 | 6.00 | 60.00 | 54.00 | 1.088 |
| 555.00 | 568.50 | 13.50 | 1.283 | |
| TM26-214 | 319.50 | 430.50 | 111.00 | 0.514 |
| TM26-217 | 385.50 | 418.50 | 33.00 | 1.383 |
| 463.50 | 517.50 | 54.00 | 0.530 | |
| TM26-218 | 258.00 | 399.00 | 141.00 | 0.503 |
| TM25-186X | 435.00 | 468.00 | 33.00 | 0.785 |
| 481.50 | 501.00 | 19.50 | 0.523 | |
| TM26-220 | 31.50 | 106.50 | 75.00 | 0.551 |
| TM26-221 | 198.00 | 357.00 | 159.00 | 0.894 |
| 438.00 | 450.00 | 12.00 | 0.785 | |
| TM26-223 | 10.50 | 67.50 | 57.00 | 1.071 |
| 177.00 | 205.50 | 28.50 | 0.643 | |
| 267.00 | 294.00 | 27.00 | 0.923 | |
| TM25-188X | 276.00 | 289.50 | 13.50 | 0.755 |
MRE Reconciliation
Reconciliation of drill results to date for the Bench Target relative to the 2026 MRE model suggest an overall grade increase relative to model-predicted grades. Figure 4.0 presents a summary of model-predicted grades compared to actual drilled grade for the thirteen (13) infill holes completed to date. All thirteen holes post-date the 2026 MRE model and therefore can be compared directly to model-predicted grades to measure the predictive accuracy of the model.
The results indicate significant variation on a hole-by-hole basis, ranging from a low of -73% (TM26-219) to a high of 100% (TM26-210). This is typical and within expected tolerances. On a length-weighted average basis, the comparison suggests that actual drilled grade of all ten holes is ~5% higher than the predicted modeled grade.
Similar results are observed for the project to date in exploration drill holes completed at the UV Target and the holes drilled along the eastern margin of the 2026 MRE optimized pit limit, targeting the large un-estimated portion of the model (Reference Figure 5.0). The exploration data set also suggests that drilled grades are returning higher values than what is currently predicted by the 2026 MRE.
Both analyses exclude mineralization intersected outside the 2026 MRE model limit, specifically, the high-grade results intersected in holes TM26-210 and TM23-137X that extend beyond the base of the 2026 MRE model.
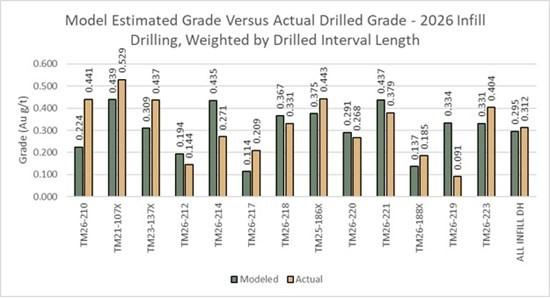
Figure 4.0 – Modelled Grade Versus Drilled Grade, Infill Drilling, 2026; Weighted by Interval Length
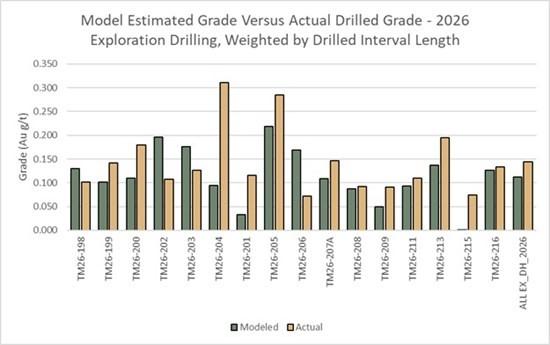
Figure 5.0 – Modelled Grade Versus Drilled Grade, Exploration Drilling, 2026; Weighted by Interval Length
Quality Assurance and Quality Control
Diamond drilling utilizes NQ diameter tooling. The core is received at the on-site logging facility where it is photographed, logged for geotechnical, physical properties and geological data. Samples are identified, recorded, and cut in half by wet diamond saw. Half the core is sent for assay at an accredited laboratory with the remaining half core stored on site. A standard sample length of 1.5 meters is typically employed, varying only at major lithological contacts.
Certified standards and blanks are randomly inserted into the sample stream and constitute approximately 10% of the sample stream. Certified standards and blank performance is monitored with any failures evaluated and investigated to determine if said failure is a result of error during submission. Any unexplained failures are identified and the five samples preceding and following the failure are re-assayed. Commencing in 2026, duplicate pulps are prepared at a rate of 1 in every 20 samples. The duplicate pulps are sent to a second independent analytical facility for analyses.
Activation Laboratories Ltd., Thunder Bay, Ontario, ISO/IEC 17025:2017 is the primary independent analytical service provider.
AGAT Laboratories, Thunder Bay, Ontario, ISO/IEC 17025:2017 is the secondary, independent analytical facility.
Samples are, received, dried, crushed to 80% passing 2.0 mm. A 250-gram sample is split and pulverized. Samples are analyzed for gold using a 30-gram lead collection fire assay fusion (FA) with an atomic absorption (AAS) finish. All assay results greater than 5.0 g/t Au are re-assayed using a gravimetric analysis. All assays greater than 30.0 g/t Au are re-assayed using screen metallics where a representative 1000-gram sample is split sieved at 149µm. Assays are performed on the entire +149 µm fraction and two splits of the -149 µm fraction. A final assay is calculated based on the weight of each size fraction.
Qualified Person
Technical information in this news release has been reviewed and approved by Wes Hanson, P.Geo., President and CEO of Thunder Gold Corp., who is a Qualified Person under the definitions established by NI 43-101.
About the Tower Mountain Gold Property
The 7,625-hectare, 100%-owned Tower Mountain Property is beside the Trans-Canada highway, 40-km west of Thunder Bay, Ontario (pop. 120,000). Gold mineralization occurs in variably brecciated and altered rocks surrounding the calc-alkalic Tower Mountain Intrusive Complex. Drilling to date has established an initial mineral resource parallel to the western contact of the intrusion representing approximately 25% of the TMIC halo.
The MRE has an effective date of January 19, 2026. A Technical Report titled “NI 43-101 Technical Report for the 2026 Mineral Resource Estimate on the Tower Mountain Project, Ontario, Canada.” is available on the Company’s website at www.thundergoldcorp.com and on SEDAR+ (www.sedarplus.ca) under the Company’s Issuer profile.
The Report was prepared by Charley Murahwi, P.Geo., FAusIMM.; William Lewis, P.Geo., Tudorel Ciuculescu, P.Geo., and Richard Gowans, P.Eng., all of Micon International Limited, Toronto, Ontario, Canada. The Report was prepared in accordance with National Instrument 43-101 Standards of Disclosure for Mineral Projects and CIM Definition Standards of Mineral Resources and Mineral Reserves.
The MRE is summarized as follows:
Tower Mountain Mineral Resource Estimate – January 19, 2026
| Category | Tonnage (Mt) |
Grade (g/t Au) |
Contained Metal (‘000 oz gold) |
| Indicated | 34.5 | 0.46 | 514 |
| Inferred | 211.1 | 0.45 | 3,053 |
Notes:
The remaining 75% of the TMIC halo demonstrates similar geology, alteration, and geophysical signatures and is untested by drilling.
A second gold trend, identified in 2026, outcrops at surface and is continuously mineralized over a 100-metre width. This gold mineralization occurs within Timiskaming-type conglomerates that have been traced for over 5.0 kilometres along a southwest trend paralleling the Thunder Lake Fault. The Company believes both targets offer opportunities to materially increase the total resource through systematic drilling.
About Thunder Gold Corp.
Thunder Gold is advancing the Tower Mountain project in Thunder Bay, Ont. — an emerging gold system with the scale, consistency and quality to support a long-life, open-pit operation. Results from the disciplined drill programs have consistently reinforced confidence in the continuity and predictability of the discovery while highlighting significant potential for expansion across multiple zones of the Tower Mountain intrusive complex. With industry-leading drilling costs, existing infrastructure and a skilled local work force, Tower Mountain represents a rare combination of size, scalability and cost-effective growth.
At Thunder Gold, our vision is clear: to unlock a discovery that has the potential to become a transformational gold project, delivering long-term value for shareholders while contributing to the future of Canada’s mining industry.
Blue Star Gold Corp. (TSX-V: BAU) (OTCQB: BAUFF) (FSE: 5WP0) anno... READ MORE
Argenta Silver Corp. (TSX-V: AGAG) (OTCQX: AGAGF) (FSE: T1K) is p... READ MORE
Latest Drilling Results from Lynx Include 402 Metres of 0.20% Nic... READ MORE
Fury Gold Mines Limited (TSX:FURY) (NYSE American: FURY) is pleas... READ MORE