








TDG Gold Corp. (TSX-V: TDG) (OTCǪX: TDGGF) is pleased to announce the results of its first Preliminary Economic Assessment for the 100% owned Shasta and Mets deposits in the Toodoggone District of north-central British Columbia, which contemplates a joint open-pit operation for the two deposits. The PEA incorporates an updated Mineral Resource Estimate for the Shasta deposit, based on new and highly detailed structural modeling, and the first MRE for the Mets deposit.
The PEA, with an effective date of November 17, 2026, estimates an after-tax net present value at a 5% discount rate of C$1.18 billion, an after-tax internal rate of return of 38.8% and payback period of 1.8 years from the start of production. Initial project capital is estimated at C$604.9 million, including C$92.6 million of contingency. The economic base case assumes gold at US$3,550 per ounce and silver at US$50 per ounce.
All dollar amounts are in Canadian dollars unless otherwise stated. The PEA is preliminary in nature and includes Inferred Mineral Resources that are considered too speculative geologically to have the economic considerations applied to them that would enable them to be categorized as Mineral Reserves. There is no certainty that the PEA will be realized. Mineral Resources that are not Mineral Reserves do not have demonstrated economic viability.
PEA Highlights
¹ Payable AuEq (oz) = payable Au (oz) + payable Ag (oz) × (US$50 ÷ US$3,550), applying a 71:1 base-case gold-to-silver price ratio after metallurgical recoveries and commercial payabilities.
² AISC is a non-IFRS measure comprising modelled mine cash operating costs, offsite charges, royalties, sustaining capital and closure costs divided by payable AuEq1 ounces. Gold and silver are treated as co-products, without a second silver by-product credit. AISC excludes initial capital and may not be comparable with similarly named measures used by other issuers.
Overview
“The PEA defines what we can evaluate economically today. It does not define the limits of a mineralized district,” said Paul Geddes, P.Geo., Senior Vice President, Business Development and Strategy. “This study establishes a preliminary economic foundation for Shasta and Mets, supported by straightforward metallurgy, a low strip ratio and shallow open pit depths. Our favourable geography, established road access and strategic land position provide considerable flexibility for future potential development and expansion.”
“Beyond the current mineral resources lie potential extensions to the Shasta deposit, significant gold-in-soil anomalies surrounding Shasta and the past producing Baker deposit and numerous additional exploration targets on lands that will remain 100% controlled by TDG. Our recently announced agreement with Freeport would, subject to closing, provide C$110 million in non-dilutive proceeds to advance Shasta, Mets and our exploration portfolio with continued exposure to Aurora West.”
“We have been deliberate about what we have agreed to monetize, what we retain and the opportunities we have preserved. For TDG, the PEA is the beginning of that investment proposition, not its conclusion.”
PEA Economic Summary
Ausenco Engineering Canada ULC coordinated the PEA, with contributions from SRK Consulting (Canada) Inc. and Falkirk Environmental Consultants Ltd. The operation contemplated by the PEA uses feed from the potential Shasta and Mets open pits. The financial model is unlevered and expressed in real 2026 Canadian dollars, with cash flows discounted to December 31, 2027. It applies NSR royalties of 1.5% to Shasta and 2.0% to Mets.
Two modelled pre-production capital-expenditure years, Y−2 and Y−1, precede operating Year 1. Payback is measured from the commencement of production, not from the beginning of the pre-production expenditure period.
Table 1: Base Case Summary of PEA Metrics and Results4
| BASE-CASE METRIC | PEA RESULT |
| After-tax NPV₅ / IRR | C$1.18 billion / 38.8% |
| After-tax payback period | 1.8 years |
| Pre-tax NPV₅ / IRR | C$1.89 billion / 48.3% |
| Initial / sustaining capital | C$604.9 M / C$152.7 M |
| Pre-production expenditure | Y−2: C$178.5 M; Y−1: C$426.4 M |
| Closure provision | C$60.0 M |
| Operating life / nominal plant capacity | 9.9 years / approximately 4.0 Mtpa (11,000 tpd) |
| Scheduled plant feed / overall strip ratio | 38.21 Mt / 2.18:1 |
| Average annual payable Au / Ag / AuEq¹ | 71.2 koz / 2.82 Moz / 111.0 koz |
| Life-of-mine payable Au / Ag / AuEq¹ | 705.3 koz / 27.94 Moz / 1,098.8 koz |
| AISC² | US$1,283 per payable AuEq1 oz |
| Base-case Au / Ag prices | US$3,550/oz / US$50/oz |
| Exchange rate / NPV discount rate | C$1.35 per US$1.00 / 5% |
4 The PEA is preliminary in nature and includes Inferred Mineral Resources that are considered too speculative geologically to have the economic considerations applied to them that would enable them to be categorized as Mineral Reserves. There is no certainty that the PEA will be realized. Mineral Resources that are not Mineral Reserves and do not have demonstrated economic viability. “M” = millions and “k” = thousands.
Mineral Resources — Shasta and Mets Deposits
The new Shasta deposit MRE incorporates revised structural interpretations and updated estimation methodologies, informed by a review of the existing geological data and performed without additional drilling since the last MRE. The foundational MRE for the Mets deposit establishes a pit constrained Inferred Mineral Resource. Both estimates were prepared by Sheila Ulansky, P.Geo., of SRK, an independent mineral resource Qualified Person. The updated Shasta MRE supersedes all previous estimates, including the MRE effective December 29, 2024, prepared by Moose Mountain Technical Services, which is now considered outdated and should no longer be relied upon. The previously reported MRE for the Baker Tailings Storage Facilities have been excluded from the updated Mineral Resource Estimates, the PEA mine plan and economic analysis.
Table 2: Shasta and Mets Pit-Constrained Mineral Resource Statement Effective 17 November 2026
| Element Grade | Contained Ounces | |||||||
| DEPOSIT | CATEGORY | TONNES (Mt) |
Au (g/t) |
Ag (g/t) |
AuEq3 (g/t) |
Au (koz) |
Ag (Moz) |
AuEq3 (koz) |
| Shasta | Indicated | 17.12 | 0.87 | 31.73 | 1.28 | 479 | 17.46 | 705 |
| Shasta | Inferred | 26.84 | 0.47 | 20.57 | 0.74 | 406 | 17.75 | 636 |
| Mets | Inferred | 0.53 | 2.47 | 0.10 | 2.47 | 42 | 0.002 | 42 |
3 Gold-equivalent (AuEq) grades are calculated using deposit-specific formulas: Shasta: AuEq (g/t) = Au (g/t) + [0.013127 × (Ag recovery / Au recovery) × Ag (g/t)]; Mets: AuEq (g/t) = Au (g/t) + [0.01012 × Ag (g/t)]. Contained AuEq3 (koz) is calculated as Au (koz) + [Ag (Moz) × 1,000 × the applicable Ag coefficient]. AuEq3 grades and contained ounces are calculated independently from the rounded grades and contained-metal figures presented.
Mineral resources are reported using the 2014 CIM Definition Standards and were estimated in accordance with the CIM 2019 Best Practices Guidelines, as required by National Instrument 43-101 Standards of Disclosure for Mineral Projects (“NI 43-101”).
This MRE includes Inferred Mineral Resources which have not had sufficient work to classify them as Indicated mineral resources. It is uncertain but reasonably expected that inferred mineral resources could be upgraded to indicated mineral resources with continued exploration. See “MRE Notes” below for additional information on assumptions and cautionary language.
Mineral Resources are reported within conceptual open pit shells, are not Mineral Reserves and do not demonstrate economic viability. All figures are rounded to reflect the relative accuracy of the estimates; totals may not sum due to rounding. Additional details on estimation and reporting methodologies are summarized at the end of this release. The Qualified Person, Sheila Ulansky, P.Geo., is not aware of any legal, political, environmental or other relevant risks that could materially affect the potential development of the Mineral Resources other than set out in the technical report. Higher Au and Ag price assumptions have contributed to a lower reporting cut-off grade and an expanded conceptual pit shell for Shasta as compared to the now superseded 2024 MRE, resulting in increased reportable tonnes and contained gold. Lower average Au and Ag grades relative to previous Shasta estimates largely reflect the inclusion of additional lower-grade material. Revised structural interpretation, domaining, estimation methodology, density treatment and classification criteria have also affected the updated Shasta resource estimate. No new drilling was incorporated since the last MRE dated December 29, 2024.
Mining — Shasta and Mets Deposits
The PEA contemplates conventional, owner-operated truck-and-shovel mining from both the Shasta and Mets open pits, with the mining fleet purchased upfront and included in initial capital. Shasta contributes approximately 37.66 Mt of scheduled plant feed grading 0.66 g/t Au and 26.99 g/t Ag. Mets contributes approximately 0.55 Mt grading 2.30 g/t Au. Combined waste movement totals approximately 83.42 Mt and the overall combined strip ratio of the two pits is 2.18:1; peak annual total material movement is approximately 16.8 Mt.
Mets mining is scheduled in operating Year 4, with 0.20 Mt processed in Year 4 and approximately 0.35 Mt processed in Year 5 following stockpiling at the Mets site and haulage to the common plant located at Shasta. The Mets pit includes approximately 2.78 Mt of waste, equivalent to a waste-to-feed ratio of approximately 5.04:1. Shasta accounts for approximately 98.6% of scheduled plant feed; Mets provides higher-grade satellite feed after the modelled initial-capital payback period.
The conceptual Shasta mine plan directs approximately 55.4 Mt of waste to a southern waste-rock storage facility and a further 22.5 Mt toward construction of the process-tailings embankment. The estimated weighted-average Shasta waste haul is ~3.5 km, with the primary crusher located ~0.5 km from the ultimate pit rim. Waste from Mets is planned for storage adjacent to its pit. These arrangements remain conceptual and subject to detailed engineering and regulatory authorization.
The Shasta pit design includes a proposed diversion of the existing Jock Creek beginning operating Year 4. This is considered a material engineering and permitting consideration.
Scheduled plant feed reflects PEA-level dilution and mining-loss assumptions and does not constitute Mineral Reserves.
Processing — Conventional Gravity and Flotation
The proposed process uses a conventional flowsheet of crushing, SAG and ball milling, gravity concentration and flotation, followed by concentrate thickening and filtration. The nominal plant capacity is approximately 4.0 million tonnes per annum (~11,000 tonnes per calendar day). Studies performed to date indicate that no novel extraction technology is required.
Shasta metallurgical variability composites returned gold recoveries of approximately 88.9% to 95.1%, with combined gravity-and-flotation concentrate grades ranging from 20.9 to 92.8 g/t Au. A locked-cycle test conducted on a Shasta Year 1-5 master composite returned 91.4% gold and 90.0% silver recoveries to a gravity plus flotation concentrate grading 47 g/t gold and 2,400 g/t silver. Analysis of the locked cycle concentrate indicated that impurities were all below typical penalty limits. The economic model assumes recoveries of 91% Au and 90% Ag from Shasta and 77% Au and 60% Ag from Mets. Mets does not provide any relevant Ag revenue.
Concentrate Sales and Payability
The PEA considers sale of a gold–silver flotation concentrate to third-party buyers, with concentrate transported by road to port for onward shipment. The model estimates an average life-of-mine concentrate grade of approximately 40.1 g/t Au and 1,544 g/t Ag and weighted-average metal payabilities of approximately 92.4% for gold and 95.0% for silver. No payable silver production is modelled from Mets due to the low grade.
Transport is estimated at approximately US$180.55 per wet metric tonne of concentrate, with refining charges of US$6.00 per ounce of gold and US$0.60 per ounce of silver. The base case assumes no smelter penalties based on existing preliminary metallurgical test work. These are modelled commercial terms, not executed sales or offtake agreements; concentrate specifications and terms remain subject to confirmation.
Annual Payable Gold, Silver and AuEq1 Production
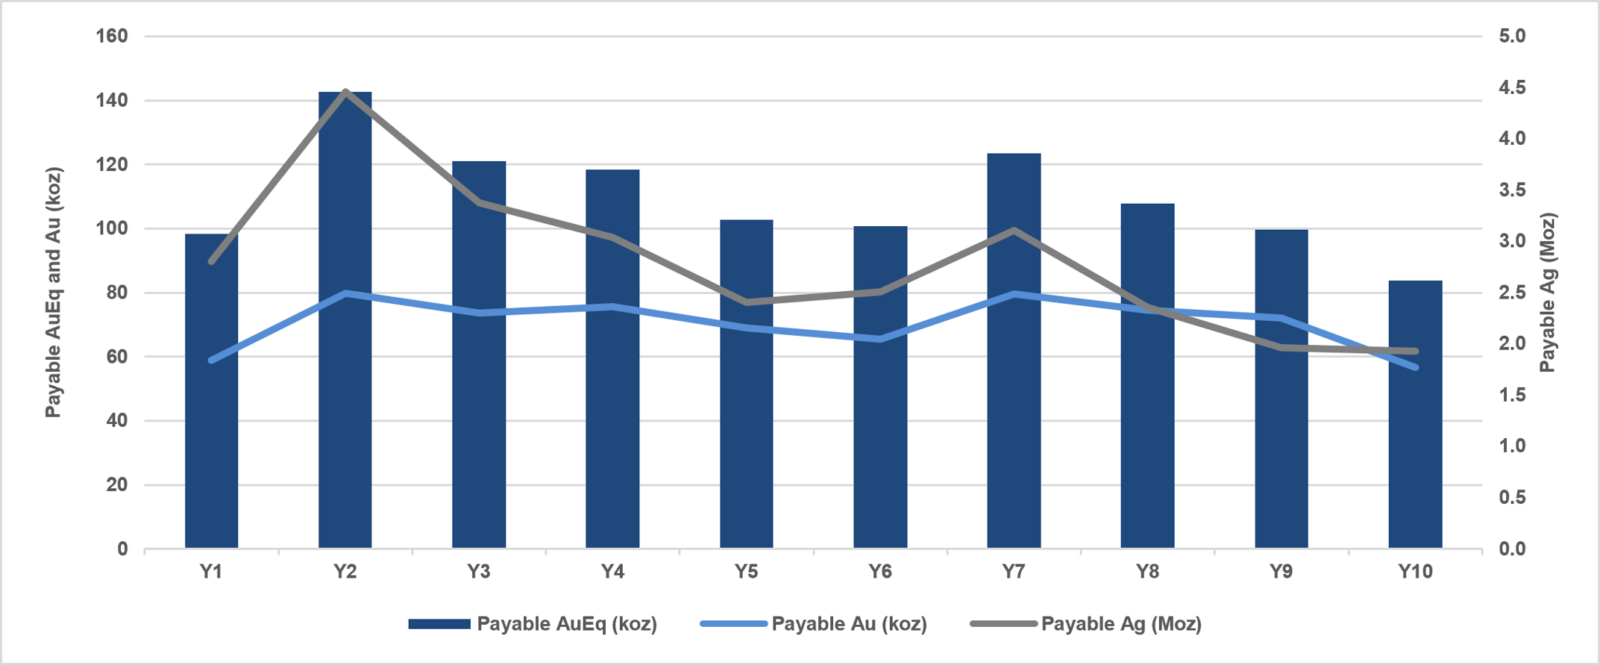
Over the 9.9-year modelled operating life, payable metal production totals approximately 705,300 ounces of gold and 27.94 million ounces of silver, equivalent to 1.099 million payable AuEq1 ounces. Figure 1 illustrates the ten annual production periods.
Figure 1: Modelled annual payable Au, Ag and AuEq1 production. Gold and AuEq are shown in thousand ounces (koz); silver in million ounces (Moz). Payable AuEq1applies the 71:1 base-case price ratio.
Capital and Operating Costs
Initial capital is estimated at C$604.9 million, including C$92.6 million of contingency. This also includes approximately C$32.9 million of capitalized mining operating costs and C$102.0 million of indirect, engineering, procurement and construction management and owners’ costs. Sustaining capital totals C$152.7 million, with an additional C$60.0 million modelled for closure. The AACE Class 5 estimate has an indicative accuracy range of −30% to +50%.
Life-of-mine operating costs are modelled at C$6.54 per tonne mined for mining, C$10.79 per tonne milled for processing and C$6.61 per tonne milled for general and administrative expenses. The aggregate site operating cost is C$37.39 per tonne milled. The unit-cost figures use different denominators and should not be added directly.
Commodity Price Assumptions and Sensitivities
The base case economic analysis uses a gold price of US$3,550 per ounce and a silver price of US$50.00 per ounce. These assumptions were selected with reference to consensus analyst estimates and comparable published economic studies and are intended to reflect average metal-price expectations over the life of the proposed operation. No commodity-price inflation or escalation is applied. Commodity prices are volatile and actual prices may differ materially from those assumed in the PEA. The sensitivities below change gold and silver prices together while leaving other model inputs and the mine plan unchanged; the scenarios are not independently re-optimized development cases.
Table 3: Commodity Price Sensitivities
| METRIC | −20% | −10% | BASE | +10% | +20% |
| Gold (US$/oz) | 2,840 | 3,195 | 3,550 | 3,905 | 4,260 |
| Silver (US$/oz) | 40 | 45 | 50 | 55 | 60 |
| After-tax NPV₅ (C$B) | 0.703 | 0.942 | 1.181 | 1.420 | 1.659 |
| IRR | 26.7% | 33.0% | 38.8% | 44.3% | 49.6% |
| Payback (years) | 2.6 | 2.1 | 1.8 | 1.7 | 1.5 |
| NPV₅ / initial capital | 1.2× | 1.6× | 2.0× | 2.3× | 2.7× |
Annual and Cumulative After-Tax Cash Flow
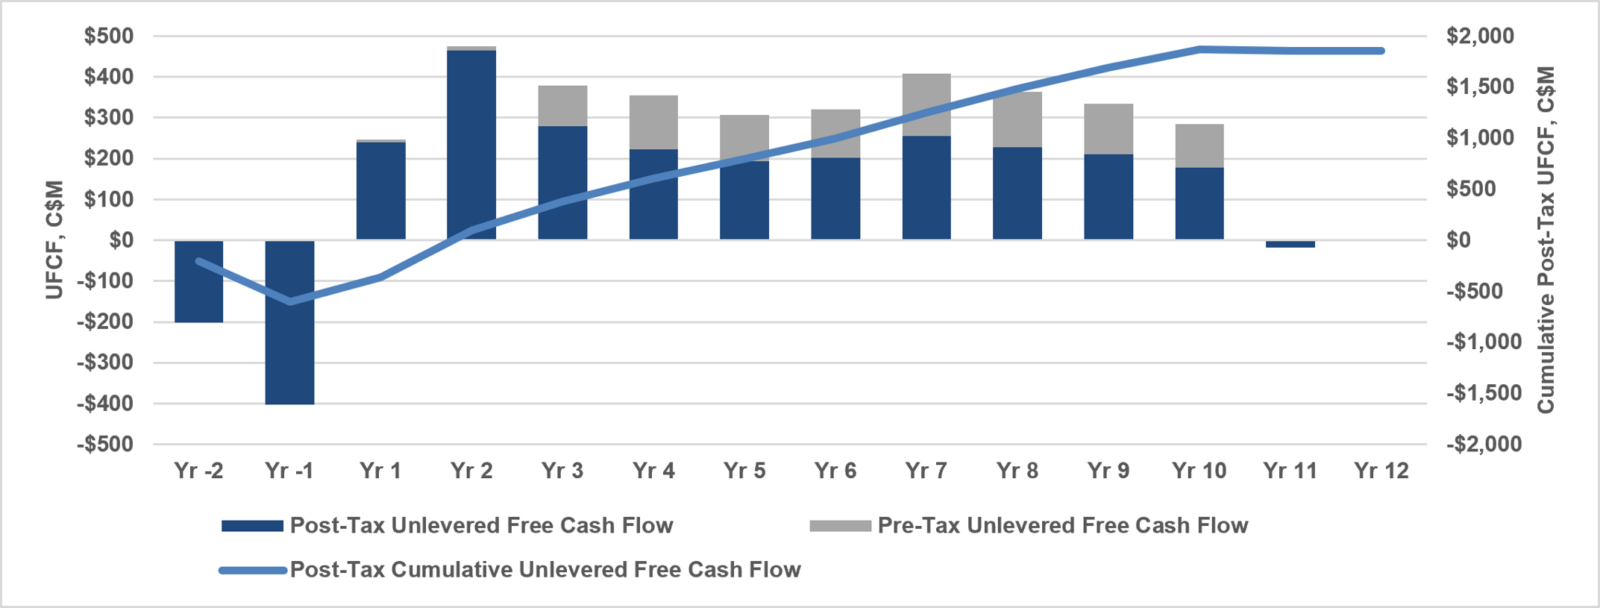
Estimated initial capital expenditures in the PEA are C$604.9 million, allocated over two pre-production years: C$178.5 million in Year −2 and C$426.4 million in Year −1. The mine plan includes approximately 4.83 million tonnes of pre-production waste stripping at the Shasta deposit during Year −1. The estimated payback period of 1.8 years is measured from the start of production and excludes the pre-production period. Initial capital expenditures do not necessarily represent the total external financing required to develop the project.
Figure 2: Modelled annual and cumulative after-tax unlevered free cash flow, including Years −2 and −1, operating Years 1–10 and closure. Values are in C$ millions; the final post-closure cumulative total is approximately C$1.78 billion.
Social, First Nations, Environmental and Permitting
The Shasta and Mets deposits are located in the Toodoggone district of north central British Columbia, within the traditional territories of First Nations who hold or assert Aboriginal rights and title in the area. The Company’s existing exploration relationships and authorizations do not constitute approval of, or consent to, the larger development described in the PEA.
TDG holds mining leases for Shasta and Mets, which expire in 2050 and 2053, respectively. British Columbia Mines Act Permit.
M-189 covers approximately 175 hectares of historical mine workings and related infrastructure at Shasta. That existing authorization does not by itself permit the integrated operation, new process facilities or other components contemplated in the PEA. A historical Environmental Management Act discharge permit, PE-8467, is also documented for the property.
The Project is expected to require an Environmental Assessment Certificate under the BC Environmental Assessment Act (2018) and a federal decision under the Impact Assessment Act (2019). Further authorizations would then be required, including an amended Mines Act permit, an Environmental Management Act discharge permit, and Fisheries Act authorization for the proposed Jock Creek diversion.
The Project concept includes process-tailings storage, waste-rock facilities, water collection and treatment, and closure and reclamation allowances. The conceptual closure plan provides for the open pits to fill to their natural spill points, and closure is estimated at C$60.0 million. Material environmental considerations requiring further study include the proposed Jock Creek diversion, fish and fish habitat, waste-rock geochemistry, potential for acid rock drainage and metal leaching, groundwater and surface-water management, and any long-term water-treatment requirements.
Qualified Persons and Technical Report
The Preliminary Economic Assessment was coordinated by Ausenco Engineering Canada ULC, with contributions from SRK Consulting (Canada) Inc. Ausenco Sustainability ULC and Falkirk Environmental Consultants Ltd. Metallurgical test work was undertaken by Base Metallurgical Laboratories Ltd., part of Intertek Group.
In accordance with National Instrument 43-101 – Standards of Disclosure for Mineral Projects Paul Geddes, P.Geo., Senior Vice President, Business Development & Strategy, is the Qualified Person for the Company and has reviewed, validated and approved the scientific and technical information contained in this news release.
The independent Qualified Persons responsible for the PEA and Mineral Resource Estimates include Sheila Ulansky, P.Geo., of SRK (Mineral Resource Estimates); Dr. Anoush Ebrahimi, P.Eng., of SRK (strategic planning and mine design); Robert McCarthy (mine costing); Peter Mehrfert, P.Eng., of Ausenco (metallurgy, mineral processing, infrastructure, cost estimation, and economics); Aleksandar Spasojevic, P.Eng., of Ausenco Sustainability ULC (tailings and geotechnical engineering); and Jacob MacLaine, P.Geo., of Falkirk (environmental studies, permitting and social or community impact).
The NI 43-101 technical report supporting the PEA and updated Mineral Resource Estimates, with a PEA effective date of November 17, 2026, will be filed under the Company’s profile on SEDAR+ and made available on the Company’s website within 45 days of this news release. The Company will announce the filing by separate news release.
Non-IFRS Measures
AISC and AISC per payable AuEq ounce are non-IFRS measures without standardized definitions under IFRS Accounting Standards. The calculation used for the PEA comprises modelled mine cash operating costs, offsite charges, royalties, sustaining capital and closure costs divided by payable AuEq1 ounces. Gold and silver are treated as co-products, without a second silver by-product credit. AISC excludes initial capital and may not be comparable with similarly named measures used by other issuers. NPV₅-to-initial-capital equals modelled after-tax NPV₅ divided by initial capital and is not a shareholder return or financing valuation.
MRE Notes
Mineral resources are reported using the 2014 CIM Definition Standards and were estimated in accordance with the CIM 2019 Best Practices Guidelines, as required by National Instrument 43-101 Standards of Disclosure for Mineral Projects. This MRE includes Inferred Mineral Resources which have not had sufficient work to classify them as Indicated mineral resources. Mineral Resources are not Mineral Reserves and do not have demonstrated economic viability. All figures are rounded to reflect the relative accuracy of the estimate; totals may not sum due to rounding.
Shasta:
Mets:
About TDG Gold Corp.
TDG is a mineral exploration company focused on advancing its gold, silver and copper projects in British Columbia, Canada. Its wholly owned portfolio includes the Shasta gold–silver deposit, the Mets prospect, the Baker Complex and the Anyox copper project. The Company’s activities focus on resource growth, technical evaluation and exploration for additional discoveries across Greater Shasta and at Anyox.
Aurora West forms part of TDG’s joint venture arrangements with Freeport-McMoRan Mineral Properties Canada Inc. as described in the Company’s November 12, 2026, news release. The agreement provides for Freeport to acquire an initial 51% interest in two companies holding the Aurora West Property for C$110 million in cash, with additional earn-in rights in consideration of C$80 million in exploration expenditures and a further C$40 million cash payment to TDG. Shasta and Baker are excluded from these arrangements and remain wholly owned by TDG. Refer to the November 12, 2026, news release for full transaction terms and closing conditions.
TDG’s strategy is to create shareholder value through disciplined, capital-efficient exploration, technical evaluation, resource growth and advancement of its mineral projects.
North Sky Metals Corp. (TSX-V:NSKY) is pleased to announce assay ... READ MORE
OceanaGold Corporation (TSX: OGC) (NYSE: OGC) announces explorati... READ MORE
135,000 MT ANNUAL CU PRODUCTION (1ST 10 YEARS) 17,000 OZ ANNUAL A... READ MORE
NexGold Mining Corp. (TSX-V: NEXG) (OTCQX: NXGCF) is pleased to ... READ MORE