








Spanish Mountain Gold Ltd. (TSX-V: SPA) (FSE: S3Y) (OTCQB: SPAUF) is pleased to announce the results of a Preliminary Economic Assessment and Mineral Resource Estimate Update the “PEA“, or “PEA Update”, “MRE” on the Spanish Mountain Gold Project located within the Cariboo Gold Corridor, British Columbia, Canada. The PEA Update is a conceptual study showing improved potential economic viability of the Main Deposit. The PEA will be published in an independent National Instrument 43-101 Technical Report within 45 days of this news release and filed on SEDAR+. Once filed on SEDAR+, the PEA will supersede the Company’s existing technical report on the Project. The PEA Update study was commissioned by the Company and prepared by consultants led by BBA Engineering Ltd. The PEA envisions a conventional open pit mining and milling operation with a projected 25.8-year life of mine producing 3.33 million ounces of payable gold, with a front-weighted production profile and attractive economics.
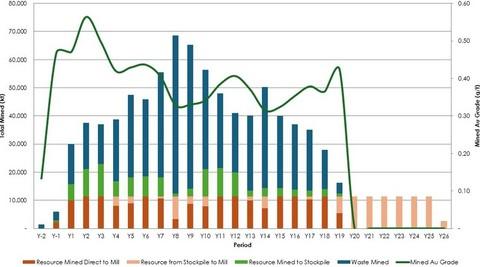
Figure 1: PEA Update Mine Production Schedule Summary
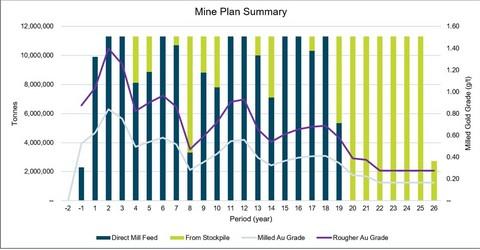
Figure 2: PEA Update Mine Production Schedule with Mill Feed Grade
Highlights
Environmental, Permitting & Community: From March to August 2026, SMG worked closely with BC Environmental Assessment Office, Impact Assessment Agency of Canada, participating Indigenous Nations and local communities to secure authorization in August from BCEAO to resume the previously paused combined provincial and federal Environmental Assessment processes. This authorization, received in August from BC EAO avoids EA termination and reduces duplicate components of early engagement and the Initial Project Description processes. Consequently, pending geotechnical and condemnation drill results, SMG is on track trending towards delivering an updated draft Detailed Project Description in Q4 and formal submission of the DPD in Q1 2027. These are the next steps in resuming the EA process to advance to Spanish Mountain Gold project towards a build decision in 2028.
Key PEA Update Improvements and Optimizations vs. 2025 PEA
The PEA Update incorporates several important improvements and de-risking initiatives compared to the 2025 PEA, all of which better positions the Project for a successful next phase of development. Notable changes include:
President and CEO, Peter Mah stated:
“The results of the PEA Update reflect steady improvements to the overall project economics and further scaling up of proposed gold production now projected higher than 3.3 Moz life of mine. This PEA with updated mineral resource estimate marks another key milestone for the Company as it prepares to complete a feasibility study (FS) and build decision by H1 2028. Our ongoing 60 km drill program to support the FS is approximately 50% complete and expected to be completed towards the end of Q4 2026. The drilling is expected to provide further opportunities to enhance scale, assist with locating proposed mine infrastructure and important technical information to complete the FS that will also enable permitting to advance. We are pleased to see years 1-10 gold production grew from 1.53 Moz to 1.73 Moz while LOM strip ratio of waste to gold mineralized material reduced from 2.0:1 to 1.8:1. LOM all-in sustaining costs and Initial Capex increased marginally from US$1,338 to US$1,450 and from US$ 926 million to US$1,050 (C$1,250 million to C$1,418 million) respectively primarily due to escalation, water treatment plant requirements, and an NSR due to the project financing secured April 20, 2026 (refer to news release dated April 20, 2026)
Spanish Mountain Gold has a bright future ahead creating a new definition of responsible sustainable mining that generations of Canadians will be proud of!”
Table 1: PEA Results Summary
| 2025 PEA | 2026 PEA Update | |||
| Base Case ($2,450/oz Au, $28.50/oz Ag) | Spot Price ($3,300/oz Au, $36/oz Ag ) | Base Case ($3,600/oz Au, $50/oz Ag) | Spot Price ($4,400/oz Au, $66/oz Ag)1 | |
| After-Tax NPV US$M (C$M, 5% discount rate) | $759 ($1,025) | $1,715 ($2,315) | $2,156 ($2,910) | $3,142($4,242) |
| After-Tax IRR (%) | 18.20% | 32.00% | 35.20% | 46.30% |
| Annual Average Free Cash Flow US$M (C$M)4 | $63 ($85) | $128 ($173) | $150 ($202) | $214 ($289) |
| Annual Average Free Cash Flow Yr. 1-5 US$M (C$M)4 | $230 ($311) | $336 ($454) | $406 ($549) | $507 ($684) |
| Initial Capex US$M (C$M) | $926 ($1,250) | $926 ($1,250) | $1,050 ($1,418) | $1,050 ($1,418) |
| Total Cash Cost US$ / Au oz (C$ / Au oz)2 | $1,194 ($1,612) | $1,201 ($1,621) | $1,299 ($1,754) | $1,309 ($1,767) |
| AISC US$ / Au oz (C$ / Au oz)3 | $1,338 ($1,806) | $1,345 ($1,816) | $1,450 ($1,958) | $1,460 ($1,971) |
| Payback Period (years) After-Tax | 3.4 | 2 | 1.8 | 1.5 |
| Nominal Processing Throughput (tpd) | 26,000 | 26,000 | 31,0005 | 31,000 |
| Stripping ratio | 2.0:1 | 2.0:1 | 1.8:1 | 1.8:1 |
| Mine Life (years) | 24.5 | 24.5 | 25.8 | 25.8 |
| Annual Average Throughput (Mtpa) | 9,340 | 9,340 | 11,315 | 11,315 |
| Annual Average Production (koz/a) | 122 | 122 | 129 | 129 |
| Average Gold Head Grade (g/t) | 0.46 | 0.46 | 0.41 | 0.41 |
| Average Gold Recovery (%) | 89.30% | 89.30% | 88.60% | 88.60% |
| Gold Price (US$ / oz) | $2,450 Au | $3,300 Au | $3,600 Au | $4,400 Au |
| Silver Price (US$ / oz) | $28.50 Ag | $36.00 Ag | $50 Ag | $66 Ag |
| Exchange Rate USD/CAD | 1.35 | 1.35 | 1.35 | 1.35 |
| Total LOM Au ounces produced (Moz) | 3 | 3 | 3.33 | 3.33 |
| Total LOM Ag ounces produced (Moz) | 2.1 | 2.1 | 1.96 | 1.96 |
Notes for Table 1
The economic analysis contained in this news release is preliminary in nature and is based primarily on Measured and Indicated Mineral Resources totaling 41.7% and 56.5% respectively, and in part, Inferred Mineral Resources totaling 1.8% of the proposed mill feed from the Main deposit. Mineral Resources are considered too geologically speculative to have the economic considerations applied to them that would enable them to be categorized as Mineral Reserves. There is no certainty that economic forecasts on which this PEA is based will be realized. Mineral Resources that are not Mineral Reserves do not have demonstrated economic viability. Table 2 lists the breakdown by resource category of the run of mine mill feed for the PEA life of mine plan.
Table 2: ROM mill feed and Contained Metal by Mineral Resource Classification
| Category | ROM Mill Feed (Mt) | ROM Au (Moz.) | ROM Ag (Moz.) |
| Measured | 119.5 | 1.81 | 2.40 |
| Indicated | 161.9 | 1.91 | 3.43 |
| Total M+I | 281.4 | 3.72 | 5.83 |
| Inferred | 5.1 | 0.04 | 0.20 |
Notes:
Mineral Resource Estimate for the Main Deposit
Note: The Main Deposit is included in the financial modelling for the 2026 PEA.
The updated MRE for the Main deposit is based on the amalgamation of what have been historically described as the Main Zone, North Zone, Slipper Zone, and K Zone, effective May 19, 2026, and it is reported at a 0.15 g/t gold cut-off (see Table 3). There is no certainty that Mineral Resources will be converted into Mineral Reserves. Mineral Resources that are not Mineral Reserves do not have demonstrated economic viability. Mineral Resources include Inferred Mineral Resources which have had insufficient work to classify them as Indicated Mineral Resources. It is uncertain but reasonably expected that Inferred Mineral Resources could be uplifted to Indicated Mineral Resources with additional drilling.
Geological and resource domain modelling and estimation for the Project was completed using Leapfrog 2026.1. The lithological model was developed based on data from the extensive re-logging program of 170,000 m drill core that was completed in 2023 and 2024, in addition to geochemical classification of sampled intervals eligible for such analysis, which includes both historical and modern drilling. Mineralization domains are modelled by identifying zones with gold values greater than 0.3 g/t over a minimum width of 3 m. Two primary styles of mineralization were recognized. Early mineralization includes disseminated stratiform mineralization in argillite-bearing lithologies. Late mineralization includes gold associated with late-stage quartz veins. Three high-confidence faults were modelled, including the North Fault, South Fault, and Fault 1. The Main Block is bound by the North and South Faults, representing significant discontinuities in stratigraphy and mineralization. Within the Main Block, Fault 1 introduces a minor offset in the main block.
Reasonable prospects for eventual economic extraction were evaluated by performing a pit optimization using the Lerchs-Grossman algorithm with the following parameters: gold price of US$3,400/oz, silver price of US$45/oz, and gold selling costs of US$5.19/oz (C$7/oz) for offsite charges, and a 1.5% royalty. Mining costs for mineralized material and waste are US$2.59/t (C$3.50/t), with incremental mining costs of US$0.02/t (C$0.03/t). Processing costs are US$8.52/t (C$11.50/t) for mill processing and include site G&A. Payability for gold is 99.8%, and payability for silver is 90%. Process recovery for gold is 90%, while process recovery for silver is 50%. The exchange rate used is C$0.73 to US$1.
Total Measured and Indicated Mineral Resources for the Main deposit includes 342.0 Mt at an average grade of 0.42 g/t gold and 0.66 g/t silver, for a total of 4.7 M contained ounces of gold (12% increase over the 2025 gold MRE) and 7.2 M contained ounces of silver (17% increase over the 2025 silver MRE). Total Inferred Mineral Resources for the Main deposit includes 42.4 Mt at an average grade of 0.28 g/t gold and 0.86 g/t silver, for a total of 0.4 M ounces of gold and 1.2 M ounces of silver.
Table 3: Mineral Resource for the Main deposit – 2025
| Category | Cut-off Grade(g/t) | Tonnes (kt) | Au Avg. Grade | Au (koz) | Ag Avg. Grade(g/t) | Ag (koz) |
| Measured | 0.15 | 77,370 | 0.53 | 1,321 | 0.68 | 1,701 |
| Indicated | 0.15 | 214,702 | 0.41 | 2,842 | 0.65 | 4,463 |
| Measured & Indicated | 0.15 | 292,072 | 0.44 | 4,163 | 0.66 | 6,163 |
| Inferred | 0.15 | 14,830 | 0.33 | 155 | 0.95 | 454 |
Mineral Resource for the Main deposit – 2026
382
| Category | Cut-off Grade (g/t) | Tonnes (kt) | Au Avg. Grade
|
Contained Au (koz) | Ag Avg. Grade (g/t) | Contained Ag (koz) | ||
| Measured | 0.15 | 111,383 | 0.51 | 1,831 | 0.66 | 2,356 | ||
| Indicated | 0.15 | 230,636 | 0. | ,832 | 0.66 | 4,863 | ||
| Measured & Indicated | 0.15 | 342,019 | 0.42 | 4,663 | 0.66 | 7,219 | ||
| Inferred | 0.15 | 42,375 | 0.28 | 382 | 0.86 | 1,174 |
Notes for Table 3:
Mineral Resource Estimate for the Phoenix Deposit
Note: The Phoenix Deposit is not included in the financial modelling for the 2026 PEA.
The MRE for the Phoenix deposit is reported at a 0.15 g/t gold cut-off, reflecting an updated pit shell based on a US$3,400/oz gold price. Total Indicated Mineral Resources for the Phoenix deposit include 0.09 Mt at an average grade of 0.25 g/t Au, for a total of 0.7 koz of contained gold. Inferred Mineral Resources include 54.4 Mt at an average grade of 0.36 g/t Au, for a total of 629 koz of contained gold (see Table 4).
Table 4: Mineral Resources for the Phoenix deposit
| Resource Classification | Cut-off Grade (Au, g/t) | Tonnes (kt) | Gold Grade (Au, g/t) | Contained Gold (Au, koz) |
| Indicated | 0.15 | 0.09 | 0.25 | 0.72 |
| Inferred | 0.15 | 54.45 | 0.36 | 629 |
Notes for Tables 4:
Geological and resource modelling for the Phoenix deposit was completed using Leapfrog 2026.1 and Micromine Origin & Beyond 2026. The lithological model was developed based solely on geochemical classification, with six principal stratigraphic units identified: Upper Mafic Tuff, Upper Sedimentary Sequence, Lower Mafic Tuff, Intermediate Sedimentary Sequence, Intermediate Tuff, and Lower Sedimentary Sequence. These units generally dip gently to the northeast. A steeply dipping north-south trending fault divides the Phoenix deposit into eastern and western blocks. The eastern block contains the full stratigraphic sequence, while the western block includes only the two lowermost stratigraphic units found in the eastern block.
Gold mineralization was modelled based on downhole structural data measured from oriented drill core. This interpretation includes identifying two principal sets of mineralized structures: flat to gently east-dipping and steeper northeast-dipping orientations. These define three mineralized lenses-two upper, gently dipping zones and a deeper, steeper-dipping zone.
Capping values for the Phoenix deposit were determined using decile analysis and log-scaled probability plots of length-weighted gold assays. Outlier restrictions were applied to lithological domains during the second estimation pass, excluding samples above 0.2 g/t gold where search distances exceeded 30% of the variogram range. No outlier restrictions were applied to mineralized domains. A semi-hard boundary approach was applied to specific lithological contacts reflecting gradational contacts of lithological units. These included the Lower Mineralized Zone (Domain 630) with a distance threshold of 5 m, the Lower Mafic Tuff with 15 m, and the Lower Sedimentary unit with 50 m. This approach was used to reduce artefacts and better represent grade continuity in stratigraphically complex or sparsely drilled areas.
The block model was constructed using a parent block size of 5m x 5m x 5m, with sub-blocks refined down to 1.25 m to accurately honor geological boundaries and minimum mining widths. Grade estimation was conducted using a combination of Ordinary Kriging (OK) and inverse distance cubed (ID3) methods. OK was used for all mineralized domains where variograms could be reliably modelled; ID3 was applied to other domains where variogram stability could not be achieved. Locally varying anisotropy was applied within mineralized domains to reflect observed structural controls.
Resource classification followed the CIM Definition Standards (2014) and was guided by geological confidence, data spacing, and estimation support. The current drilling density supports predominantly Inferred classification. These are supported by at least two drill holes within a spacing of ≤155 m. Indicated Mineral Resources are supported by drill hole spacing of ≤70 m with minimum of 3 drill holes used for estimation.
Reasonable prospects for eventual economic extraction were applied by performing a resource pit optimization and applying the following parameters: a gold price of US$3,400/oz, gold selling costs of US$5.19/oz (C$7/oz) for offsite charges, a 1.5% royalty, mining costs of US$2.59/t (C$3.50/t) with incremental costs of US$0.02/t (C$0.03/t) per 10 m elevation drop starting at 1,050 m elevation, and combined processing and site G&A costs of US$8.52/t (C$11.50/t). Gold payability was assumed to be at 99.8%, with a metallurgical recovery of 90%. The exchange rate used was C$0.73 to US$1.00. No by-product metals were included in the estimate.
Spanish Mountain Project Consolidated Mineral Resources
Total combined Mineral Resources for the Spanish Mountain Gold Project are summarized in Table 5. Total Measured and Indicated mineral resources include 342.1 Mt at 0.42 g/t gold for total 4.66 M contained gold ounces. Total inferred mineral resources include 96.8 Mt at 0.32 g/t gold for total 1.01 M contained gold ounces.
Table 5: Consolidated Mineral Resources for the Spanish Mountain Gold Project
| Area | Classification | Cut Off Gold Grade (g/t) |
Tonnes (Mt) |
Gold (g/t) |
Contained Gold (koz) |
Silver (g/t) |
Contained Silver (koz) |
| Main Deposit
|
Measured | 0.15
|
111.4 | 0.51 | 1,831 | 0.66 | 2,356 |
| Indicated | 230.6 | 0.38 | 2,832 | 0.66 | 4,863 | ||
| M&I | 342.0 | 0.42 | 4,663 | 0.66 | 7,219 | ||
| Inferred | 42.4 | 0.28 | 382 | 0.86 | 1,174 | ||
| Phoenix Deposit
|
Indicated | 0.15
|
0.09 | 0.25 | 0.72 | – | – |
| Inferred | 54.45 | 0.36 | 629 | – | – | ||
| Total Spanish Mountain Gold Project
|
M&I |
|
342.1 | 0.42 | 4,664 | 0.66 | 7,219 |
| Inferred | 96.8 | 0.32 | 1,011 | 0.86 | 1,174
|
Notes for Table 5:
Mining and Processing
Open pit mine designs, mine production schedules, and mine capital and operating costs have been developed for the Main deposit, at a scoping level of engineering. The mineral resources, including inferred resources, form the basis of the mine planning. The Phoenix deposit MRE is not included or considered as part of the mine plan.
Open pit mining activities are designed for approximately 25.8 years of operation. Mine planning is based on large scale conventional drill, blast, load, and haul open pit mining methods suited for the Project location and local site requirements. The subset of mineral resources contained within the designed open pits are summarized in Table 6, with a 0.15 g/t Au cut-off grade, and form the basis of the mine plan and production schedule, which is summarized in Figure 5.
Table 6: PEA Mine Plan Production Summary
| Mine Plan Pit Contents Total | |
| ROM Mill Feed | 286.5 Mt |
| Mill Feed Au Grade | 0.41 g/t |
| Mill Feed Au Metal | 3.8 Moz. |
| Mill Feed Ag Grade | 0.65 g/t |
| Mill Feed Ag Metal | 6.0 Moz. |
| Waste Overburden and Rock | 507 Mt |
| Waste: Resource Ratio | 1.8 |
Mill feed quantities and grades include estimates of mining dilution and recovery based on a 10 m selective block size and 2 m dilution skins applied to all waste contacts. This results in an addition of 9% dilution and 0% loss to the original sub-block resource block model.
Processing of the ROM mill feed at 31,000 tpd (or 11.3 Mt per annum from run of mine and rehandling from stockpile) is by means of a conventional process flowsheet including primary grinding, gravity concentration, preconcentration with coarse particle flotation, conventional flotation with regrind, concentrate followed by cyanidation via a CIL circuit to produce dore. The process achieves an average overall LOM gold recovery of 89%. The average silver recovery as a by‐product of the milling process for the life of the Project is 44%. Non-Acid Generating tailings from the plant are dewatered by screening and filtering and conveyed to a dry stack tailings facility, where it will be spread and compacted in engineered lifts. All site water is managed through a separate water management pond that includes a water treatment plant for any water to be discharged during the LOM.
The tailings storage facilities proposed for construction and development at Project are primarily based on utilization of filtered tailings technology for the base case scenario. Multiple tailings storage locations, designs, and technologies were analyzed to arrive at the preferred location and tailings technology.
Initial Capital Costs
The initial capital expenditures for the Project as integrated by BBA are summarized in Table 7 and the capital expenditures to be incurred after the start-up of operations are assigned to sustaining capital and are projected to be covered by operating cash-flows. Project contingencies have been added where applicable, excluding capitalized operating costs, which results in an overall contingency of US$216 (C$292M) (excluding taxes).
The Project will benefit from established infrastructure in central British Columbia, noting that the Project is approximately 70 km by road to the city of Williams Lake. Local infrastructure in Likely will further support the Project development.
Table 7: Initial Capital Cost Estimate
| 2025 PEA US$M (C$M) | 2026 PEA Update US$M (C$M) | Difference (C$M) | |
| Mining (Including contingency) | $83.7 ($113) | $82.2 ($111) | ($2) |
| Process Plant and Facilities(1) | $310 ($419) | $327.4 ($442) | $23 |
| On-site Infrastructure (including tailings, water management, water treatment, environmental, site costs, and earthworks)(1) | $113 ($152) | $152.6 ($206) | $54 |
| Off-site Infrastructure | $118 ($159) | $116.3($157) | ($2) |
| Project Indirects | $28 ($38) | $34.1 ($46) | $8 |
| EPCM, Owners Cost, Consultants | $83 ($112) | $96.6 ($129) | $17 |
| Project Contingency & other (excluding mining contingency)4 | $192 ($260) | $242.9($327) | $67 |
| TOTAL(2) (3) | $926 ($1,250) | $1050.4 ($1,418) | $ 165 |
Notes on Table 7:
Sustaining Capital Costs:
BBA estimates the LOM sustaining capital for Project to be US$399M ( C$539 M), which is expected to be funded by operating cash flows. The sustaining capital estimate is primarily for the expansion of the tailing storage facility, mining fleet additions as total material movements increase with depth, and reclamation and closure. The PEA has assumed US$119.5 (C$161.3 M) in closure and reclamation costs.
On Site Direct Operating Costs
The estimated Opex for Project is US$14.44/t (C$19.49/t) of mill feed – see Table 8. BBA and MMTS have estimated the Opex based on first-principles calculation, industry benchmarking, proprietary information and professional experience.
Table 8: On Site Operating Cost for Base Case
| Metric | Unit | 2026 PEA Update |
| Open pit mining cost (excl. pre-prod) | US$/t milled | 7.12 (C$9.61) |
| Processing cost (excluding G&A) | US$/t milled | 6.42 (C$8.67) |
| G&A | US$/t milled | 0.91 (C$1.23) |
| Total site operating cost | US$/t milled | 14.44 (C$19.49) |
Notes on Table 8:
Royalties
There are three Net Smelter Royalty payments applicable to the current Mineral Resource. There are two 1.0% NSRs payable, and one 1.5% Net Smelter Royalty payable to another royalty holder. These are the only three royalties that apply to the current Mineral Resources as mill feed for the Project and they have been incorporated into the economic analysis of the 2026 PEA Update. The Company plans to exercise its right to buydown the NSRs, for a total buydown payment of $25.9 Million USD ($35 million CDN) as provided in the agreements to be paid during the initial capital period. Therefore, all or substantially all of the Project (Main Deposit only) is subject to a combined NSR burden of between 2 and 2.5% after the aforementioned buydowns.
Infrastructure
The major infrastructure items considered and costed in the PEA support a mining and milling operation that is expected to operate 24 hours per day, seven-days per week. The design of Project infrastructure has prioritized environmental protection, workforce safety, and operating efficiency while minimizing community impacts. The Project site will consist of the open pit mine and mining related workshops, a processing plant, waste rock and tailings stack, and support service infrastructure such as warehousing, offices and workshops.
The Project site-wide water balance is positive for which water capture, treatment and discharge infrastructure has been allowed for and designed. The Project will draw water from within the property and contain process water and tailings within the water management pond and tailings stack, effectively. Water management and treatment has been included to treat both open pit dewatering and surface facilities run-off to required environmental discharge standards.
The site will be supported by renewable electrical grid power through a new, 75 km long 230kV, transmission line constructed by the Company from site to a new switching station designated as SMM, which is currently being designed by BC Hydro, located near the McLeese Lake Capacitor station. The mine and process operations are supported by functional maintenance and administration infrastructure located on site as well as off-site locations for non-critical administrative functions. Select local access roads will be upgraded and maintained throughout the mine life.
The proposed tailings storage method is placement of dewatered material containing both tailings and minor amounts of process water. The minor proportion of Potential Acid Generating tailings will be managed within a dedicated conventional tailings lined cell contained within the tailings stack. NAG waste rock, PAG waste rock and overburden will be split by type and placed in facilities that will be suitably designed for physical stability and collection of run-off from the waste rock storage facilities. All facilities will be located near the open pit mine to maximize efficiencies and minimize impact, subject to condemnation drilling.
Environmental, Permitting and Community Matters
The Company’s property comprises approximately 63 contiguous mineral claims and 15 placer claims covering an area of approximately 13,303 hectares and 2,240 hectares, respectively. The claims are held under the British Columbia Mineral Tenure Act and provide the Company with the exclusive right to explore for and develop Crown-owned mineral resources within the claim boundaries, subject to applicable legislation, regulations, and permit requirements. To support future mine development and production activities, the Company is required to convert the relevant mineral claims to a mining lease, which provides the legal right to use and occupy the surface and subsurface for mining purposes for 30 years and is renewable. Various purchase agreements and royalty payment agreements may apply to the specific mineral claims.
The Company currently holds a valid Mineral Exploration permit with the Government of British Columbia covering the Project which supports the development phase activities including mineral exploration, mine design site investigation studies, and design engineering. During its recent 2024 to 2026 exploration drill programs and 2026 environmental baseline and monitoring studies, the Company regularly engaged communities and pro-actively sought shared benefits opportunities with local to regional businesses, contractors, and workers.
To advance the project towards construction and operations, the Company will need to apply for and acquire a BC Environmental Assessment Certificate and federal Decision Statement approving the mine with conditions. Permits under the provincial Mines Act, Environmental Management Act, Land Act, Water Sustainability Act, an authorization under the Fisheries Act, and agreements with private land-owners, as necessary, and BC Hydro will be required to construction and operate the mine.
Following publication of the 2025 PEA and the commencement of feasibility study activities, the Company re-engaged First Nations regarding the revised Project design, environmental assessment strategy, 2026 baseline studies, and the proposed path forward for consultation and relationship development. In a letter dated August 27, 2026, the British Columbia Environmental Assessment Office confirmed acceptance of the Company’s plan to resume the combined provincial and federal Environmental Assessment process. Pending geotechnical and condemnation drilling results, the Company is on track to execute the plan, which includes continued engagement with First Nations, the public, and key stakeholders; submission of a draft Detailed Project Description in Q4 2026; and formal submission of the DPD in Q1 2027, after which the Environmental Assessment Certificate and Application would be developed and submitted for review. The Company recognizes and respects the First Nations asserted Indigenous rights and title in the Project area and looks forward to continuing meaningful engagement with each First Nation on our proposed next steps in resuming the EA process and to advance the Project towards a build decision in 2028.
Opportunities and Future Work
BBA, the team of consultants, and the Company have identified several areas and opportunities that may provide significant costs savings and improved economics for the Project. Post-PEA the Company will embark on additional technical work and engineering studies to better position and further de-risk the Project, including but not limited to the following:
Mining
Milling and Metallurgy
Tailings Storage and Waste Rock Facilities
Critical Metal
Other
Changes to the conceptual mine plan and mine design that may be recommended in the PEA study, if approved and implemented as the Project moves forward, could impact the capital and operating costs, profitability and cash flows and an eventual timeline to production, the impact of which cannot be quantified at this time. As a result, there are additional uncertainties with respect to the size and grade of the Mineral Resources that may become Mineral Reserves in the future, and that will serve as the basis for future studies.
In addition, the Company may continue to conduct exploration activities within the 13,303,-hectare SMG mineral claims property which encompasses the estimated MRE and is the basis for, the PEA. The objective of continuing property wide exploration is dependent on drill results, target rate ranking, market conditions and other factors that could be considered to further maximize the Company’s flexibility and attractiveness to advance future development decisions on the Project.
Additional Considerations Related to the PEA
Investors should be cautioned that there is no guarantee that the future construction and development of the Project will be completed in accordance with the PEA Update results set forward in this news release. There is no certainty that production will begin, or that operating capital, or that financial results will be consistent with the PEA Update.
Technical Information and Quality Control & Quality Assurance
Once received from the drill and processed, all drill core samples were sawn in half, labeled, and bagged. The remaining half of the drill core was stored on-site. Numbered security tags were applied to sample shipments to ensure chain of custody compliance. The Company inserts quality control samples at regular intervals, including duplicates, blanks and certified reference materials, for all sample shipments to monitor laboratory performance. Quality control samples account for a minimum of 15% of the samples submitted, and are in addition to the laboratory’s internal quality assurance programs. The Company’s QAQC program is overseen by the Company’s Qualified Person, Dr. Mathew Ball, Ph.D., P.Geo., Exploration Manager for the Company.
Drill core samples from the 2025 and 2026 drill programs were submitted to MSALABS’ analytical facility in Prince George, British Columbia, for sample preparation and PhotonAssayTM analysis. The MSALABS facilities are accredited to the International Standards ISO/IEC 17025 and ISO 9001 standard for gold and multi-element assays, with all analytical methods incorporating quality control materials at defined frequencies and established data acceptance criteria. MSALABS Inc. is independent of the Company.
PhotonAssayTM
The PhotonAssayTM method utilizes gamma ray analysis for gold detection using the Chrysos PhotonAssayTM instrument (PA1408X). This non-destructive, fully automated technique offers high accuracy for analyzing crushed core and pulps. Sample preparation begins with drying and crushing up to 1 kg of material to achieve at least 70% passing through a 2-millimetre (mm) sieve. The sample is then riffle split to obtain a suitable subsample for 2 testing cycles (MSALABS Method CPA-Au1).
The PhotonAssayTM instrument bombards 400 to 600-gram samples contained in sealed containers with gamma rays. These containers remain sealed throughout the process, preserving the sample for potential further testing. The analysis is performed robotically, with results that integrate into existing laboratory management systems.
Each sample is accompanied by a reference disc traceable to a Certified Reference Material (CRM). Both the sample and reference disc undergo gamma ray exposure, with signals detected and analyzed to ensure accurate and reliable results.
The method offers a gold detection range from 0.015 parts per million (ppm – lower limit) to 10,000 ppm (upper limit). Quality control includes the use of reference materials and blanks, with all results reviewed by a competent person before reporting.
Spanish Mountain Gold implemented two QAQC methodologies to validate the accuracy of PhotonAssayTM results, both demonstrating good comparability: 1) comparative analysis of diverse mineralization styles using Total Au screen metallic methods with both FAS-415 (gravimetric finish) and FAS-211 (AAS finish), and 2) comprehensive testing of both sample aliquots and rejects using FAS-211 (AAS finish).
Multi-Elemental Analysis
For the 2025-2026 drilling campaign, Spanish Mountain Gold used MSALABS code IMS-230 method to provide multi-element determination using a four-acid digestion followed by ICP-OES and ICP-MS analysis.
Key Process Steps:
Sample Preparation: Samples are dried and ground to specific criteria (85% passing 75 microns (µm) for rocks and drill core; 180µm for soils and sediments). A homogeneous 10-gram sample is required.
Digestion: Samples undergo sequential digestion with nitric, perchloric, hydrofluoric, and hydrochloric acids, followed by dilution with deionized water. Analysis: The solution is analyzed via ICP-OES and ICP-MS for multi- element quantification. Quality Control: The process includes reference materials, blanks, and duplicates, with corrections for spectral interferences and thorough review before final reporting.
Qualified Persons
Various consultants provided input and helped write the forthcoming PEA Update Technical Report. Consultants that are responsible for elements of the Technical Report are independent qualified persons as defined within NI 43-101.
– Integrating Qualified Person and Economic Evaluation: Amanda Fitch, P.Eng., BBA Engineering Ltd.
– Geology: Ron Voordouw, P.Geo., Equity Exploration
– Mineral Resource for Main Deposit: Bahram Bahrami, P.Geo., Equity Exploration
– Mineral Resource for Phoenix Deposit: Bahram Bahrami, P.Geo., Equity Exploration
– Metallurgy, Processing: Colin Hardie, P.Eng., BBA Engineering Ltd.
– Mining: Marc Schulte, P.Eng., Moose Mountain Technical Services
– Infrastructure, Tailings and Water Management: Brad Russell, P.Eng., BGC
– Water Treatment: AJ MacDonald, P.Eng, Integrated Sustainability
– Geochemistry: Andrea Samuels, P.Geo., pHase Geochemistry
– Off-site Power and Electrical: Neil Brazier, P.Eng., WN Brazier Associates
– Environmental, Permitting & Community: Rolf Schmitt, P.Geo, ERM
– The QPs have reviewed the information in this news release that pertains to the sections of the forthcoming PEA Update Technical Report for which they are responsible. All scientific and technical information in this press release in respect of the PEA Update is based on information prepared by or under the supervision of those individuals. The Mineral Resource estimate in this news release has been classified in accordance with CIM Definition Standards For Mineral Resources and Mineral Reserves (May 14, 2014) and CIM Estimation of Mineral Resources & Mineral Reserves Best Practice Guidelines (November 29, 2019).
In accordance with NI 43-101, the PEA Technical Report will be filed on SEDAR within 45 days of the disclosure of this news release.
Dr. Mathew Ball, Phd., P.Geo., Exploration Manager with Spanish Mountain Gold, is the Qualified Person as defined under National Instrument 43-101 who has reviewed and has approved the contents of this news release.
About the Company
Spanish Mountain Gold Ltd. is focused on advancing its 100%-owned Spanish Mountain Gold Project towards construction of the next gold mine in the Cariboo Gold Corridor, British Columbia. The Company will publish, within 45 days of this news release, a new NI 43-101 Technical Report setting out the new executable vision to advance the Project. This new NI 43-101 Technical Report, with a de-risked and optimized Preliminary Economic Assessment with an updated Mineral Resource Estimate, will supersede the prior technical report of the Company. On May 1, 2026, the Company received the first instalment of US$22.5 million in connection with the sale of a 1.5% NSR to Wheaton Precious Metals for US$55 million (see news release from May 1, 2026). In Q2 2026, the Company initiated a feasibility study on the Project, which is fully funded and will position the Company to make a construction decision in H1 2028.
The Company is seeking new ways to achieve optimal financial outcomes that are safer, minimize environmental impact and create meaningful sustainability for communities, which the Company terms “The Relentless Pursuit of Better Gold”. Details on the Company are available on www.sedarplus.ca and on the Company’s website: www.spanishmountaingold.com.
Brutus Mining Inc. (CSE: BRU) (FSE: ZI3) is pleased to announce that it has closed its non-brokered ... READ MORE
Jaguar Uranium Corp. (NYSE American: JAGU) is pleased to announce an independent Mineral Resource E... READ MORE
Auro Metals Inc. (TSX-V: AURO) (OTCQB: AURFF), is pleased to announce the assay results of the fina... READ MORE
Endeavour Silver Corp. (NYSE: EXK) (TSX: EDR) is pleased to announce that repairs to the primary bal... READ MORE
Scorpio Gold Corp. (NASDAQ: SGLD) (TSX-V: SGLD) (OTCQB: SRCRF) (FSE: RY9) is pleased to announce re... READ MORE


