


Silver Storm Mining Ltd. (TSX-V: SVRS) (OTC: SVRSF) (FSE: SVR), is pleased to announce the results of an updated Mineral Resource estimate reported in compliance with National Instrument 43-101 Standards of Disclosure for Mineral Projects for the Company’s 100% owned La Parrilla Silver Mine Complex, located in Durango Mexico. The Updated Mineral Resource Estimate was completed by David F. Machuca-Mory, PhD, PEng, of SRK Consulting (Canada) Inc.
Highlights of the Updated Mineral Resource Estimate include:
Greg McKenzie, President and CEO, commented, “We are incredibly pleased with this latest resource update. We achieved a material 107% increase in Indicated Resources and there was also a significant increase in Inferred Resources at La Parrilla. With further drilling, we would expect to maintain a continued conversion rate. The Company is now very well positioned, having a fully permitted silver mine complex, with a sizable Mineral Resource endowment that could potentially feed the La Parrilla processing plant for several years.
Our sizable Mineral Resource growth in both classification categories is a testament to the hard work and dedication of the team including Will Ansley, COO and Bruce Robbins, P.Geo, our exploration personnel, operating employees and drilling contractor. Silver Storm completed 18,626 metres of underground drilling, demonstrating that the previously mined zones continue down plunge and in certain cases even show improved grade and thickness at depth. This significant growth in Mineral Resources enhances the potential of our project, supports our goal to restart the mine and join the exclusive rank of silver producers.”
The wireframe models of the veins contributing to the updated Mineral Resource Estimate of Rosarios and Quebradillas mines are presented in Figure 1 and Figure 2, respectively.
Mineral Resources Summary
Indicated Mineral Resources are estimated at 1,197,000 tonnes grading 280 g/t Ag.Eq* (187 g/t Ag, 0.10 g/t Au, 1.56% Pb, 1.69% Zn) which equates to 7.2 million ounces Ag, 3,900 ounces (“oz”) Au, 18,600 t Pb, and 20,300 t Zn or 10.8 Moz Ag.Eq.
Inferred Mineral Resources are estimated at 1,988,000 t grading 255 g/t Ag.Eq (175 g/t Ag, 0.12 g/t Au, 1.27% Pb, 1.42% Zn) which equates to 11.2 Moz Ag, 7,700 oz Au, 25,300 t Pb, and 28,200 t Zn or 16.3 Moz Ag.Eq.
The Updated Mineral Resource Estimate includes an additional 138 core boreholes, totaling 18,626 m, as well as an exhaustive reinterpretation of the mineralized structures, completed after the acquisition of La Parrilla in August 2023. The increased information and understanding of the geological framework resulted in an increase of 74% of the interpreted mineralization volume, which includes 23 additional mineralized structures to the 22 reported mineralized structures in 2023 (Figures 1 & 2).
The Mineral Resource estimation process at La Parrilla is aligned with generally accepted CIM Estimation of Mineral Resources and Mineral Reserves Best Practices Guidelines (November 2019). The Independent qualified person (QP) has applied particular care in the incorporation of the reasonable prospects for eventual economic extraction to Mineral Resources. The QP used a stope optimizer to identify those portions of the block model that can be reasonably expected to be extracted using selective underground mining methods.
Table 1 represents the Mineral Resource Statement for the La Parrilla Mine, effective December 31, 2024.
Figure 3 summarizes the contained metal (Ag.Eq) changes in the Mineral Resources Statement from 2023 to 2024. Additional drilling in 2023 and 2024 confirmed the continuity of vein mineralization, increasing the Indicated Resources Ag.Eq metal content by 107% and increasing Inferred Resources by 22%. respectively. The 23 newly interpreted mineralized structures, enhanced by new drilling and a thorough review of the legacy First Majestic Silver Mineral Resources database, contributed an additional 22% and 44% to the Ag.Eq metal content in Indicated and Inferred Resources, respectively.
Since 2023, the Company has collected significant specific gravity (SG) data, improving confidence in the in-situ density of mineralization in oxidized and sulphide materials, distinct from host rock density. This update has increased the estimated Ag-Eq metal content by over 10%, though these gains are largely offset by updated cut-off grades. Refreshed RPEEE criteria, with revised costs, metal prices and optimization parameters, led to slight reduction of 15% and 10% in the Ag-Eq metal content of Indicated and Inferred Resources, respectively.
Table 1: Mineral Resource Statement*, La Parrilla Mine, Durango, Mexico. SRK Consulting (Canada) Inc., December 31, 2024.
| Category & Mineral Type |
Mine | Quantity (kt) |
Grade | Contained Metal | |||||||||||
| Silver | Gold | Lead | Zinc | Ag-Eq | Silver | Gold | Lead | Zinc | Ag.Eq | ||||||
| (g/t) | (g/t) | (%) | (%) | (g/t) | (koz) | (koz) | (kt) | (kt) | (koz) | ||||||
| Indicated Mineral Resource | |||||||||||||||
| Oxides | |||||||||||||||
| Rosarios | 17 | 636 | 0.07 | 0.00 | 0.00 | 643 | 341 | 0.0 | 0.0 | 0.0 | 345 | ||||
| San Marcos | 100 | 253 | 0.16 | 0.00 | 0.00 | 269 | 818 | 0.5 | 0.0 | 0.0 | 867 | ||||
| Quebradillas | 0.4 | 188 | 0.10 | 0.00 | 0.00 | 197 | 2 | 0.0 | 0.0 | 0.0 | 3 | ||||
| Subtotal Indicated Oxides | 117 | 308 | 0.15 | 0.00 | 0.00 | 322 | 1,162 | 0.6 | 0.0 | 0.0 | 1,215 | ||||
| Sulphides | |||||||||||||||
| Rosarios | 476 | 157 | 0.13 | 1.53 | 1.38 | 243 | 2,403 | 2.1 | 7.3 | 6.6 | 3,723 | ||||
| San Marcos | 73 | 302 | 0.17 | 1.13 | 0.83 | 367 | 708 | 0.4 | 0.8 | 0.6 | 861 | ||||
| Quebradillas | 531 | 172 | 0.05 | 1.99 | 2.47 | 291 | 2,926 | 0.9 | 10.5 | 13.1 | 4,966 | ||||
| Subtotal Indicated Sulphides | 1,079 | 174 | 0.10 | 1.73 | 1.88 | 275 | 6,037 | 3.4 | 18.6 | 20.3 | 9,550 | ||||
| Total Indicated Resources | 1,197 | 187 | 0.10 | 1.56 | 1.69 | 280 | 7,199 | 3.9 | 18.6 | 20.3 | 10,765 | ||||
| Inferred Mineral Resource | |||||||||||||||
| Oxides | |||||||||||||||
| Rosarios | 22 | 297 | 0.08 | 0.00 | 0.00 | 304 | 207 | 0.1 | 0.0 | 0.0 | 212 | ||||
| San Marcos | 220 | 281 | 0.14 | 0.00 | 0.00 | 294 | 1,988 | 1.0 | 0.0 | 0.0 | 2,080 | ||||
| Quebradillas | 17 | 221 | 0.09 | 0.00 | 0.00 | 229 | 123 | 0.0 | 0.0 | 0.0 | 128 | ||||
| Subtotal Inferred Oxides | 259 | 278 | 0.13 | 0.00 | 0.00 | 290 | 2,318 | 1.1 | 0.0 | 0.0 | 2,419 | ||||
| Sulphides | |||||||||||||||
| Rosarios | 864 | 144 | 0.13 | 1.46 | 1.33 | 228 | 4,009 | 3.7 | 12.6 | 11.5 | 6,319 | ||||
| San Marcos | 151 | 220 | 0.22 | 1.09 | 0.69 | 284 | 1,071 | 1.1 | 1.7 | 1.0 | 1,383 | ||||
| Quebradillas | 714 | 164 | 0.08 | 1.54 | 2.20 | 268 | 3,772 | 1.9 | 11.0 | 15.7 | 6,149 | ||||
| Subtotal Inferred Sulphides | 1,729 | 159 | 0.12 | 1.46 | 1.63 | 249 | 8,852 | 6.7 | 25.3 | 28.2 | 13,850 | ||||
| Total Inferred Resources | 1,988 | 175 | 0.12 | 1.27 | 1.42 | 255 | 11,169 | 7.7 | 25.3 | 28.2 | 16,269 | ||||
| *(1) | Block model estimates audited by David F. Machuca-Mory, PhD, PEng, Principal Consultant (Geostatistics), SRK Consulting Canada Inc. | ||||||||||||||
| (2) | Mineral Resources are not Mineral Reserves and do not have demonstrated economic viability. | ||||||||||||||
| (3) | Mineral Resources have been classified in accordance with the Canadian Institute of Mining, Metallurgy and Petroleum (“CIM”) Definition Standards on Mineral Resources and Mineral Reserves. | ||||||||||||||
| (4) | All figures rounded to reflect the relative accuracy of the estimates. | ||||||||||||||
| (5) | Reasonable prospects of eventual economic extraction were considered by applying appropriate cut-off grades, removing unrecoverable portions of the estimates, and reporting within potentially mineable shapes. | ||||||||||||||
| (6) | Metal prices considered were US$24.00 /oz Ag, US$2,000 /oz Au, US$1.00 /lb Pb and US$1.35 /lb zinc. | ||||||||||||||
| (7) | Cut-off grade considered for oxide and sulphide block model estimates were, respectively 165 g/t Ag-Eq and 145 g/t Ag-Eq. They are based on 2017 costs adjusted by the inflation rate and include sustaining costs. | ||||||||||||||
| (8) | Metallurgical recovery used for oxides based on weighted 2015-2017 actuals was 70.1% for silver and 82.8% for gold | ||||||||||||||
| (9) | Metallurgical recovery used for sulphides based on weighted 2015-2017 actuals was 79.6% for silver, 80.1% for gold, 74.7% for lead and 58.8% for zinc. | ||||||||||||||
| (10) | Metal payable applied was 99.6% for silver and 95% for gold in doré produced from oxides. | ||||||||||||||
| (11) | Metal payable applied was 95% for silver, gold, and lead and 85% for zinc in concentrates produced from sulphides | ||||||||||||||
| (12) | Silver equivalent grade is estimated as: Ag.Eq = Ag Grade + [ (Au Grade x Au Recovery x Au Payable x Au Price / 31.1035) + (Pb Grade x Pb Recovery x Pb Payable x Pb Price x 2204.62) + (Zn Grade x Zn Recovery x Zn Payable x Zn Price x 2204.62)] / (Ag Recovery x Ag Payable x Ag Price / 31.1035) | ||||||||||||||
| (13) | Tonnage is expressed in thousands of tonnes; metal content is expressed in thousands of ounces or thousands of tonnes | ||||||||||||||
| (14) | Totals may not add up due to rounding | ||||||||||||||
Sensitivity Analysis
In addition to the base case scenario presented in Table 1, Tables 2 through Table 5 below, provide sensitivity analyses which demonstrate the variation in grade, tonnage and contained metal for the Updated Mineral Resource estimate at various cut-off grades for both sulphide and oxide material at La Parrilla. The sensitivity analysis shows the resiliency of the Mineral Resource to changes in the cut-off grade, which reflect the operating cost and metal pricing environment.
Table 2: La Parrilla Silver Mine – Block Model Quantities and Grade Estimates(*) at Various Cut-Off Grades for Indicated Oxide Material (SRK, 2024)
| Cut-off Grade Ag.Eq (g/t) |
Quantity (kt) |
Grade | Metal Content | ||||
| Silver (g/t) |
Gold (g/t) |
Ag.Eq (g/t) |
Silver (koz) |
Gold (koz) |
Ag.Eq (koz) |
||
| 135 | 163 | 263 | 0.15 | 277 | 1,379 | 0.8 | 1,454 |
| 140 | 155 | 270 | 0.15 | 284 | 1,343 | 0.7 | 1,414 |
| 145 | 148 | 276 | 0.15 | 290 | 1,311 | 0.7 | 1,379 |
| 150 | 140 | 283 | 0.15 | 297 | 1,274 | 0.7 | 1,339 |
| 160 | 124 | 300 | 0.15 | 314 | 1,196 | 0.6 | 1,252 |
| 165 | 117 | 308 | 0.15 | 322 | 1,162 | 0.6 | 1,215 |
| 170 | 110 | 317 | 0.15 | 331 | 1,125 | 0.5 | 1,174 |
| 180 | 98 | 336 | 0.14 | 349 | 1,054 | 0.5 | 1,096 |
| 190 | 86 | 356 | 0.14 | 370 | 984 | 0.4 | 1,020 |
| 200 | 78 | 373 | 0.14 | 386 | 934 | 0.4 | 967 |
| 210 | 69 | 394 | 0.14 | 407 | 873 | 0.3 | 901 |
(*) Figures in this table should not be misconstrued for a Mineral Resource Statement. The figures are only presented to show the sensitivity of the block model estimates to the selection of a cut-off grade.
Table 3: La Parrilla Silver Mine – Block Model Quantities and Grade Estimates(*) at Various Cut-Off Grades for Indicated Sulphide Material (SRK, 2024)
| Cut-off Grade Ag.Eq (g/t) |
Quantity (kt) |
Grade | Metal Content | ||||||||
| Silver (g/t) |
Gold
(g/t) |
Lead
(%) |
Zinc
(%) |
Ag.Eq
(g/t) |
Silver
(koz) |
Gold
(koz) |
Lead
(kt) |
Zinc
(kt) |
Ag.Eq
(kozt) |
||
| 120 | 1,255 | 161 | 0.10 | 1.60 | 1.74 | 255 | 6,494 | 3.9 | 20.1 | 21.9 | 10,303 |
| 125 | 1,219 | 164 | 0.10 | 1.62 | 1.77 | 259 | 6,411 | 3.8 | 19.8 | 21.5 | 10,159 |
| 130 | 1,185 | 166 | 0.10 | 1.65 | 1.79 | 263 | 6,327 | 3.7 | 19.5 | 21.2 | 10,022 |
| 135 | 1,151 | 169 | 0.10 | 1.67 | 1.82 | 267 | 6,235 | 3.6 | 19.3 | 20.9 | 9,873 |
| 140 | 1,115 | 171 | 0.10 | 1.70 | 1.85 | 271 | 6,142 | 3.5 | 18.9 | 20.6 | 9,715 |
| 145 | 1,079 | 174 | 0.10 | 1.73 | 1.88 | 275 | 6,037 | 3.4 | 18.6 | 20.3 | 9,550 |
| 150 | 1,044 | 177 | 0.10 | 1.75 | 1.91 | 279 | 5,933 | 3.2 | 18.3 | 19.9 | 9,383 |
| 160 | 979 | 182 | 0.10 | 1.81 | 1.96 | 288 | 5,734 | 3.1 | 17.7 | 19.2 | 9,057 |
| 165 | 946 | 185 | 0.10 | 1.84 | 1.99 | 292 | 5,622 | 3.0 | 17.4 | 18.9 | 8,880 |
| 170 | 906 | 189 | 0.10 | 1.87 | 2.03 | 298 | 5,489 | 2.8 | 16.9 | 18.4 | 8,664 |
| 180 | 842 | 195 | 0.10 | 1.93 | 2.09 | 307 | 5,268 | 2.6 | 16.3 | 17.6 | 8,301 |
(*) Figures in this table should not be misconstrued for a Mineral Resource Statement. The figures are only presented to show the sensitivity of the block model estimates to the selection of a cut-off grade.
Table 4: La Parrilla Silver Mine – Block Model Quantities and Grade Estimates(*) at Various Cut-Off Grades for Inferred Oxide Material (SRK, 2024)
| Cut-off Grade Ag.Eq (g/t) |
Quantity (kt) |
Grade | Metal Content | ||||
| Silver (g/t) |
Gold (g/t) |
Ag.Eq (g/t) |
Silver (koz) |
Gold (koz) |
Ag.Eq (koz) |
||
| 135 | 376 | 235 | 0.12 | 246 | 2,843 | 1.5 | 2,983 |
| 140 | 355 | 241 | 0.12 | 253 | 2,756 | 1.4 | 2,889 |
| 145 | 334 | 248 | 0.12 | 260 | 2,667 | 1.3 | 2,793 |
| 150 | 315 | 255 | 0.13 | 267 | 2,584 | 1.3 | 2,704 |
| 160 | 277 | 270 | 0.13 | 282 | 2,406 | 1.1 | 2,514 |
| 165 | 259 | 278 | 0.13 | 290 | 2,318 | 1.1 | 2,419 |
| 170 | 238 | 289 | 0.13 | 301 | 2,210 | 1.0 | 2,305 |
| 180 | 209 | 306 | 0.13 | 319 | 2,059 | 0.9 | 2,141 |
| 190 | 187 | 322 | 0.13 | 334 | 1,938 | 0.8 | 2,010 |
| 200 | 166 | 340 | 0.13 | 352 | 1,816 | 0.7 | 1,881 |
| 210 | 147 | 359 | 0.13 | 371 | 1,699 | 0.6 | 1,754 |
(*) Figures in this table should not be misconstrued for a Mineral Resource Statement. The figures are only presented to show the sensitivity of the block model estimates to the selection of a cut-off grade.
Table 5: La Parrilla Silver Mine – Block Model Quantities and Grade Estimates(*) at Various Cut-Off Grades for Inferred Sulphide Material (SRK, 2024)
| Cut-off Grade Ag.Eq (g/t) |
Quantity (kt) |
Grade | Metal Content | ||||||||
| Silver (g/t) |
Gold (g/t) |
Lead (%) |
Zinc (%) |
Ag.Eq (g/t) |
Silver (koz) |
Gold (koz) |
Lead (kt) |
Zinc (kt) |
Ag.Eq (kozt) |
||
| 120 | 2,112 | 145 | 0.12 | 1.34 | 1.49 | 228 | 9,867 | 8.0 | 28.2 | 31.4 | 15,493 |
| 125 | 2,030 | 148 | 0.12 | 1.36 | 1.52 | 232 | 9,669 | 7.7 | 27.6 | 30.8 | 15,171 |
| 130 | 1,955 | 151 | 0.12 | 1.38 | 1.54 | 236 | 9,479 | 7.5 | 27.1 | 30.2 | 14,859 |
| 135 | 1,884 | 153 | 0.12 | 1.41 | 1.57 | 240 | 9,283 | 7.2 | 26.5 | 29.6 | 14,551 |
| 140 | 1,799 | 157 | 0.12 | 1.44 | 1.60 | 245 | 9,057 | 6.9 | 25.8 | 28.8 | 14,175 |
| 145 | 1,729 | 159 | 0.12 | 1.46 | 1.63 | 249 | 8,852 | 6.7 | 25.3 | 28.2 | 13,850 |
| 150 | 1,649 | 163 | 0.12 | 1.49 | 1.66 | 254 | 8,620 | 6.4 | 24.6 | 27.3 | 13,465 |
| 160 | 1,501 | 169 | 0.12 | 1.54 | 1.71 | 264 | 8,169 | 5.9 | 23.2 | 25.7 | 12,724 |
| 165 | 1,431 | 173 | 0.12 | 1.57 | 1.74 | 269 | 7,944 | 5.6 | 22.5 | 24.9 | 12,351 |
| 170 | 1,368 | 176 | 0.12 | 1.60 | 1.77 | 273 | 7,733 | 5.4 | 21.9 | 24.2 | 12,012 |
| 180 | 1,227 | 184 | 0.12 | 1.66 | 1.83 | 284 | 7,253 | 4.8 | 20.3 | 22.5 | 11,211 |
(*) Figures in this table should not be misconstrued for a Mineral Resource Statement. The figures are only presented to show the sensitivity of the block model estimates to the selection of a cut-off grade.
A technical report is being prepared to support the Updated Mineral Resource Estimate in accordance with NI 43-101 and will be available on the Company’s website and SEDAR within 45 days of the date of this release
Quality Assurance / Quality Control
Silver Storm uses a quality assurance/quality control program that monitors the chain of custody of samples and includes the insertion of blanks, duplicates, and reference standards in each batch of samples sent for analysis. The drill core is photographed, logged, and cut in half, with one half retained in a secured location for verification purposes and one half shipped for analysis. Sample preparation (crushing and pulverizing) is performed at ALS Geochemistry, an independent ISO 9001:2001 certified laboratory, in Zacatecas, Mexico and pulps are sent to ALS Geochemistry in Vancouver, Canada for analysis. The entire sample is crushed to 70% passing -2 mm, and a riffle split of 250 grams is taken and pulverized to better than 85% passing 75 microns. Samples are analyzed for gold using a standard fire assay with Atomic Absorption Spectrometry (AAS) (Au-AA23) from a 30-gram pulp. Gold assays greater than 10 g/t are re-analyzed on a 30-gram pulp by fire assay with a gravimetric finish (Au-GRA21). Samples are also analyzed using a 34 element inductively coupled plasma (ICP) method with atomic emission spectroscopy (AES) on a pulp digested by four acids (ME-ICP61). Overlimit sample values for silver (>100 g/t), lead (>1%), zinc (>1%), and copper (>1%) are re-assayed using a four-acid digestion overlimit method with ICP-AES (ME-OG62). For silver values greater than 1,500 g/t, samples are re-assayed using a fire assay with gravimetric finish on a 30-gram pulp (Ag-GRA21). Samples with lead values over 20% are re-assayed using volumetric titration with EDTA on a 1-gram pulp (Pb-VOL70). No QA/QC issues were noted with the 2023-24 drill results.
From 2007 to 2012, First Majestic Silver implemented a quality control program to evaluate silver assay results from La Parrilla Laboratory for chip and core samples by submitting one core sample for every 20 original samples to Inspectorate in Reno, Nevada for duplicate check assaying. Check assays of channel samples were performed by SGS Durango. From 2013 to 2014, quality control samples included duplicates, in-house standard reference materials (SRMs) and blanks, with an overall quality control insertion rate of about 5%. The quality control procedure was updated in 2015 to include quarter core field duplicates, coarse and pulp duplicates, certified reference materials (CRMs) and blanks, with an overall quality control insertion rate of about 16%.
In the opinion of the Independent QP, the quality of the analytical data collected for silver, gold, lead and zinc from San Marcos, Rosarios, and Quebradillas resource areas is sufficiently reliable to support Mineral Resource estimation. Sample preparation, analysis, and security by Silver Storm and FMS are generally performed in accordance with industry best practice standards.
In the opinion of the Independent QP, a reasonable level of verification has been completed and no material issues would have been left unidentified from the verification programs undertaken. Drill data are typically verified prior to Mineral Resource estimation through software program checks, comparison to original hard copy data, and peer review. The quality of the drill data is sufficiently reliable to support Mineral Resource estimation.
Qualified Person
The Independent Qualified Person for the Mineral Resource Estimate disclosure is Dr. David Machuca-Mory, PEng, of SRK Consulting (Canada) Inc., who has reviewed and approved the contents of this release. In accordance with NI 43-101 Standards of Disclosure for Mineral Projects, Bruce Robbins, PGeo, is the Qualified Person for the Company and has validated and approved the technical and scientific content of this news release.
Information Concerning Estimates of Mineral Resources
The scientific and technical information in this news release was prepared in accordance with NI 43-101 which differs significantly from the requirements of the U.S. Securities and Exchange Commission. The terms “Measured Mineral Resource”, “Indicated Mineral Resource” and “Inferred Mineral Resource” used in this news release are in reference to the mining terms defined in the Canadian Institute of Mining, Metallurgy and Petroleum Standards (the “CIM Definition Standards”), which definitions have been adopted by NI 43-101. Accordingly, information contained in this news release providing descriptions of our mineral deposits in accordance with NI 43-101 may not be comparable to similar information made public by other U.S. companies subject to the United States federal securities laws and the rules and regulations thereunder.
You are cautioned not to assume that any part or all of Mineral Resources will ever be converted into Reserves. Pursuant to CIM Definition Standards, “Inferred Mineral Resources” are that part of a Mineral Resource for which quantity and grade or quality are estimated on the basis of limited geological evidence and sampling. Such geological evidence is sufficient to imply but not verify geological and grade or quality continuity. An Inferred Mineral Resource has a lower level of confidence than that applying to an Indicated Mineral Resource and can not be converted to a Mineral Reserve. However, it is reasonably expected that the majority of Inferred Mineral Resources could be upgraded to Indicated Mineral Resources with continued exploration. Under Canadian reporting guidelines, estimates of Inferred Mineral Resources may not form the basis of feasibility or pre-feasibility studies, except in rare cases. Investors are cautioned not to assume that all or any part of an Inferred Mineral Resource is economically or legally mineable. Disclosure of “contained ounces” in a Mineral Resource is permitted disclosure under Canadian regulations; however, the SEC normally only permits issuers to report mineralization that does not constitute “Reserves” by SEC standards as in place tonnage and grade without reference to unit measures.
Canadian standards, including the CIM Definition Standards and NI 43-101, differ significantly from standards in the SEC Industry Guide 7. Effective February 25, 2019, the SEC adopted new mining disclosure rules under subpart 1300 of Regulation S-K of the United States Securities Act of 1933, as amended (the “SEC Modernization Rules”), with compliance required for the first fiscal year beginning on or after January 1, 2021. The SEC Modernization Rules replace the historical property disclosure requirements included in SEC Industry Guide 7. As a result of the adoption of the SEC Modernization Rules, the SEC now recognizes estimates of “Measured Mineral Resources”, “Indicated Mineral Resources” and “Inferred Mineral Resources”. Information regarding Mineral Resources contained or referenced in this news release may not be comparable to similar information made public by companies that report according to U.S. standards. While the SEC
Modernization Rules are purported to be “substantially similar” to the CIM Definition Standards, readers are cautioned that there are differences between the SEC Modernization Rules and the CIM Definitions Standards. Accordingly, there is no assurance any Mineral Resources that the Company may report as “Measured Mineral Resources”, “Indicated Mineral Resources” and “Inferred Mineral Resources” under NI 43-101 would be the same had the Company prepared the Resource Estimates under the standards adopted under the SEC Modernization Rules.
About Silver Storm Mining Ltd.
Silver Storm Mining Ltd. holds advanced-stage silver projects located in Durango, Mexico. In August 2023 Silver Storm completed the acquisition of 100% of the La Parrilla Silver Mine Complex, a prolific operation which is comprised of a 2,000 tpd mill as well as five underground mines and an open pit that collectively produced 34.3 million silver-equivalent ounces between 2005 and 2019. The Company also holds a 100% interest in the San Diego Project, which is among the largest undeveloped silver assets in Mexico.

Figure 1: Plan View of Mineral Resource Estimate Vein Wireframes at the Rosarios Mine (Graphic: Business Wire)
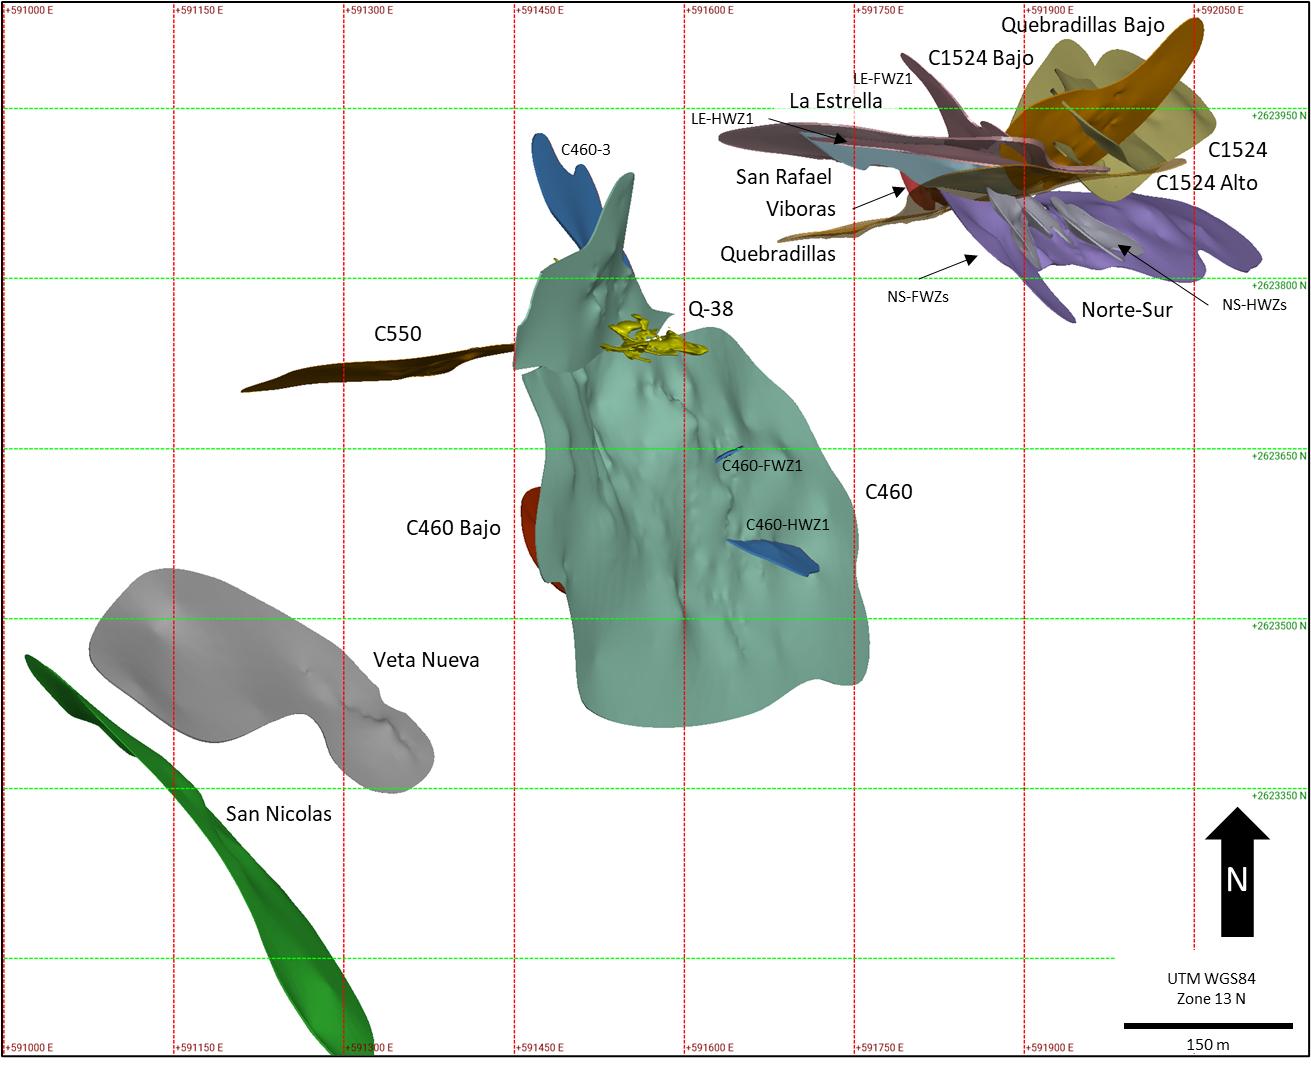
Figure 2: Plan View of Mineral Resource Estimate Vein Wireframes at the Quebradillas Mine (Graphic: Business Wire)
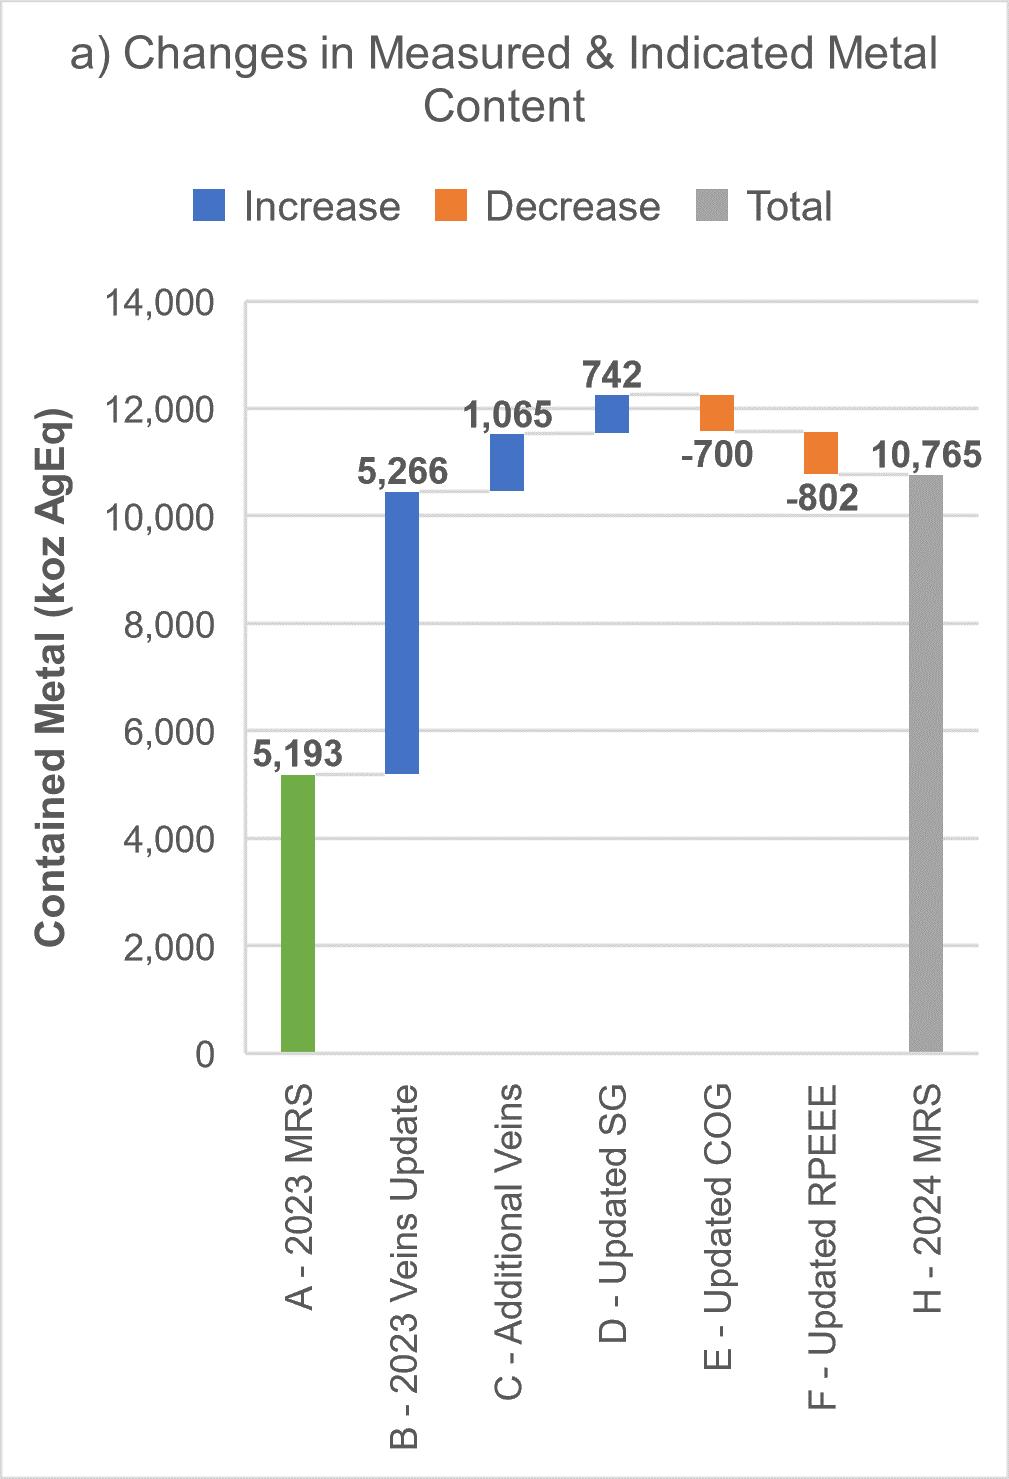
Figure 3: Reconciliation between the 2023 and 2024 Mineral Resources Statements of the La Parrilla Mine (Graphic: Business Wire)
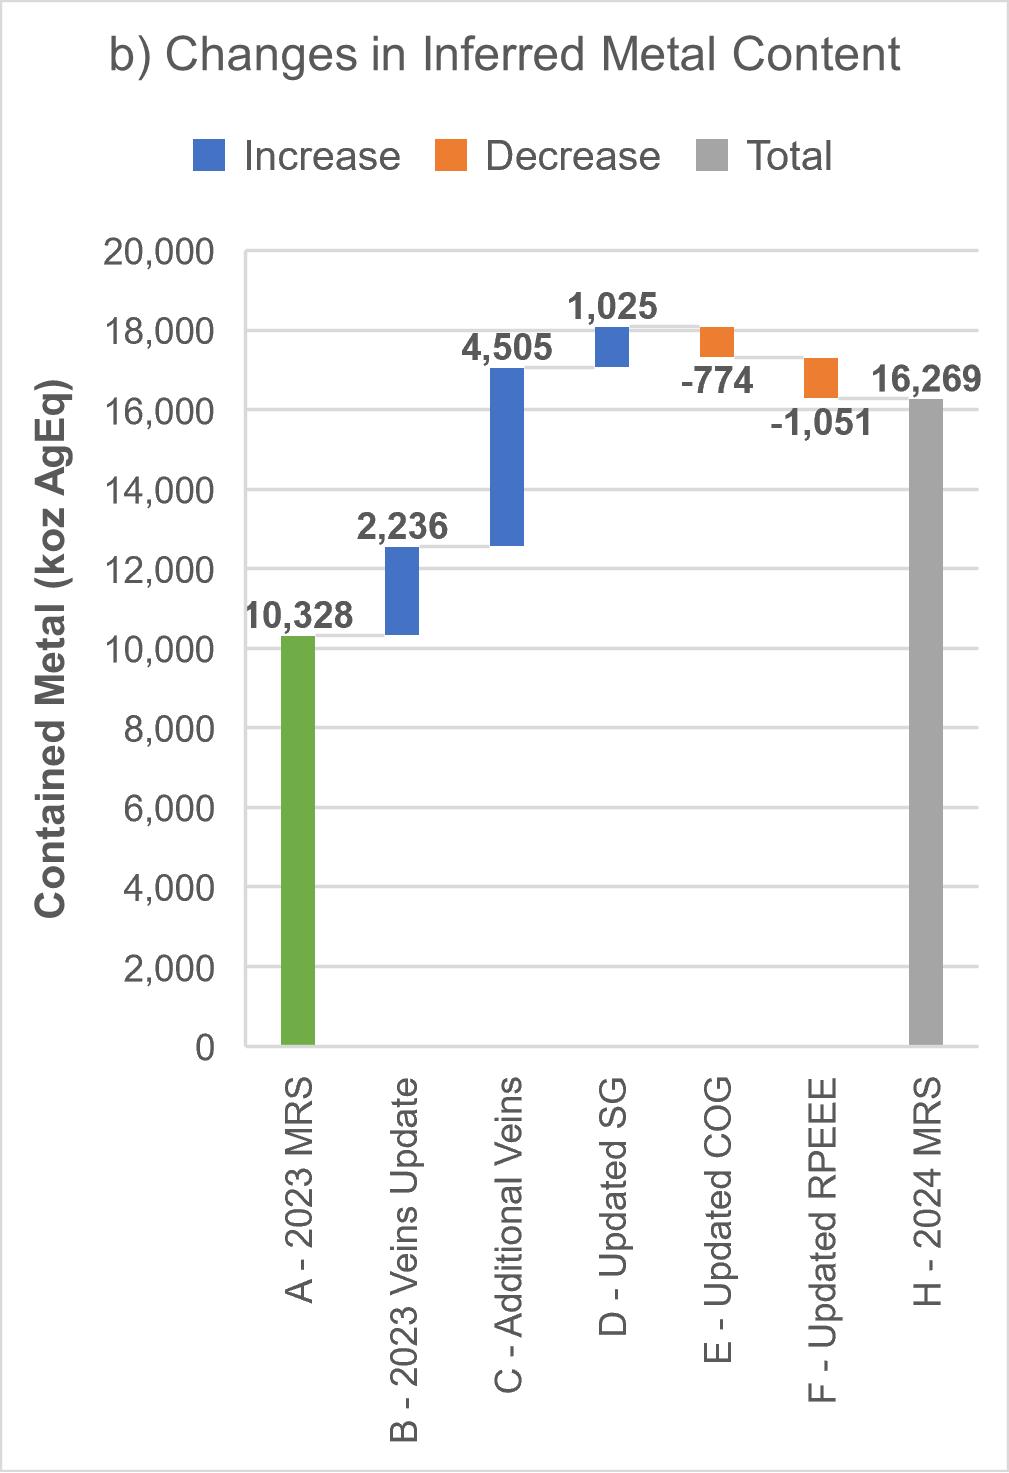
Figure 3: Reconciliation between the 2023 and 2024 Mineral Resources Statements of the La Parrilla Mine (Graphic: Business Wire)
Newmont Corporation (NYSE: NEM) (ASX: NEM) (PNGX: NEM) issued the... READ MORE
Northern Discovery Metals Inc. is pleased to announce that... READ MORE
Pacific Ridge Exploration Ltd. (TSX-V: PEX) (OTCQB: PEXZF) (FSE: ... READ MORE
Completes Geochemical Survey at Nessa Properties in Domeyko Fault... READ MORE
Copper Fox Metals Inc. (TSX-V: CUU) (OTCQX: CPFXF) (FSE: HPU) i... READ MORE


