


Radisson Mining Resources Inc. (TSX-V: RDS) (OTC: RMRDF): is pleased to announce significant high-grade gold intercepts from the 127,600 m exploration drill program completed this summer at its 100% owned O’Brien gold project located along the Larder-Lake-Cadillac Break (see location map 1 and location map 2), halfway between Rouyn-Noranda and Val-d’Or in Quebec, Canada.
Key highlights
Significant intercepts from resource expansion drilling along high-grade trend #1
Current resources along trend #1 are limited down to a vertical depth of approximately 600 m. Drilling completed during this campaign expanded high-grade gold mineralization 350 m below current resources down to 950 m vertical depth. Results have been obtained over a strike length of 100 m, including amongst others 66.70 g/t Au over 4.70 m, 34.71 g/t Au over 3.00 m, 24.22 g/t Au over 3.00 m and 19.43 g/t Au over 3.40 m.
Results are pending for 10 additional directional drill holes (5,000 m) along trend #2 with visible gold showings in 6 of those holes.
“Over the last months, our team has been focused at executing the 127,600 m drill campaign completed this summer. The main objective of the program was to expand the footprint of the O’Brien gold deposit in a 1.2 km corridor located east of the richest mine by grade in Quebec. This corridor represents less than 25% of the prolific package owned by Radisson along the Larder-Lake-Cadillac Break and results have been impressive with 152 intercepts grading over 5 g/t Au within 246 holes published. Results from the 42,200 metres drilled along Trend #1 have been spectacular with 60 intercepts over 5 g/t Au, including 27 intercepts over 10 g/t Au within 77 drill holes. High-grade gold mineralization has now been expanded by more than 350 m below current resources along Trend #1.
Our team is now focused on incorporating the drill program and historical results into our geological model. We expect Trend #1 and Trend #2 expansion drilling to contribute significantly to the resource estimate update targeted for completion in the first quarter of 2023.” Commented Denis Lachance, Interim President and Chief Executive Officer.
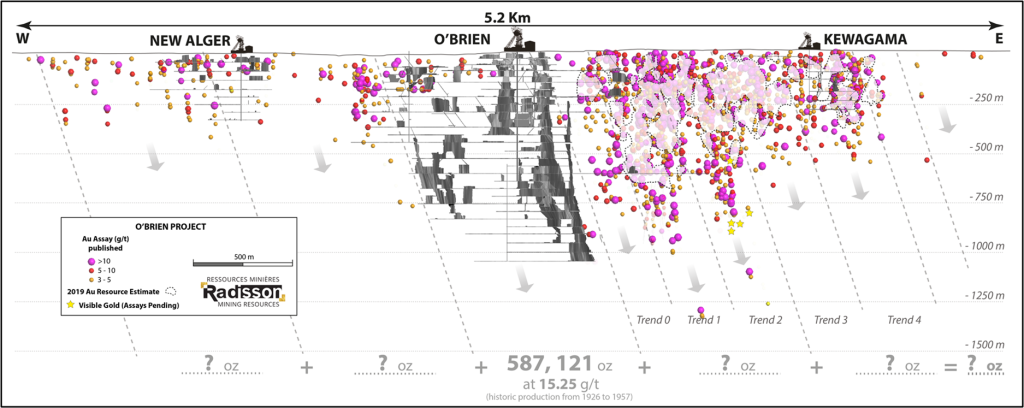
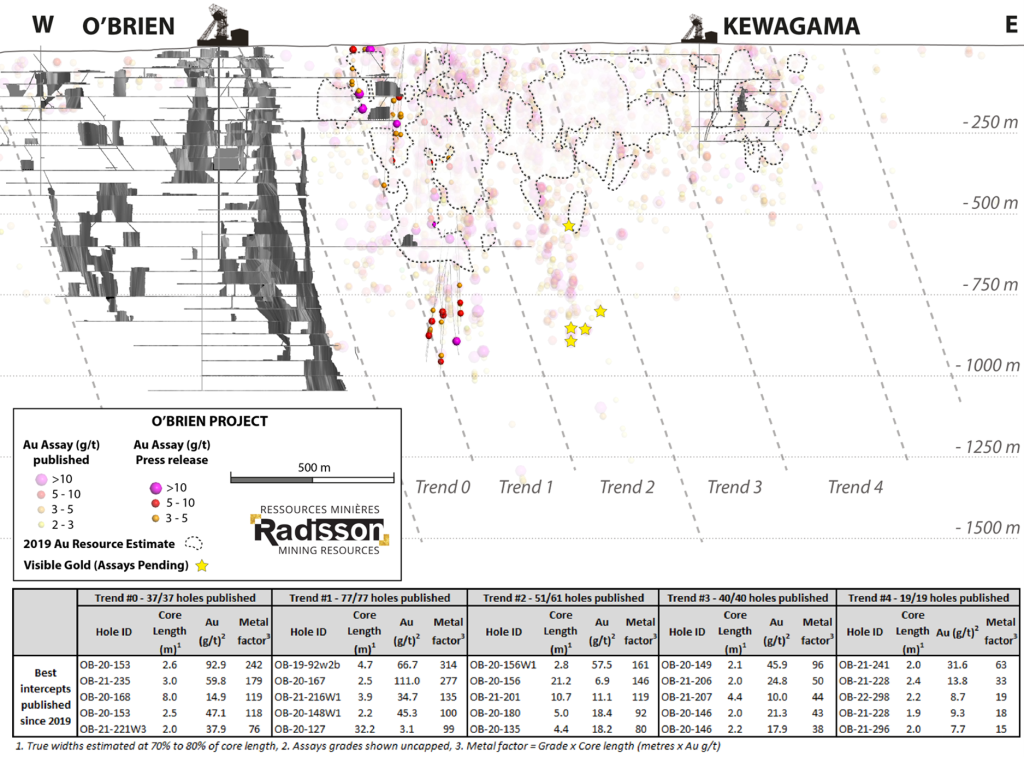
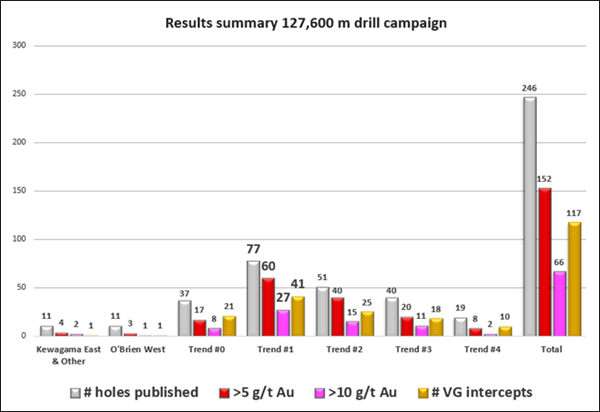
Figure 3. Summary of results published to date
Summary of results published to date
| Sector / Trend | Published results (m) |
# holes published | Number of published intercepts grading, | ||||||||
| # holes published |
# holes with VG |
% holes with VG |
>3 g/t Au |
>5 g/t Au |
>10 g/t Au |
>15 g/t Au |
>20 g/t Au |
>25 g/t Au |
|||
| O’Brien West | 5,700 | 11 | 1 | 9 | % | 5 | 3 | 1 | 1 | 1 | 1 |
| Trend #0 | 18,200 | 37 | 21 | 57 | % | 27 | 17 | 8 | 4 | 4 | 4 |
| Trend #1 | 42,200 | 77 | 41 | 53 | % | 74 | 60 | 27 | 15 | 8 | 7 |
| Trend #2 | 33,200 | 51 | 25 | 49 | % | 51 | 40 | 15 | 9 | 5 | 4 |
| Trend #3 | 16,200 | 40 | 18 | 45 | % | 30 | 20 | 11 | 6 | 3 | 1 |
| Trend #4 | 8,500 | 19 | 10 | 53 | % | 11 | 8 | 2 | 1 | 1 | 1 |
| Kewagama East & Other | 3,600 | 11 | 1 | 9 | % | 4 | 4 | 2 | 1 | 1 | 1 |
| Total | 127,600 | 246 | 117 | 48 | % | 202 | 152 | 66 | 37 | 23 | 19 |
Drill results summary table
| Hole | Zone | From (m) | To (m) | Core Length (m) | Au (g/t) – Uncut |
| OB-21-248 | Trend #1 | ||||
| 414.30 | 416.30 | 2.00 | 5.20 | ||
| OB-21-257 | Trend #1 | ||||
| 185.00 | 187.00 | 2.00 | 4.18 | ||
| AND | 283.00 | 285.30 | 2.30 | 3.84 | |
| AND | 338.40 | 343.70 | 5.30 | 3.48 | |
| Including | 341.10 | 342.20 | 1.10 | 5.00 | |
| OB-21-262 | Trend #1 | ||||
| 15.00 | 17.00 | 2.00 | 16.45 | ||
| Including | 15.00 | 16.00 | 1.00 | 26.90 | |
| OB-21-263 | Trend #1 | ||||
| 11.50 | 13.50 | 2.00 | 4.80 | ||
| Including | 11.50 | 12.50 | 1.00 | 9.56 | |
| OB-21-265 | Trend #1 | ||||
| 206.00 | 208.20 | 2.20 | 18.45 | ||
| Including | 206.70 | 207.60 | 0.90 | 43.00 | |
| AND | 277.00 | 279.00 | 2.00 | 11.58 | |
| Including | 278.00 | 279.00 | 1.00 | 21.40 | |
| OB-21-269 | Trend #1 | ||||
| 627.70 | 631.10 | 3.40 | 3.98 | ||
| Including | 629.45 | 631.10 | 1.65 | 5.36 | |
| AND | 633.00 | 636.00 | 3.00 | 3.50 | |
| Including | 635.10 | 636.00 | 0.90 | 5.89 | |
| AND | 639.40 | 642.50 | 3.10 | 18.76 | |
| Including | 641.60 | 642.50 | 0.90 | 52.50 | |
| OB-21-280 | Trend #1 | ||||
| 618.00 | 620.00 | 2.00 | 10.82 | ||
| Including | 618.00 | 619.00 | 1.00 | 21.60 | |
| OB-21-303W1 | Trend #1 | ||||
| 989.60 | 991.50 | 1.90 | 5.42 | ||
| Including | 990.40 | 991.50 | 1.10 | 8.30 | |
| OB-21-303W2 | Trend #1 | ||||
| 975.00 | 977.60 | 2.60 | 3.54 | ||
| OB-21-303W3 | Trend #1 | ||||
| 659.00 | 661.00 | 2.00 | 12.04 | ||
| Including | 660.00 | 661.00 | 1.00 | 23.40 | |
| AND | 990.00 | 992.00 | 2.00 | 5.20 | |
| Including | 991.00 | 992.00 | 1.00 | 8.15 | |
| OB-21-307 | Trend #1 | ||||
| 553.50 | 555.50 | 2.00 | 15.31 | ||
| Including | 554.50 | 555.50 | 1.00 | 26.30 | |
| OB-21-310 | Trend #1 | ||||
| 262.50 | 265.00 | 2.50 | 5.43 | ||
| Including | 262.50 | 264.00 | 1.50 | 9.03 | |
| OB-22-268 | Trend #1 | ||||
| 539.00 | 541.00 | 2.00 | 3.89 | ||
| Including | 539.00 | 540.00 | 1.00 | 6.62 | |
| OB-22-304W1 | Trend #0 | ||||
| 1,025.00 | 1,027.00 | 2.00 | 3.52 | ||
| Including | 1,025.00 | 1,025.85 | 0.85 | 8.25 | |
| OB-22-304W2 | Trend #1 | ||||
| 1,042.30 | 1,046.30 | 4.00 | 4.91 | ||
| Including | 1,045.30 | 1,046.30 | 1.00 | 13.60 |
Breakdown of drilling completed and pending results
| Sector / Trend | Planned drilling (m) |
Drilled – Results published | Drilled – Results pending | ||||
| metres | # holes | # holes (with VG) |
metres | # holes | # holes (with VG) |
||
| O’Brien West | 5,700 | 5,700 | 11 | 1 | 0 | 0 | 0 |
| Trend #0 | 18,200 | 18,200 | 37 | 21 | 0 | 0 | 0 |
| Trend #1 | 42,200 | 42,200 | 77 | 41 | 0 | 0 | 0 |
| Trend #2 | 33,200 | 28,200 | 51 | 25 | 5,000 | 10 | 4 |
| Trend #3 | 16,200 | 16,200 | 40 | 18 | 0 | 0 | 0 |
| Trend #4 | 8,500 | 8,500 | 19 | 10 | 0 | 0 | 0 |
| Kewagama East / Other | 3,600 | 3,600 | 11 | 1 | 0 | 0 | 0 |
| Total | 127,600 | 122,600 | 246 | 117 | 5,000 | 10 | 4 |
127,600 m of drilling completed to date with assays pending for approx. 5,000 m
This release represents approximately 12,862 m of drilling in 27 drill holes. Released results to date represent approximately 94% of the 127,600 m drilled during the campaign. As of October 15, the company remains well funded with approximately $2.5 m in cash.
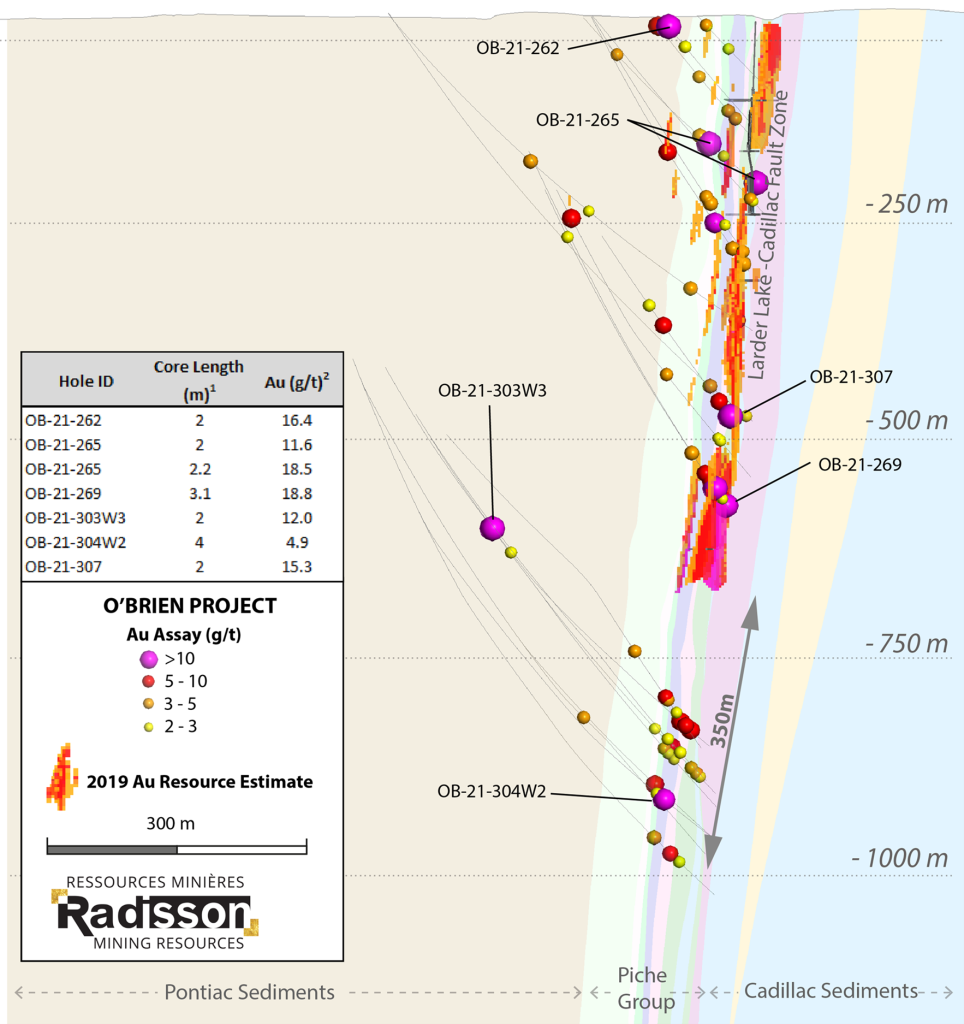
Figure 4. O’Brien Gold Project: Trend #1 cross section
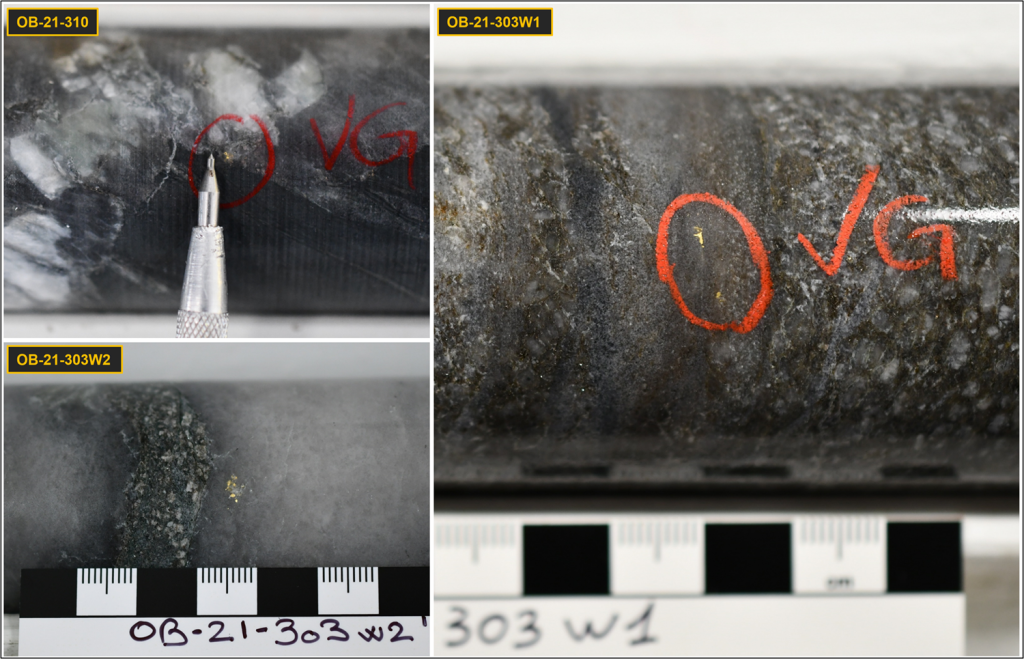
Figure 5. Visible Gold in holes OB-21-310, OB-21-303W1, OB-21-303W2
QA/QC
All drill cores in this campaign are NQ in size. Assays were completed on sawn half-cores, with the second half kept for future reference. The samples were analyzed using standard fire assay procedures with Atomic Absorption (AA) finish at ALS Laboratory Ltd, in Val-d’Or, Quebec. Samples yielding a grade higher than 5 g/t Au Au were analyzed a second time by fire assay with gravimetric finish at the same laboratory. Mineralized zones containing visible gold were analyzed with metallic sieve procedure. Standard reference materials, blank samples and duplicates were inserted prior to shipment for quality assurance and quality control (QA/QC) program.
Qualified Person
Vivien Janvier, P.Geo., Ph.D., Director, Geology for Radisson mining resources Inc. is the qualified person pursuant to the requirements of NI 43-101. Vivien Janvier has reviewed and approved the technical disclosure in this press release.
Radisson mining resources Inc.
Radisson is a gold exploration company focused on its 100% owned O’Brien project, located in the Bousquet-Cadillac mining camp along the world-renowned Larder-Lake-Cadillac Break in Abitibi, Quebec. The Bousquet-Cadillac mining camp has produced over 21,000,000 ounces of gold over the last 100 years. The project hosts the former O’Brien Mine, considered to have been the Quebec’s highest-grade gold producer during its production (1,197,147 metric tons at 15.25 g/t Au Au for 587,121 ounces of gold from 1926 to 1957; Kenneth Williamson 3DGeo-Solution, July 2019).
Aura Minerals Inc. (NASDAQ: AUGO) (B3: AURA33) is pleased to anno... READ MORE
GR Silver Mining Ltd. (TSX-V: GRSL) (OTCQX: GRSLF) (FRANKF... READ MORE
Empress Royalty Corp. (TSX-V: EMPR | OTCQX: EMPYF) is pleased to ... READ MORE
JZR Gold Inc. (TSX-V: JZR) (OTCPK: JZRIF) is pleased to announce ... READ MORE
Colibri Resource Corporation (TSX-V: CBI) is pleased to announce ... READ MORE


