


Discovery Silver Corp. (TSX: DSV) (OTCQX: DSVSF) is pleased to announce results from the Feasibility Study on its 100%-owned Cordero silver project located in Chihuahua State, Mexico. Highlights include (all figures are in US$ unless otherwise noted):
Tony Makuch, CEO, states: “Our Feasibility Study has delivered outstanding results that clearly establish Cordero as one of the world’s leading development-stage projects. Cordero is the largest undeveloped silver project globally based on both reserves and annual production and has low unit costs in support of high margins and substantial cash flow generation. Cordero is also extremely capital efficient, with an initial NPV to Capex ratio of 2.0x, with the NPV almost doubling to over $2 billion by year four following completion of the Phase 2 mill expansion that is primarily funded by internal cash flow. With more than 300 Moz of silver reserves, a mine life of close to 20 years and significant extension potential, Cordero is uniquely positioned to play a key role in closing market deficits in the silver space and in supplying future consumption in high-growth areas including the battery vehicle and solar power sectors.
“Importantly, Cordero will have a major positive socio-economic impact locally in Parral, in the Chihuahua region and at the national level. Cordero will create up to 2,500 jobs during the construction period, 1,000 direct jobs over the mine life, will purchase in excess of $4 billion of goods and services from local and regional suppliers, and will generate $1.4 billion of tax revenues at all levels of government. As part of our proactive approach to water management, we also plan to invest in infrastructure and technology that will support recycling of wastewater produced from local communities for use as our primary source of water for the Project. Our team in Mexico has already won numerous awards for social responsibility, environmental protection and workplace culture and we look forward to expanding on these efforts as part of our commitment to the sustainable development of Cordero and our adherence to the highest industry standards for environmental protection, water management, social responsibility and health and safety.”
FEASIBILITY STUDY SUMMARY
Project Economics
The economics for the FS were based on the following metal prices: Ag – $22.00/oz, Au – $1,600/oz, Pb – $1.00/lb and Zn – $1.20/lb. A 10% increase in metal prices results in a 40% increase in the Project NPV to over $1.6 billion. The payback is 5.2 years due to the expansion of the processing plant from 26,000 tpd to 51,000 tpd in Year 3 at a capital cost of $291 million. This expansion will be funded from operating cash flow. Completion of the expansion in Year 3 results in a peak Project NPV of $2.2 billion in Year 4.
| Units | Base Case | Base Case Metal Prices +10% |
Base Case Metal Prices -10% |
|
| After-Tax NPV (5% discount rate) | (US$ M) | $1,177 | $1,647 | $707 |
| Internal Rate of Return | (%) | 22.0% | 27.2% | 16.1% |
| Payback | (yrs) | 5.2 | 4.3 | 6.5 |
Note – refer to Appendix C for a more detailed sensitivity analysis.
Production & Costs
Annual production over the life-of-mine is expected to average 33 Moz AgEq. In Years 5 – Year 12 production averages more than 40 Moz AgEq with peak production in Year 8 of 64 Moz AgEq. These production levels position Cordero as one of the largest primary silver mines globally. All-In Sustaining Costs average less than $13.50/oz AgEq over the LOM. These costs were effectively flat in comparison to the PFS due to cost inflationary pressures being offset by improved silver payabilities and reagent cost reductions.
| Units | Year 1 – 4 (Phase 1) |
Year 5 – 12 (Phase 2) |
Year 13 -19 (Phase 2) |
LOM | |
| AgEq Produced – Average/yr1 | (Moz) | 29 | 40 | 28 | 33 |
| AgEq Payable – Average/yr | (Moz) | 26 | 35 | 24 | 29 |
| AgEq Produced – Total | (Moz) | 116 | 323 | 196 | 635 |
| AgEq Payable – Total | (Moz) | 102 | 279 | 169 | 550 |
| All-In Sustaining Cost (AISC)2 | (US$/AgEq oz) | $13.22 | $13.01 | $14.36 | $13.47 |
LOM Production
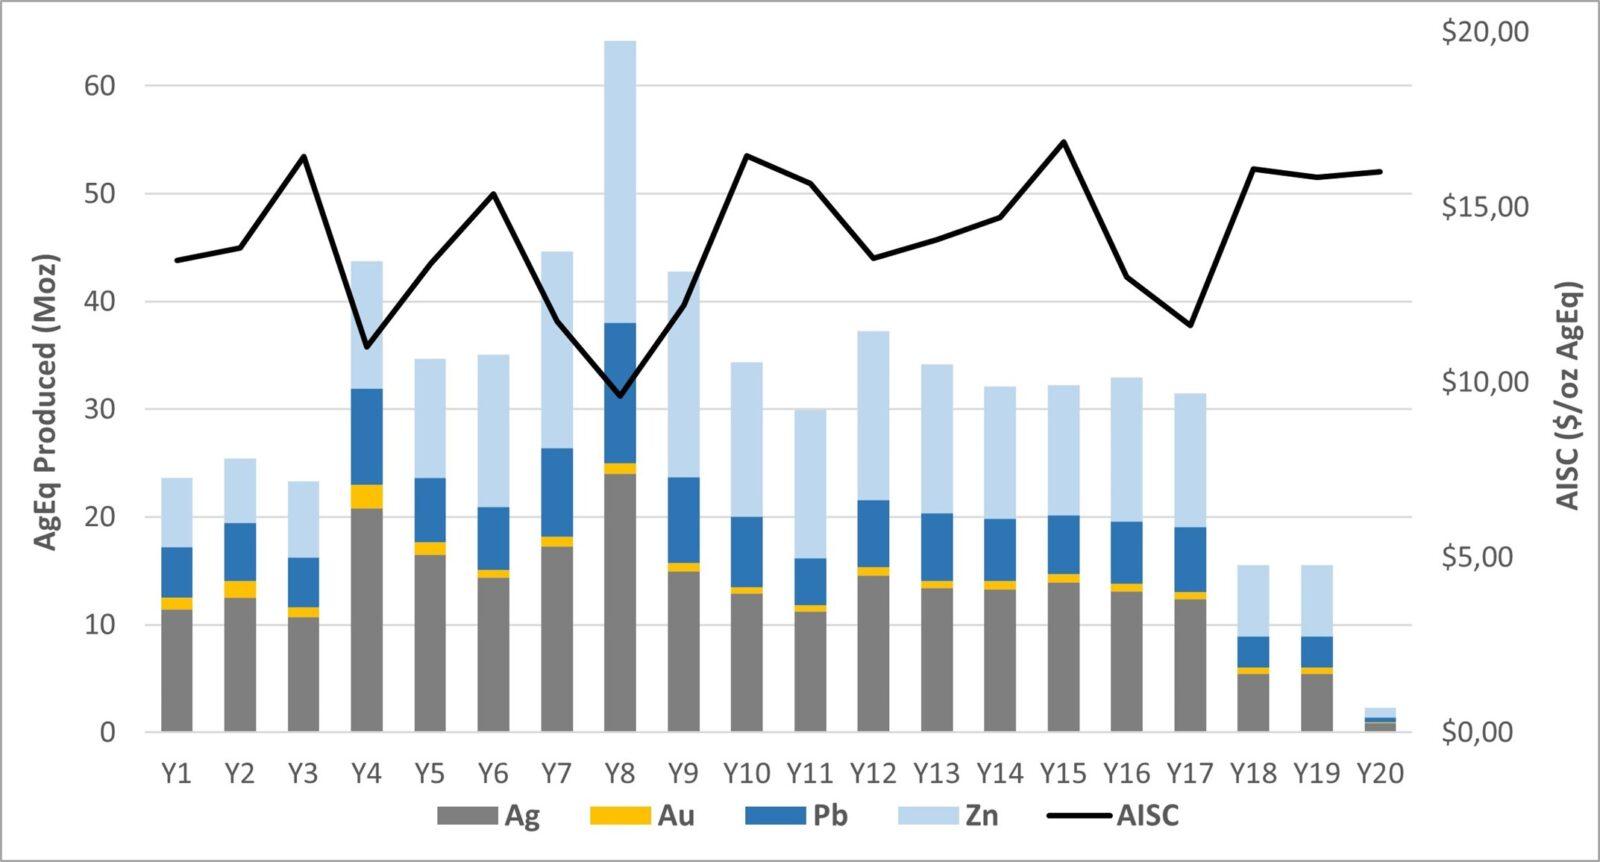
Note – Au/Pb/Zn production is shown on an AgEq basis based on: Ag = $22/oz, Au = $1,600/oz, Pb = $1.00/lb and Zn = $1.20/lb
Study Project Team
The FS was supported by a high-quality project team consisting of the following groups:
Next Steps
The following work is planned for 2024 with the objective of reaching a construction decision later this year or early 2025.
Further details on the Company’s 2024 work program can be found in the news release dated January 24, 2024, and filed under the Company’s profile on www.sedarplus.ca.
Resource Update
In conjunction with the FS, the Mineral Resource Estimate for Cordero has been updated to incorporate an additional 33,400 m of drilling (total drilling of 310,900 m in 793 drill holes). The Measured & Indicated Resource has grown by 70 Moz AgEq to 1,202 Moz AgEq with the Inferred Resource being reduced by 12 Moz AgEq to 155 Moz AgEq as summarized below. The overall expansion of the resource was largely driven by exploration success at depth and in the northeast part of the deposit.
Mineral resources that are not mineral reserves do not have demonstrated economic viability. Further details on the Resource including all supporting technical disclosure are outlined in Appendix A.
CAPITAL EXPENDITURES
Cordero is a very capital-efficient project due to numerous underlying advantages:
Initial Capital (to achieve plant throughput of 9.6 Mt/a)
Initial capital to build Cordero Phase 1 is estimated to total $606 million and will be incurred over a two-year construction period. This capital estimate includes Phase 1 of the process plant with nameplate capacity of 9.6 Mt/a (~26,000 tpd), the construction of on-site infrastructure, a power transmission line, the upgrade of the local water treatment plant and water pipeline, all pre-stripping activities and construction of the TSF starter dam that will provide 3 years of initial tailings storage.
Contingency for the initial capital estimate averages 12% and is applied to direct and indirect costs. Owners costs represent 2.3% of direct costs. Indirect costs represent 16% of direct costs. These proportions are in-line with typical industry averages and are consistent with a cost base for a greenfield project build in Mexico and commensurate with the level of complexity of the project build.
Expansion Capital (to expand plant to 19.2 Mt/a)
The processing facility will be expanded to a nameplate capacity of 19.2 Mt/a (~51,000 tpd) at an estimated cost of $291 million. Most of the costs associated with the expansion will be incurred in Year 3. The expansion includes the addition of parallel grinding and flotation circuits, additional on-site infrastructure and a tailings dam lift that is concurrent with plant expansion.
An expansion of the flotation circuit is planned for Year 7 at a cost of $17 million to accommodate an increase in zinc grades.
Sustaining Capital
Sustaining capital over the LOM totals $388 million (excluding closure costs net of salvage). This includes $221 million to be spent on tailings management facility expansions with the remainder to be spent on mine equipment, the process plant, mobile equipment and replacements/refurbishments of infrastructure assets. Sustaining capital for the process plant has been classified as operating costs under the maintenance category. Sustaining capital for mining only includes down payments on replacement equipment with the remaining lease costs classified as mine operating costs.
| DESCRIPTION (all in US$ millions) | INITIAL CAPITAL |
EXPANSION CAPITAL |
SUSTAINING LOM CAPEX |
TOTAL LOM CAPEX |
| CAPITAL EXPENDITURES | ||||
| Mining | $117 | $2 | $110 | $229 |
| Onsite Infrastructure | $44 | $14 | – | $57 |
| Processing Plant | $210 | $148 | – | $359 |
| Tailings Facility (TSF) | $28 | $60 | $221 | $310 |
| Offsite Infrastructure | $57 | – | $16 | $73 |
| Indirects | $73 | $44 | $11 | $128 |
| Owners Costs | $11 | $4 | – | $14 |
| Contingency | $65 | $37 | $31 | $133 |
| Closure costs / Salvage value | – | – | $75 | $75 |
| Capital Expenditures – Subtotals | $606 | $309 | $463 | $1,377 |
OPERATIONS
Mining
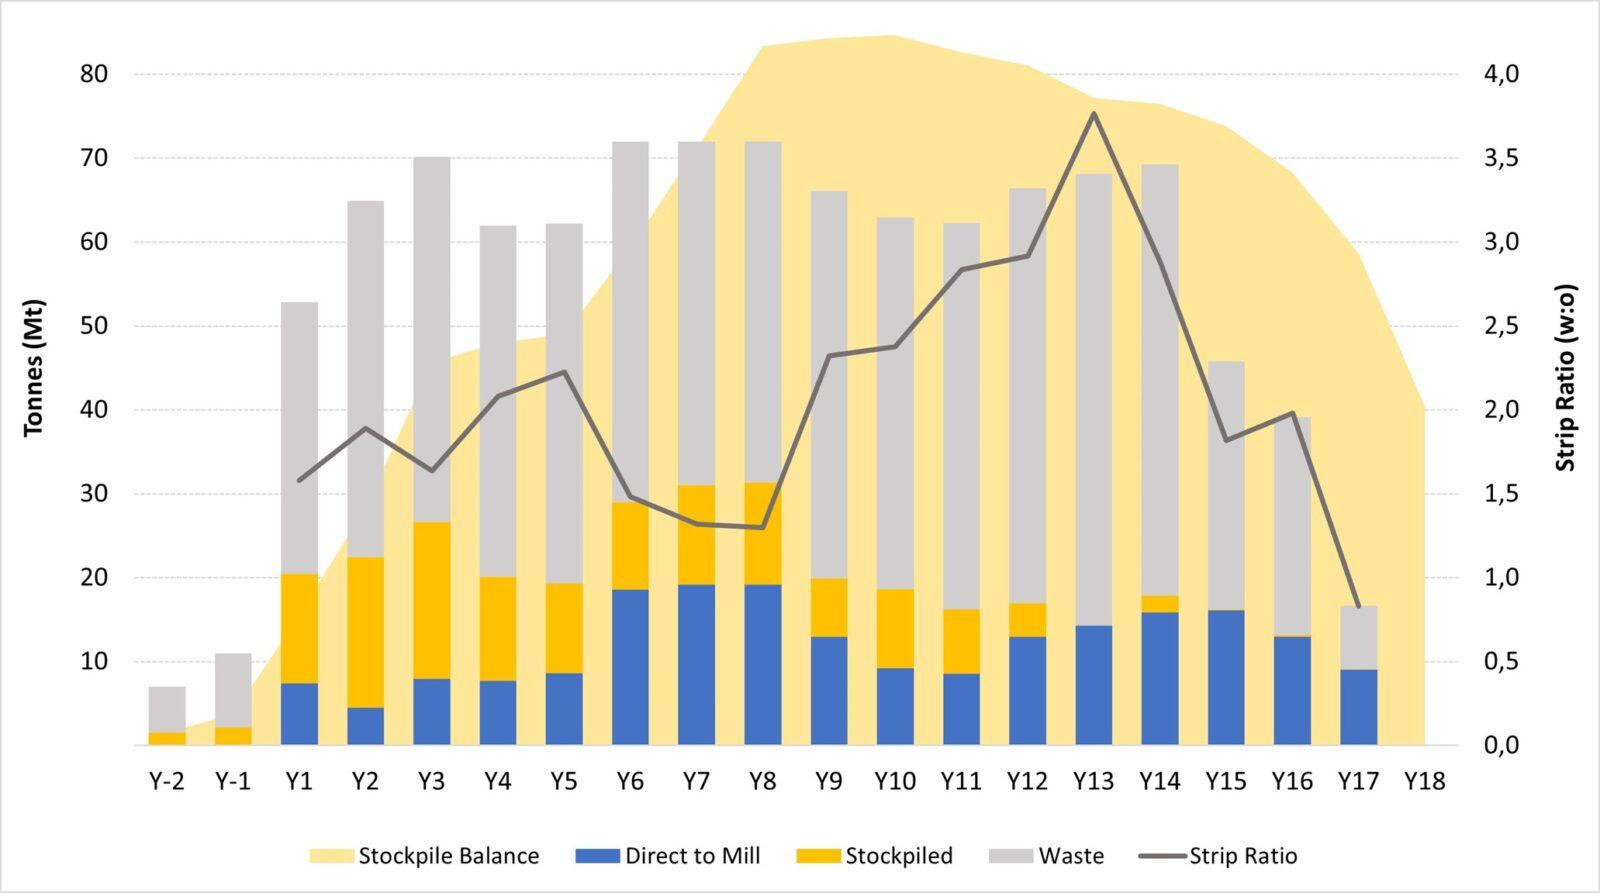
The mine plan incorporates accelerated stripping as well as stockpiling of low-grade material to optimize the grade profile over the LOM.
Processing
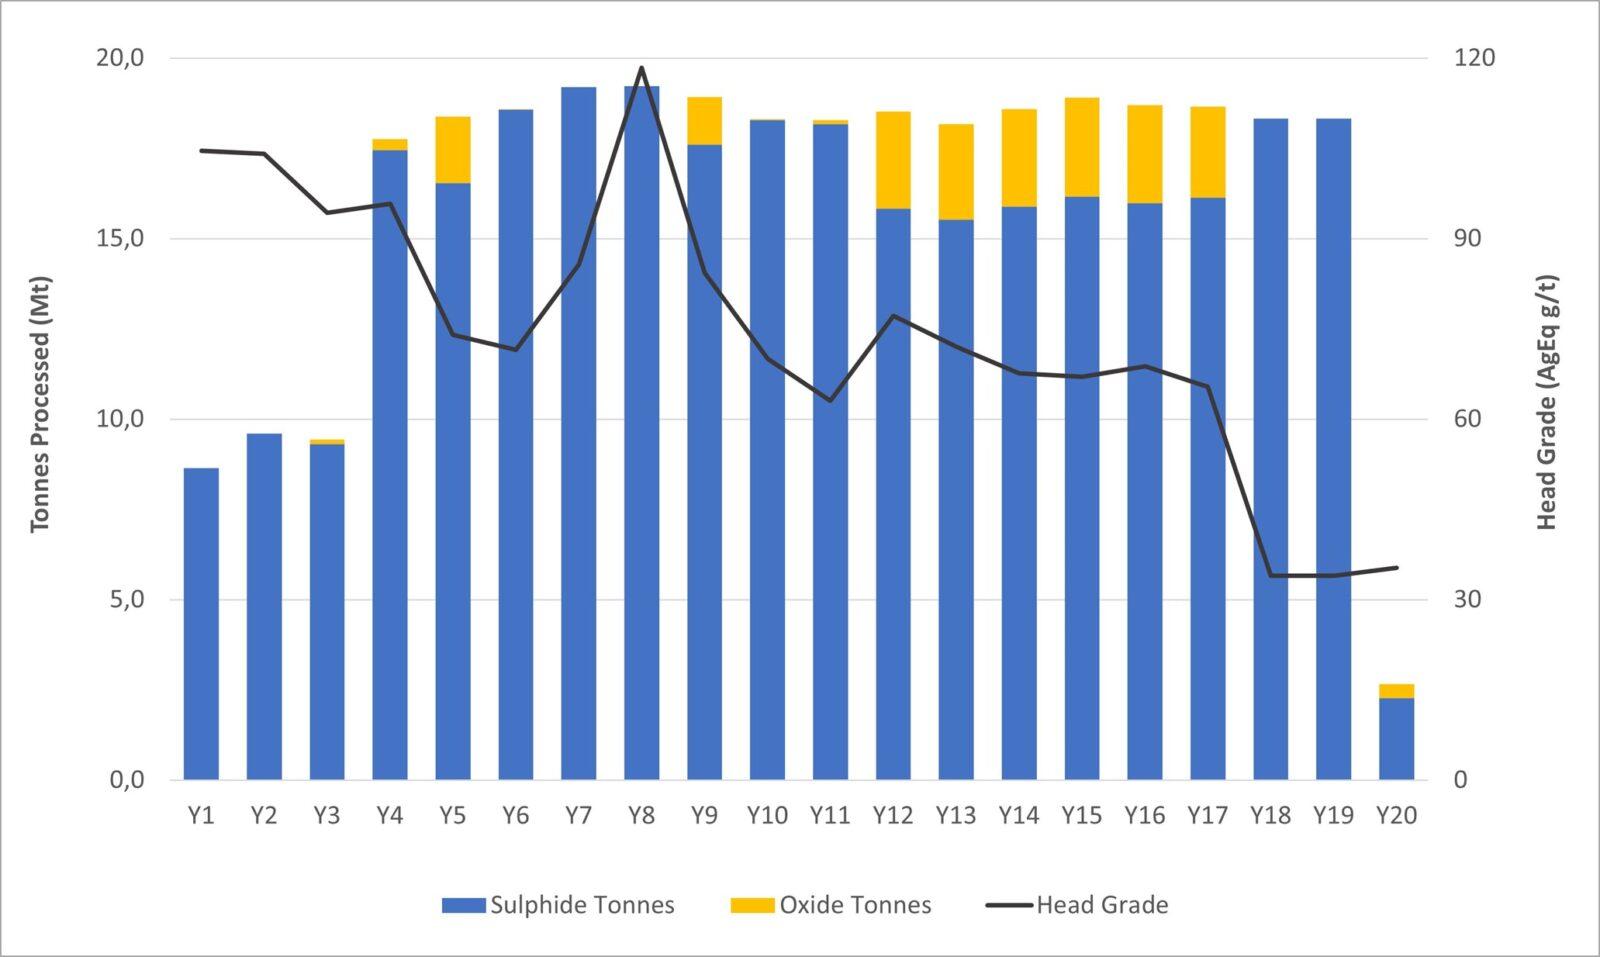
Processing was broken into two main phases to optimize the capital efficiency of the project. Oxides and sulphides are co-processed up to a maximum oxide tonnage proportion of 15% of total mill feed.
Head grades
The mine plan focuses on feeding higher grades to the mill earlier in the mine life:
| TONNES PROCESSED / HEAD GRADES | UNIT | PHASE 1 | PHASE 2 | LOM | |
| Year 1 – 4 | Year 5 – 12 | Year 13 – 19 | |||
| Oxide tonnes processed | (Mt) | 0 | 6 | 14 | 20 |
| Sulphide tonnes processed | (Mt) | 45 | 143 | 119 | 307 |
| Tonnes processed | (Mt) | 45 | 149 | 132 | 327 |
| Head Grades | |||||
| Ag | (g/t) | 42 | 30 | 23 | 29 |
| Au | (g/t) | 0.19 | 0.07 | 0.06 | 0.08 |
| Pb | (%) | 0.57 | 0.44 | 0.32 | 0.41 |
| Zn | (%) | 0.67 | 0.86 | 0.58 | 0.72 |
| AgEq | (g/t) | 99 | 81 | 58 | 74 |
Recoveries
Metal recoveries to the two concentrates are based on the three rounds of detailed metallurgical testwork completed by the Company and are summarized below:
| METALLURGICAL RECOVERIES (weighted average) |
PHASE 1 | PHASE 2 | LOM | |
| Year 1 – 4 | Year 5 – 12 | Year 13 – 19 | ||
| Ag | 91% | 87% | 81% | 87% |
| Au | 28% | 28% | 28% | 28% |
| Pb | 91% | 88% | 81% | 86% |
| Zn | 84% | 86% | 84% | 85% |
Tailings Storage Facility
The TSF was designed adhering to design criteria to minimize risk for its lifecycle in accordance with the Global Industry Standard on Tailings Management (“GISTM”).
OPERATING COSTS
Operating costs are summarized in the table below.
| PARAMETER | UNITS | FS COST |
| OPERATING COSTS | ||
| Mining | $/t mined | 2.35 |
| Mining | $/t milled | 7.35 |
| Processing – Milling (Phase 1) | $/t milled | 6.56 |
| Processing – Milling (Phase 2) | $/t milled | 6.24 |
| Site G&A (Phase 1) | $/t milled | 0.97 |
| Site G&A (Phase 2) | $/t milled | 0.54 |
Mining
Processing
G&A
CONCENTRATE TERMS
Metal Payable
| Ag | Au | Pb | Zn | |
| Precious Metals Concentrate | ||||
| Average concentrate grade LOM | 3,062 | 2.05 | 50% | – |
| Payable metal | 95% | 95% | 95% | – |
| Minimum deduction | 50 g/t | 1 g/t | 3 units | – |
| Zn Concentrate | ||||
| Average concentrate grade LOM | 231 g/t | 0.62 g/t | – | 50% |
| Payable metal | 70% | 70% | – | 85% |
| Deduction | 93 g/t | 1 g/t | – | 8 units |
Treatment/Refining Charges
| PARAMETER | UNITS | FS COST | SPOT | 5-YEAR BENCHMARK AVERAGE |
| TREATMENT/REFINING CHARGES | ||||
| Treatment charge – PM concentrate | $/dmt | $120 | ~$25 | ~$130 |
| Treatment charge – Zn concentrate | $/dmt | $200 | ~$90 | ~$240 |
| Ag refining charge – PM concentrate | $/oz | $1.00 | ~$1.00 | ~$1.10 |
Concentrate Transportation
2024 FS vs 2023 PFS
Summary
The main changes in the FS in comparison to the PFS include:
| PARAMETER | UNITS | 2023 PFS | 2024 FS |
| SUMMARY | |||
| After-Tax NPV (5% discount rate) | (US$ M) | $1,153 | $1,177 |
| Internal Rate of Return | (%) | 28.0% | 22.0% |
| Mine Life | (yrs) | 18 | 19 |
| Initial Capital | (US$ M) | $455 | $606 |
| LOM Capital | (US$ M) | $1,003 | $1,377 |
| Payback | (yrs) | 4.2 | 5.2 |
| OPERATIONS | |||
| Tonnes Processed (LOM – Total) | (Mt) | 302 | 327 |
| Strip ratio (LOM) | (w:o) | 2.1 | 2.0 |
| PRODUCTION & COSTS | |||
| AgEq Produced (LOM – Annual Average) | (Moz) | 33 | 33 |
| AgEq Produced (LOM – Total) | (Moz) | 591 | 635 |
| All-In Sustaining Cost (Y1 – Y12) | (US$/AgEq oz) | $12.82 | $13.07 |
| All-In Sustaining Cost (LOM) | (US$/AgEq oz) | $13.62 | $13.47 |
Project Economics are based on Ag = $22.00/oz, Au = $1,600/oz, Pb = $1.00/lb, Zn = $1.20/lb. See Technical Disclosure section for AgEq and AISC calculation methodology.
Initial Capital Changes
Total initial capital expenditures increased by $151 million as summarized in the table below. The primary drivers behind this increase were:
| DESCRIPTION (all in US$ millions) | 2023 PFS | 2024 FS | Difference |
| INITIAL CAPITAL EXPENDITURES | |||
| Mining | $60 | $117 | $57 |
| Onsite Infrastructure | $31 | $44 | $13 |
| Processing Plant | $156 | $210 | $54 |
| Tailings Facility (TSF) | $45 | $28 | ($17) |
| Offsite Infrastructure | $20 | $57 | $37 |
| Indirects | $61 | $73 | $12 |
| Owners Costs | $13 | $11 | ($2) |
| Contingency | $61 | $65 | $4 |
| Total Initial Capital Expenditures | $455 | $606 | $151 |
TECHNICAL DISCLOSURE:
APPENDIX:
An appendix with the following supporting information can be found at the end of the release.
Appendix A – Mineral Resource Estimate
Appendix B – Mineral Reserve Estimate
Appendix C – After-Tax NPV/IRR/Payback Sensitivities
Appendix D – LOM Mine Plan Summary
Appendix E – LOM Process Throughput Summary
Appendix F – After-Tax Free Cash Flow
Appendix G – Simplified Process Flowsheets
Appendix H – Metallurgical Balance Summary
Appendix I – Site Layout
Appendix J – LOM Production & Cash Flow Schedule
About Discovery
Discovery’s flagship project is its 100%-owned Cordero silver project, one of the world’s largest silver deposits. The FS summarized in today’s release demonstrates that Cordero has the potential to be developed into a highly capital efficient mine that offers the rare combination of large-scale production, low costs and a long mine life. Cordero is located close to infrastructure in a prolific mining belt in Chihuahua State, Mexico.
APPENDIX A – MINERAL RESOURCE ESTIMATE
| Material | Class | Tonnes | Grade | Contained Metal | ||||||||
| Ag | Au | Pb | Zn | AgEq | Ag | Au | Pb | Zn | AgEq | |||
| (Mt) | (g/t) | (g/t) | (%) | (%) | (g/t) | (Moz) | (koz) | (Mlb) | (Mlb) | (Moz) | ||
| Oxide | Measured | 29 | 29 | 0.07 | 0.23 | 0.27 | 49 | 27 | 67 | 148 | 171 | 45 |
| Indicated | 37 | 24 | 0.06 | 0.25 | 0.29 | 44 | 28 | 74 | 207 | 241 | 53 | |
| M&I | 66 | 26 | 0.07 | 0.24 | 0.28 | 46 | 55 | 142 | 355 | 412 | 99 | |
| Inferred | 32 | 19 | 0.03 | 0.26 | 0.33 | 42 | 20 | 35 | 188 | 234 | 43 | |
| Sulphide | Measured | 324 | 24 | 0.07 | 0.34 | 0.63 | 57 | 247 | 745 | 2,413 | 4,473 | 598 |
| Indicated | 329 | 18 | 0.04 | 0.28 | 0.58 | 48 | 190 | 416 | 2,045 | 4,215 | 506 | |
| M&I | 653 | 21 | 0.06 | 0.31 | 0.60 | 53 | 437 | 1,161 | 4,458 | 8,687 | 1,104 | |
| Inferred | 116 | 12 | 0.02 | 0.16 | 0.35 | 30 | 45 | 86 | 418 | 906 | 111 | |
| TOTAL | Measured | 353 | 24 | 0.07 | 0.33 | 0.60 | 57 | 274 | 812 | 2,561 | 4,644 | 643 |
| Indicated | 366 | 19 | 0.04 | 0.28 | 0.55 | 47 | 218 | 490 | 2,252 | 4,456 | 559 | |
| M&I | 719 | 21 | 0.06 | 0.30 | 0.57 | 52 | 493 | 1,303 | 4,813 | 9,099 | 1,202 | |
| Inferred | 149 | 14 | 0.03 | 0.18 | 0.35 | 32 | 65 | 121 | 606 | 1,140 | 155 | |
Supporting Technical Disclosure for Resource
APPENDIX B – MINERAL RESERVE ESTIMATE
| Material | Class | Tonnes | Grade | Contained Metal | ||||||
| Ag | Au | Pb | Zn | Ag | Au | Pb | Zn | |||
| (Mt) | (g/t) | (g/t) | (%) | (%) | (Moz) | (Moz) | (Blb) | (Blb) | ||
| Oxide | Proven | 10 | 46 | 0.08 | 0.35 | 0.38 | 15 | 0.03 | 0.08 | 0.09 |
| Probable | 10 | 40 | 0.09 | 0.40 | 0.42 | 13 | 0.03 | 0.09 | 0.09 | |
| Total P&P | 20 | 43 | 0.08 | 0.37 | 0.40 | 28 | 0.05 | 0.17 | 0.18 | |
| Sulphide | Proven | 212 | 29 | 0.09 | 0.42 | 0.74 | 199 | 0.61 | 1.96 | 3.48 |
| Probable | 95 | 24 | 0.06 | 0.40 | 0.73 | 74 | 0.18 | 0.83 | 1.53 | |
| Total P&P | 307 | 28 | 0.08 | 0.41 | 0.74 | 274 | 0.78 | 2.79 | 5.00 | |
| TOTAL | Proven | 223 | 30 | 0.09 | 0.42 | 0.73 | 214 | 0.64 | 2.04 | 3.57 |
| Probable | 104 | 26 | 0.06 | 0.40 | 0.70 | 87 | 0.20 | 0.91 | 1.62 | |
| Total P&P | 327 | 29 | 0.08 | 0.41 | 0.72 | 302 | 0.84 | 2.96 | 5.18 | |
Supporting Technical Disclosure for Reserves
APPENDIX C: AFTER-TAX NPV / IRR / PAYBACK SENSITIVITIES
Sensitivity of the Project’s NPV, IRR and payback at different Ag and Zn price assumptions is outlined in the table below. For these sensitivities the Au and Pb prices have been fixed at $1,600/oz and $1.00/lb respectively. The Base Case scenario for the FS is highlighted in grey below and assumes Ag – $22.00/oz, Au – $1,600/oz, Pb – $1.00/lb and Zn – $1.20/lb.
| Ag ($/oz) | ||||||||||||||||
| $18.00 | $20.00 | $22.00 | $25.00 | $30.00 | ||||||||||||
| NPV (5%) |
IRR | Payback | NPV (5%) |
IRR | Payback | NPV (5%) |
IRR | Payback | NPV (5%) |
IRR | Payback | NPV (5%) |
IRR | Payback | ||
| (US$M) | (%) | (yrs) | (US$M) | (%) | (yrs) | (US$M) | (%) | (yrs) | (US$M) | (%) | (yrs) | (US$M) | (%) | (yrs) | ||
| Zn ($/lb) |
$1.05 | 602 | 14.7 | 6.9 | 784 | 17.2 | 6.3 | 965 | 19.7 | 5.8 | 1,237 | 23.1 | 4.8 | 1,690 | 28.5 | 4.1 |
| $1.10 | 673 | 15.6 | 6.7 | 854 | 18.1 | 6.2 | 1,036 | 20.4 | 5.6 | 1,308 | 23.8 | 4.8 | 1,761 | 29.2 | 4.0 | |
| $1.20 | 814 | 17.4 | 6.4 | 996 | 19.7 | 5.9 | 1,177 | 22.0 | 5.2 | 1,449 | 25.2 | 4.6 | 1,902 | 30.5 | 3.9 | |
| $1.30 | 955 | 18.9 | 6.1 | 1,137 | 21.2 | 5.5 | 1,318 | 23.4 | 4.9 | 1,590 | 26.6 | 4.4 | 2,043 | 31.7 | 3.8 | |
| $1.45 | 1,167 | 21.2 | 5.7 | 1,348 | 23.4 | 5.1 | 1,530 | 25.5 | 4.7 | 1,802 | 28.6 | 4.2 | 2,254 | 33.5 | 3.7 | |
APPENDIX D – LOM MINE PLAN SUMMARY
APPENDIX E – LOM PROCESS THROUGHPUT SUMMARY
APPENDIX F – AFTER-TAX FREE CASH FLOW

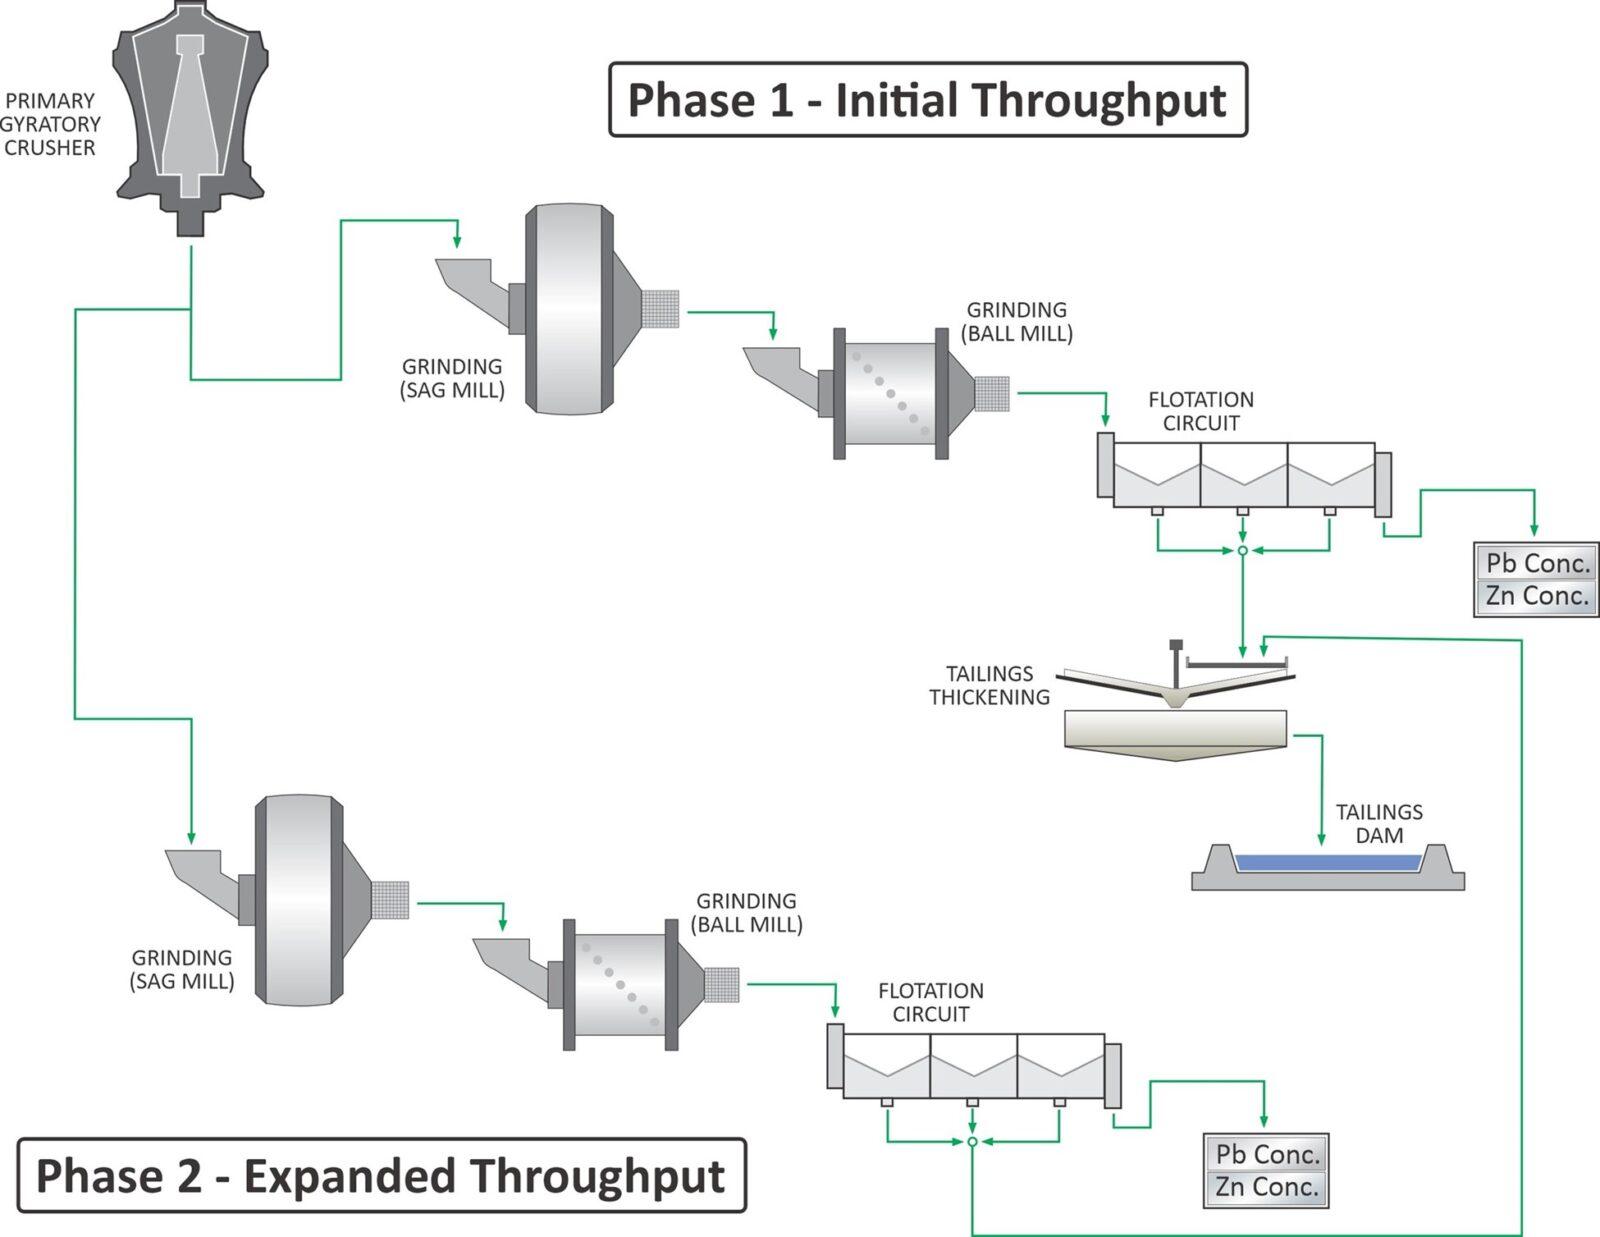
APPENDIX G – SIMPLIFIED PROCESS FLOWSHEETS
PHASE 1 – 26,000 tpd nameplate capacity / PHASE 2 – 51,000 tpd nameplate capacity
APPENDIX H – METALLURGICAL BALANCE SUMMARY
| UNITS | PHASE 1 | PHASE 2 | LOM | ||||||||||||||
| Years 1 – 4 | Years 5 – 12 | Years 13 – 19 | |||||||||||||||
| Ag | Au | Pb | Zn | Ag | Au | Pb | Zn | Ag | Au | Pb | Zn | Ag | Au | Pb | Zn | ||
| MET BALANCE | |||||||||||||||||
| Average head grade | g/t or % | 42 | 0.19 | 0.57 | 0.67 | 30 | 0.07 | 0.44 | 0.86 | 23 | 0.06 | 0.32 | 0.57 | 29 | 0.08 | 0.41 | 0.72 |
| Recovered to Pb Con | % | 83 | 18 | 91 | 5 | 77 | 18 | 88 | 4 | 70 | 18 | 84 | 4 | 77 | 18 | 86 | 5 |
| Recovered to Zn Con | % | 8 | 10 | nm | 85 | 10 | 10 | nm | 86 | 11 | 10 | nm | 85 | 10 | 10 | nm | 85 |
| Tailings | % | 9 | 72 | nm | 10 | 13 | 72 | nm | 10 | 19 | 72 | nm | 11 | 13 | 72 | nm | 10 |
| Total | % | 100 | 100 | 100 | 100 | 100 | 100 | 100 | 100 | 100 | 100 | 100 | 100 | 100 | 100 | 100 | 100 |
| CONCENTRATE GRADES | |||||||||||||||||
| Pb Concentrate | g/t or % | 3,750 | 3.86 | 57 | – | 3,096 | 1.60 | 52 | – | 2,548 | 1.82 | 44 | – | 3,062 | 2.05 | 50 | – |
| Zn Concentrate | g/t or % | 302 | 1.61 | – | 50 | 198 | 0.43 | – | 51 | 273 | 0.59 | – | 50 | 231 | 0.62 | – | 50 |
nm – Pb recovery into the Zn concentrate was not modelled for the purposes of this Study
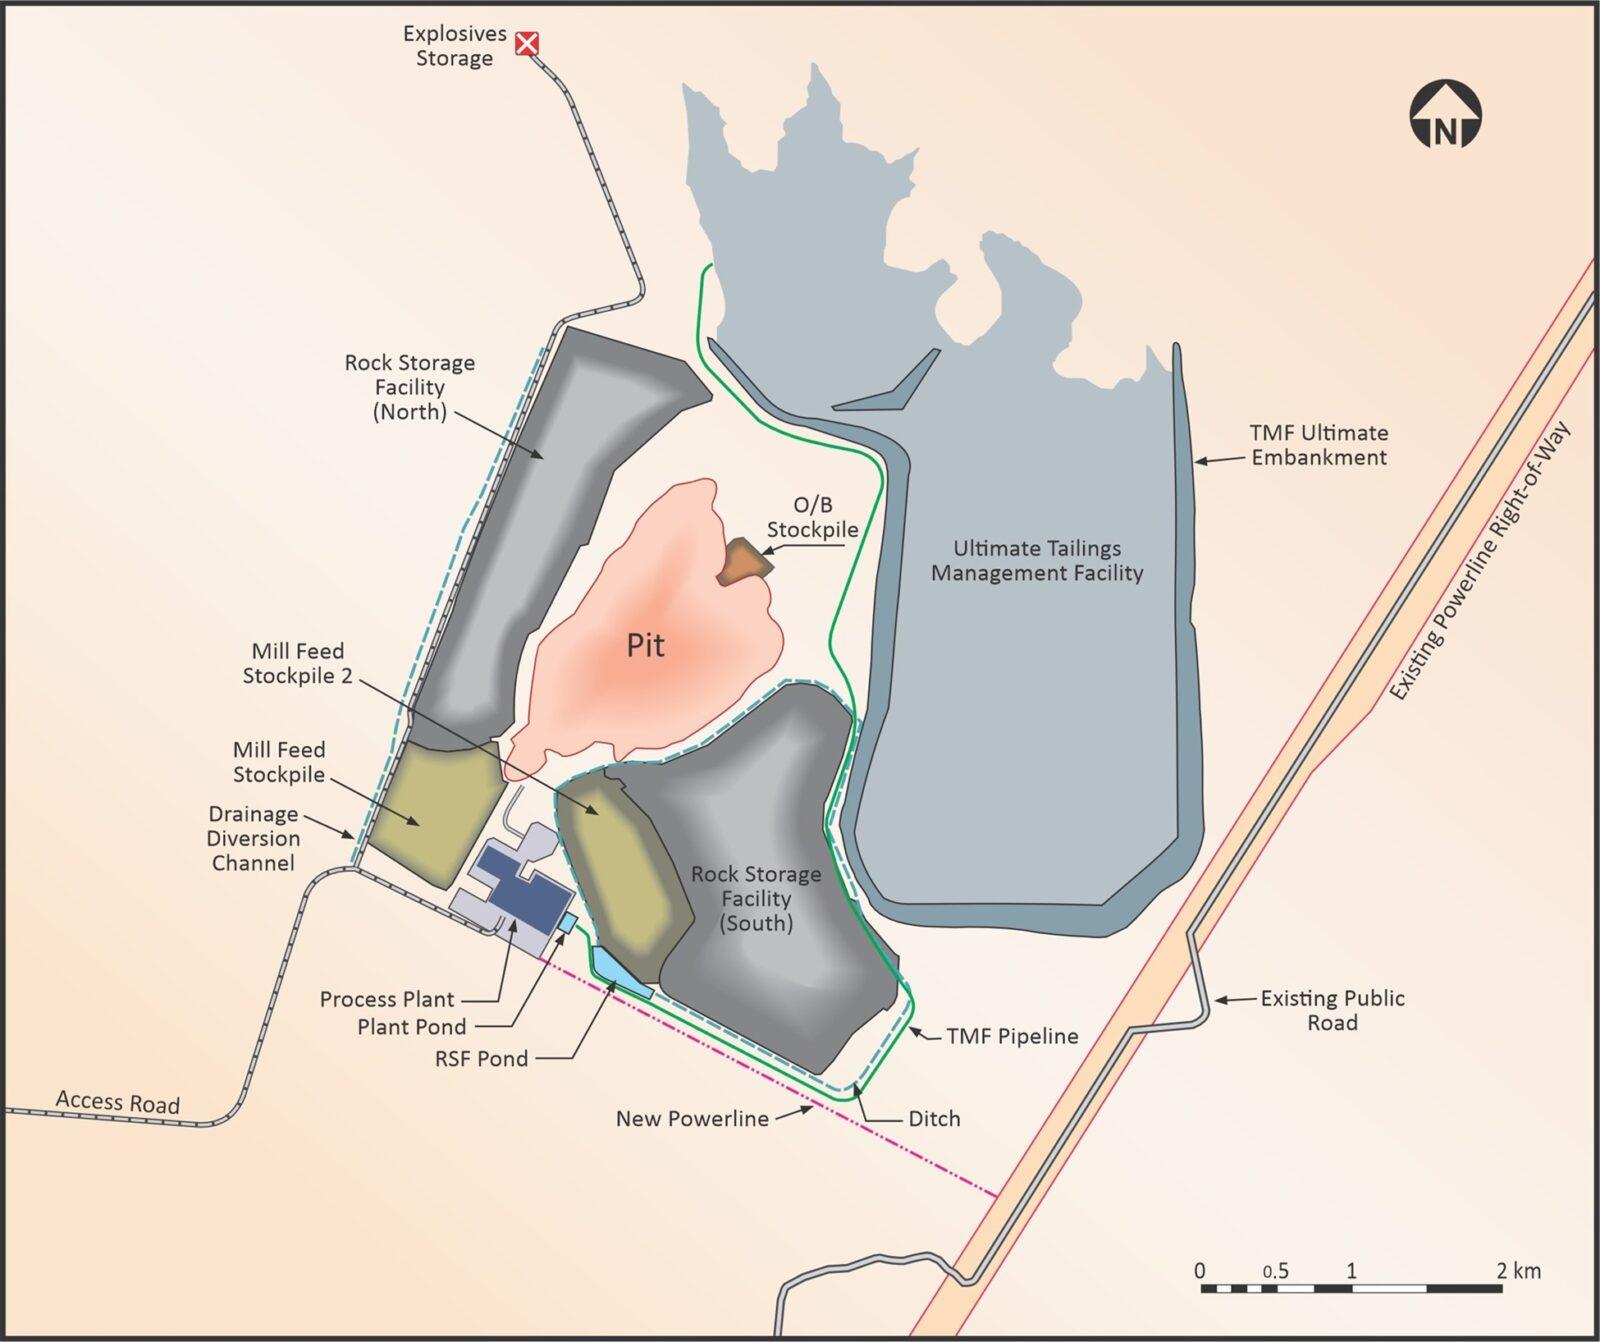
APPENDIX I – SITE LAYOUT:
APPENDIX J – PRODUCTION & CASH FLOW SCHEDULE:
| Units | Total/Avg | Y-2 | Y-1 | Y1 | Y2 | Y3 | Y4 | Y5 | Y6 | Y7 | Y8 | Y9 | Y10 | Y11 | Y12 | Y13 | Y14 | Y15 | Y16 | Y17 | Y18 | Y19 | Y20 | |
| MINING | ||||||||||||||||||||||||
| Mineralized Material Mined* | mt | 347 | 2 | 2 | 20 | 22 | 27 | 20 | 19 | 29 | 31 | 31 | 20 | 19 | 16 | 17 | 14 | 18 | 16 | 13 | 9 | — | — | — |
| Waste Mined | mt | 696 | 5 | 9 | 32 | 42 | 44 | 42 | 43 | 43 | 41 | 41 | 46 | 44 | 46 | 49 | 54 | 51 | 30 | 26 | 8 | — | — | — |
| Total Material Mined | mt | 1,043 | 7 | 11 | 53 | 65 | 70 | 62 | 62 | 72 | 72 | 72 | 66 | 63 | 62 | 66 | 68 | 69 | 46 | 39 | 17 | — | — | — |
| Mining Rate | ktpd | 150 | 19 | 30 | 145 | 178 | 192 | 170 | 170 | 197 | 197 | 197 | 181 | 172 | 171 | 182 | 187 | 190 | 125 | 107 | 46 | — | — | — |
| Strip Ratio | w:o | 2.01 | 3.5 | 4.1 | 1.6 | 1.9 | 1.6 | 2.1 | 2.2 | 1.5 | 1.3 | 1.3 | 2.3 | 2.4 | 2.8 | 2.9 | 3.8 | 2.9 | 1.8 | 2.0 | 0.8 | — | — | — |
| *Mineralized material mined includes 20Mt of above cutoff oxides that are not processed. For ore processed (ie: reserves), see “Processing” section below | ||||||||||||||||||||||||
| PROCESSING | ||||||||||||||||||||||||
| Oxides – Mill Feed: | ||||||||||||||||||||||||
| Ore Tonnes | mt | 20 | — | — | — | — | 0.1 | 0.3 | 1.9 | 0.0 | — | — | 1.3 | 0.0 | 0.1 | 2.7 | 2.6 | 2.7 | 2.7 | 2.7 | 2.5 | — | — | 0.4 |
| Ore Grades: | ||||||||||||||||||||||||
| Ag | g/t | 43.0 | — | — | — | — | 50.8 | 64.7 | 46.0 | 46.0 | — | — | 44.5 | 32.1 | 48.1 | 42.4 | 42.6 | 42.6 | 42.6 | 42.6 | 42.6 | — | — | 22.8 |
| Au | g/t | 0.08 | — | — | — | — | 0.09 | 0.06 | 0.09 | 0.09 | — | — | 0.09 | 0.16 | 0.03 | 0.08 | 0.08 | 0.08 | 0.08 | 0.08 | 0.08 | — | — | 0.07 |
| Pb | % | 0.37% | — | — | — | — | 0.68% | 0.63% | 0.34% | 0.34% | — | — | 0.60% | 0.44% | 0.19% | 0.36% | 0.36% | 0.36% | 0.36% | 0.36% | 0.36% | — | — | 0.20% |
| Zn | % | 0.40% | — | — | — | — | 0.93% | 0.53% | 0.34% | 0.34% | — | — | 0.68% | 0.73% | 0.41% | 0.39% | 0.38% | 0.38% | 0.38% | 0.38% | 0.38% | — | — | 0.24% |
| AgEq | g/t | 76 | — | — | — | — | 113 | 109 | 76 | 75 | — | — | 95 | 85 | 72 | 74 | 74 | 74 | 74 | 74 | 74 | — | — | 43 |
| Sulphides – Mill Feed: | ||||||||||||||||||||||||
| Ore Tonnes | mt | 307 | — | — | 9 | 10 | 9 | 17 | 17 | 19 | 19 | 19 | 18 | 18 | 18 | 16 | 16 | 16 | 16 | 16 | 16 | 18 | 18 | 2 |
| Mill Head Grade: | ||||||||||||||||||||||||
| Ag | g/t | 27.7 | — | — | 44.8 | 44.3 | 38.9 | 39.9 | 31.7 | 28.1 | 31.4 | 41.7 | 27.0 | 25.2 | 23.1 | 27.0 | 24.8 | 24.3 | 25.4 | 23.6 | 22.1 | 12.6 | 12.6 | 12.6 |
| Au | g/t | 0.08 | — | — | 0.19 | 0.25 | 0.15 | 0.19 | 0.10 | 0.06 | 0.07 | 0.08 | 0.06 | 0.05 | 0.05 | 0.06 | 0.05 | 0.06 | 0.06 | 0.06 | 0.05 | 0.05 | 0.05 | 0.05 |
| Pb | % | 0.41% | — | — | 0.59% | 0.61% | 0.54% | 0.56% | 0.39% | 0.36% | 0.48% | 0.73% | 0.48% | 0.40% | 0.28% | 0.42% | 0.43% | 0.38% | 0.36% | 0.38% | 0.40% | 0.16% | 0.16% | 0.16% |
| Zn | % | 0.74% | — | — | 0.73% | 0.61% | 0.73% | 0.65% | 0.61% | 0.75% | 0.92% | 1.29% | 0.99% | 0.77% | 0.74% | 0.89% | 0.80% | 0.69% | 0.66% | 0.75% | 0.69% | 0.35% | 0.35% | 0.35% |
| AgEq | g/t | 74 | — | — | 105 | 104 | 94 | 96 | 74 | 71 | 86 | 118 | 83 | 70 | 63 | 78 | 72 | 67 | 66 | 68 | 64 | 34 | 34 | 34 |
| TOTAL ORE – Mill Feed: | ||||||||||||||||||||||||
| Ore Tonnes | mt | 327 | — | — | 9 | 10 | 9 | 18 | 18 | 19 | 19 | 19 | 19 | 18 | 18 | 19 | 18 | 19 | 19 | 19 | 19 | 18 | 18 | 3 |
| Mill Head Grade: | ||||||||||||||||||||||||
| Ag | g/t | 29 | — | — | 45 | 44 | 39 | 40 | 33 | 28 | 31 | 42 | 28 | 25 | 23 | 29 | 27 | 27 | 28 | 26 | 25 | 13 | 13 | 14 |
| Au | g/t | 0.08 | — | — | 0.19 | 0.25 | 0.15 | 0.19 | 0.10 | 0.06 | 0.07 | 0.08 | 0.06 | 0.05 | 0.05 | 0.06 | 0.05 | 0.06 | 0.06 | 0.06 | 0.05 | 0.05 | 0.05 | 0.05 |
| Pb | % | 0.41% | — | — | 0.59% | 0.61% | 0.55% | 0.56% | 0.38% | 0.36% | 0.48% | 0.73% | 0.49% | 0.40% | 0.28% | 0.41% | 0.42% | 0.38% | 0.36% | 0.38% | 0.39% | 0.16% | 0.16% | 0.16% |
| Zn | % | 0.72% | — | — | 0.73% | 0.61% | 0.73% | 0.65% | 0.59% | 0.01 | 0.92% | 1.29% | 0.97% | 0.01 | 0.74% | 0.82% | 0.74% | 0.65% | 0.62% | 0.70% | 0.65% | 0.35% | 0.35% | 0.33% |
| AgEq | g/t | 74 | — | — | 105 | 104 | 94 | 96 | 74 | 71 | 86 | 118 | 84 | 70 | 63 | 77 | 72 | 68 | 67 | 69 | 65 | 34 | 34 | 35 |
| Lead/Silver Conc. – Recovery: | ||||||||||||||||||||||||
| Ag | % | 77% | — | — | 83% | 84% | 82% | 82% | 74% | 75% | 80% | 86% | 78% | 77% | 71% | 73% | 73% | 72% | 71% | 72% | 72% | 58% | 58% | 58% |
| Au | % | 18% | — | — | 18% | 18% | 18% | 18% | 18% | 18% | 18% | 18% | 18% | 18% | 18% | 18% | 18% | 18% | 18% | 18% | 18% | 18% | 18% | 18% |
| Pb | % | 86% | — | — | 92% | 92% | 90% | 90% | 84% | 88% | 90% | 93% | 86% | 89% | 85% | 83% | 83% | 81% | 81% | 81% | 83% | 77% | 77% | 70% |
| Zinc Conc. – Recovery: | ||||||||||||||||||||||||
| Ag | % | 10% | — | — | 8% | 8% | 9% | 8% | 10% | 10% | 9% | 7% | 9% | 10% | 12% | 10% | 10% | 11% | 11% | 11% | 10% | 15% | 15% | 14% |
| Au | % | 10% | — | — | 10% | 10% | 10% | 10% | 10% | 10% | 10% | 10% | 10% | 10% | 10% | 10% | 10% | 10% | 10% | 10% | 10% | 10% | 10% | 10% |
| Zn | % | 85% | — | — | 85% | 84% | 85% | 84% | 84% | 85% | 86% | 87% | 86% | 85% | 85% | 86% | 85% | 85% | 84% | 85% | 85% | 78% | 78% | 79% |
| PRODUCTION PROFILE | Units | Total/Avg | Y-2 | Y-1 | Y1 | Y2 | Y3 | Y4 | Y5 | Y6 | Y7 | Y8 | Y9 | Y10 | Y11 | Y12 | Y13 | Y14 | Y15 | Y16 | Y17 | Y18 | Y19 | Y20 |
| METAL PRODUCED: | ||||||||||||||||||||||||
| Ag – Ag/Pb Concentrate | moz | 229 | — | — | 10 | 11 | 10 | 19 | 14 | 13 | 16 | 22 | 13 | 11 | 10 | 13 | 12 | 12 | 12 | 11 | 11 | 4 | 4 | 1 |
| Au – Ag/Pb Concentrate | koz | 153 | — | — | 10 | 14 | 8 | 20 | 10 | 7 | 8 | 9 | 7 | 5 | 5 | 7 | 6 | 7 | 7 | 7 | 6 | 5 | 5 | 1 |
| Pb – Ag/Pb Concentrate | mlbs | 2,581 | — | — | 104 | 118 | 102 | 197 | 131 | 128 | 182 | 286 | 175 | 143 | 96 | 137 | 139 | 126 | 121 | 126 | 133 | 63 | 63 | 9 |
| AgEq – Ag/Pb Concentrate | moz | 358 | — | — | 16 | 18 | 15 | 29 | 21 | 19 | 24 | 36 | 22 | 18 | 14 | 20 | 18 | 18 | 18 | 18 | 17 | 8 | 8 | 1 |
| Ag – Zn Concentrate | moz | 30 | — | — | 1 | 1 | 1 | 2 | 2 | 2 | 2 | 2 | 2 | 1 | 2 | 2 | 2 | 2 | 2 | 2 | 2 | 1 | 1 | 0 |
| Au – Zn Concentrate | koz | 80 | — | — | 5 | 7 | 4 | 10 | 5 | 3 | 4 | 5 | 4 | 3 | 3 | 4 | 3 | 4 | 4 | 4 | 3 | 3 | 3 | 0 |
| Zn – Zn Concentrate | mlbs | 4,437 | — | — | 118 | 110 | 130 | 217 | 203 | 259 | 335 | 480 | 351 | 264 | 252 | 287 | 253 | 226 | 221 | 245 | 228 | 122 | 122 | 17 |
| AgEq – Zn Concentrate | moz | 277 | — | — | 8 | 8 | 8 | 15 | 13 | 16 | 20 | 28 | 21 | 16 | 16 | 18 | 16 | 14 | 14 | 15 | 14 | 8 | 8 | 1 |
| Ag – Total | moz | 259 | — | — | 11 | 13 | 11 | 21 | 17 | 14 | 17 | 24 | 15 | 13 | 11 | 15 | 13 | 13 | 14 | 13 | 12 | 5 | 5 | 1 |
| Au – Total | koz | 233 | — | — | 15 | 21 | 12 | 30 | 16 | 10 | 12 | 13 | 10 | 8 | 8 | 10 | 9 | 11 | 11 | 10 | 9 | 8 | 8 | 1 |
| Pb – Total | mlbs | 2,581 | — | — | 104 | 118 | 102 | 197 | 131 | 128 | 182 | 286 | 175 | 143 | 96 | 137 | 139 | 126 | 121 | 126 | 133 | 63 | 63 | 9 |
| Zn – Total | mlbs | 4,437 | — | — | 118 | 110 | 130 | 217 | 203 | 259 | 335 | 480 | 351 | 264 | 252 | 287 | 253 | 226 | 221 | 245 | 228 | 122 | 122 | 17 |
| AgEq – Total Metal Produced | moz | 635 | — | — | 24 | 25 | 23 | 44 | 35 | 35 | 45 | 64 | 43 | 34 | 30 | 37 | 34 | 32 | 32 | 33 | 33 | 16 | 16 | 2 |
| METAL PAYABLE: | ||||||||||||||||||||||||
| Ag – Ag/Pb Concentrate | moz | 218 | — | — | 10 | 11 | 9 | 18 | 14 | 12 | 15 | 21 | 13 | 11 | 9 | 12 | 11 | 11 | 11 | 11 | 10 | 4 | 4 | 1 |
| Au – Ag/Pb Concentrate | koz | 78 | — | — | 7 | 11 | 6 | 15 | 6 | 3 | 3 | 2 | 2 | 1 | 2 | 3 | 2 | 3 | 3 | 3 | 2 | 3 | 3 | 0 |
| Pb – Ag/Pb Concentrate | mlbs | 2,427 | — | — | 98 | 112 | 97 | 187 | 122 | 120 | 172 | 272 | 165 | 135 | 90 | 129 | 130 | 118 | 113 | 118 | 125 | 58 | 58 | 9 |
| AgEq – Ag/Pb Concentrate | moz | 334 | — | — | 15 | 17 | 14 | 27 | 20 | 18 | 23 | 34 | 20 | 17 | 13 | 18 | 17 | 17 | 17 | 16 | 16 | 7 | 7 | 1 |
| Ag – Zn Concentrate | moz | 12 | — | — | 0 | 1 | 0 | 1 | 1 | 1 | 1 | 0 | 0 | 1 | 1 | 1 | 1 | 1 | 1 | 1 | 1 | 1 | 1 | 0 |
| Au – Zn Concentrate | koz | 7 | — | — | 1 | 3 | 0 | 3 | — | — | — | — | — | — | — | — | — | — | — | — | — | — | — | — |
| Zn – Zn Concentrate | mlbs | 3,733 | — | — | 99 | 92 | 109 | 182 | 170 | 218 | 282 | 406 | 296 | 222 | 212 | 242 | 213 | 190 | 185 | 206 | 191 | 102 | 102 | 14 |
| AgEq – Zn Concentrate | moz | 217 | — | — | 6 | 6 | 6 | 11 | 10 | 13 | 16 | 23 | 17 | 13 | 12 | 14 | 12 | 11 | 11 | 12 | 11 | 6 | 6 | 1 |
| Ag – Total | moz | 230 | — | — | 10 | 11 | 10 | 19 | 15 | 13 | 15 | 21 | 13 | 11 | 10 | 13 | 12 | 12 | 12 | 12 | 11 | 5 | 5 | 1 |
| Au – Total | koz | 86 | — | — | 8 | 14 | 6 | 17 | 6 | 3 | 3 | 2 | 2 | 1 | 2 | 3 | 2 | 3 | 3 | 3 | 2 | 3 | 3 | 0 |
| Pb – Total | mlbs | 2,427 | — | — | 98 | 112 | 97 | 187 | 122 | 120 | 172 | 272 | 165 | 135 | 90 | 129 | 130 | 118 | 113 | 118 | 125 | 58 | 58 | 9 |
| Zn – Total | mlbs | 3,733 | — | — | 99 | 92 | 109 | 182 | 170 | 218 | 282 | 406 | 296 | 222 | 212 | 242 | 213 | 190 | 185 | 206 | 191 | 102 | 102 | 14 |
| AgEq – Total Metal Payable | moz | 550 | — | — | 21 | 23 | 20 | 39 | 30 | 30 | 39 | 56 | 37 | 30 | 26 | 32 | 29 | 28 | 28 | 28 | 27 | 13 | 13 | 2 |
| REVENUE | Units | Total/Avg | Y-2 | Y-1 | Y1 | Y2 | Y3 | Y4 | Y5 | Y6 | Y7 | Y8 | Y9 | Y10 | Y11 | Y12 | Y13 | Y14 | Y15 | Y16 | Y17 | Y18 | Y19 | Y20 |
| OXIDES + SULPHIDES: | ||||||||||||||||||||||||
| Ag Revenue | US$mm | $5,065 | — | — | $228 | $251 | $212 | $415 | $325 | $280 | $337 | $472 | $289 | $251 | $216 | $283 | $261 | $259 | $271 | $253 | $240 | $102 | $102 | $16 |
| Au Revenue | US$mm | $137 | — | — | $14 | $22 | $9 | $28 | $10 | $4 | $5 | $3 | $3 | $2 | $3 | $4 | $2 | $5 | $5 | $4 | $3 | $5 | $5 | $1 |
| Pb Revenue | US$mm | $2,427 | — | — | $98 | $112 | $97 | $187 | $122 | $120 | $172 | $272 | $165 | $135 | $90 | $129 | $130 | $118 | $113 | $118 | $125 | $58 | $58 | $9 |
| Zn Revenue | US$mm | $4,480 | — | — | $119 | $111 | $131 | $218 | $204 | $261 | $338 | $487 | $355 | $266 | $254 | $290 | $256 | $228 | $222 | $247 | $230 | $123 | $123 | $17 |
| Gross Revenue | US$mm | $12,109 | — | — | $458 | $496 | $449 | $847 | $663 | $665 | $853 | $1,234 | $812 | $653 | $562 | $706 | $648 | $609 | $612 | $623 | $597 | $288 | $288 | $43 |
| Treatment & Refining Charges | US$mm | $1,296 | — | — | $41 | $42 | $43 | $77 | $66 | $73 | $93 | $131 | $93 | $74 | $67 | $79 | $73 | $67 | $66 | $70 | $67 | $35 | $35 | $5 |
| Total Penalties | US$mm | $43 | — | — | $1 | $1 | $1 | $2 | $2 | $2 | $3 | $5 | $4 | $3 | $2 | $3 | $2 | $2 | $2 | $2 | $2 | $1 | $1 | $0 |
| Net Revenue – Total | US$mm | $10,769 | — | — | $416 | $453 | $405 | $769 | $595 | $590 | $756 | $1,098 | $715 | $577 | $493 | $624 | $573 | $540 | $543 | $551 | $528 | $252 | $252 | $38 |
| OPERATING COSTS | ||||||||||||||||||||||||
| UNIT COSTS: | ||||||||||||||||||||||||
| Mine (Incl. Rehandling) | US$/t Moved | $2.35 | — | — | $2.42 | $2.33 | $2.36 | $2.55 | $2.48 | $1.95 | $2.03 | $2.17 | $2.20 | $2.19 | $2.28 | $2.29 | $2.15 | $2.21 | $2.65 | $2.81 | $3.72 | $0.97 | $0.82 | $1.12 |
| Processing | US$/t Processed | $6.28 | — | — | $6.87 | $6.72 | $6.90 | $6.13 | $6.25 | $6.21 | $6.14 | $6.17 | $6.20 | $6.30 | $6.30 | $6.26 | $6.27 | $6.25 | $6.20 | $6.23 | $6.24 | $6.28 | $6.28 | $6.28 |
| Site G&A Costs | US$/t Processed | $0.59 | — | — | $1.18 | $1.07 | $1.08 | $0.56 | $0.54 | $0.54 | $0.52 | $0.52 | $0.53 | $0.55 | $0.55 | $0.54 | $0.55 | $0.54 | $0.53 | $0.54 | $0.54 | $0.55 | $0.55 | $0.55 |
| OPERATING COSTS INCURED: | ||||||||||||||||||||||||
| Mine (Incl. Rehandling) | US$mm | $2,406 | — | — | $128 | $151 | $166 | $158 | $154 | $140 | $146 | $156 | $145 | $138 | $142 | $152 | $146 | $153 | $121 | $110 | $62 | $18 | $15 | $3 |
| Processing | US$mm | $2,056 | — | — | $59 | $64 | $65 | $109 | $115 | $115 | $118 | $119 | $117 | $115 | $115 | $116 | $114 | $116 | $117 | $116 | $116 | $115 | $115 | $17 |
| Site G&A Costs | US$mm | $192 | — | — | $10 | $10 | $10 | $10 | $10 | $10 | $10 | $10 | $10 | $10 | $10 | $10 | $10 | $10 | $10 | $10 | $10 | $10 | $10 | $1 |
| Total Site Operating Costs | US$mm | $4,655 | — | — | $198 | $226 | $241 | $277 | $279 | $266 | $274 | $285 | $273 | $263 | $267 | $278 | $270 | $279 | $249 | $236 | $188 | $143 | $140 | $21 |
| NSR – Government | US$mm | $25 | — | — | $1 | $1 | $1 | $2 | $2 | $1 | $2 | $2 | $1 | $1 | $1 | $1 | $1 | $1 | $1 | $1 | $1 | $1 | $1 | $0 |
| Concentrate Transport | US$mm | $1,043 | — | — | $32 | $33 | $34 | $60 | $51 | $58 | $74 | $104 | $76 | $60 | $53 | $64 | $59 | $55 | $53 | $57 | $56 | $30 | $30 | $4 |
| Total Operating Costs | US$mm | $5,722 | — | — | $230 | $260 | $276 | $339 | $332 | $325 | $350 | $391 | $350 | $325 | $322 | $343 | $331 | $335 | $304 | $295 | $245 | $174 | $171 | $26 |
| CASH COSTS: | ||||||||||||||||||||||||
| Co-Product Basis: | ||||||||||||||||||||||||
| Operating Cash Costs | US$/oz AgEq | $8.46 | — | — | $9.49 | $10.02 | $11.81 | $7.18 | $9.27 | $8.78 | $7.08 | $5.07 | $7.38 | $8.87 | $10.46 | $8.67 | $9.17 | $10.08 | $8.95 | $8.34 | $6.94 | $10.92 | $10.72 | $10.89 |
| Total Cash Costs | US$/oz AgEq | $12.83 | — | — | $13.10 | $13.44 | $15.66 | $10.84 | $13.27 | $13.25 | $11.51 | $9.38 | $12.10 | $13.51 | $15.30 | $13.25 | $13.77 | $14.59 | $13.38 | $12.97 | $11.58 | $16.01 | $15.81 | $15.82 |
| All-in Sustaining Costs | US$/oz AgEq | $13.47 | — | — | $13.49 | $13.84 | $16.45 | $11.01 | $13.39 | $15.38 | $11.73 | $9.60 | $12.19 | $16.46 | $15.68 | $13.54 | $14.07 | $14.70 | $16.86 | $13.00 | $11.62 | $16.08 | $15.84 | $16.02 |
| CAPITAL EXPENDITURES | Units | Total/Avg | Y-2 | Y-1 | Y1 | Y2 | Y3 | Y4 | Y5 | Y6 | Y7 | Y8 | Y9 | Y10 | Y11 | Y12 | Y13 | Y14 | Y15 | Y16 | Y17 | Y18 | Y19 | Y20 |
| Initial/Expansion Capex | US$mm | $914 | $151 | $454 | — | — | $262 | $29 | — | — | $17 | — | — | — | — | — | — | — | — | — | — | — | — | |
| Sustaining Capex (incl. Net Closure) | US$mm | $463 | — | — | $46 | $9 | $16 | $6 | $3 | $64 | $9 | $12 | $3 | $88 | $10 | $9 | $9 | $3 | $97 | $1 | $1 | $1 | — | — |
| Total Capital Expenditures | US$mm | $1,377 | $151 | $454 | $46 | $9 | $278 | $35 | $3 | $64 | $26 | $12 | $3 | $88 | $10 | $9 | $9 | $3 | $97 | $1 | $1 | $1 | $0 | $75 |
| FREE CASH FLOW VALUATION | ||||||||||||||||||||||||
| Net Revenue | US$mm | $10,769 | — | — | $416 | $453 | $405 | $769 | $595 | $590 | $756 | $1,098 | $715 | $577 | $493 | $624 | $573 | $540 | $543 | $551 | $528 | $252 | $252 | $38 |
| Operating Expenses | US$mm | ($4,655) | — | — | ($198) | ($226) | ($241) | ($277) | ($279) | ($266) | ($274) | ($285) | ($273) | ($263) | ($267) | ($278) | ($270) | ($279) | ($249) | ($236) | ($188) | ($143) | ($140) | ($21) |
| Concentrate Transportation | US$mm | ($1,043) | — | — | ($32) | ($33) | ($34) | ($60) | ($51) | ($58) | ($74) | ($104) | ($76) | ($60) | ($53) | ($64) | ($59) | ($55) | ($53) | ($57) | ($56) | ($30) | ($30) | ($4) |
| Royalties | US$mm | ($25) | — | — | ($1) | ($1) | ($1) | ($2) | ($2) | ($1) | ($2) | ($2) | ($1) | ($1) | ($1) | ($1) | ($1) | ($1) | ($1) | ($1) | ($1) | ($1) | ($1) | ($0) |
| EBITDA | US$mm | $5,047 | — | — | $185 | $193 | $129 | $430 | $263 | $265 | $406 | $708 | $365 | $252 | $171 | $281 | $243 | $205 | $240 | $256 | $283 | $78 | $81 | $12 |
| Capital Expenditures | US$mm | ($1,377) | ($151) | ($454) | ($46) | ($9) | ($278) | ($35) | ($3) | ($64) | ($26) | ($12) | ($3) | ($88) | ($10) | ($9) | ($9) | ($3) | ($97) | ($1) | ($1) | ($1) | ($0) | ($75) |
| Pre-Tax Free Cash Flow | US$mm | $3,670 | ($151) | ($454) | $140 | $184 | ($149) | $394 | $259 | $200 | $381 | $695 | $362 | $164 | $162 | $271 | $234 | $202 | $143 | $255 | $282 | $77 | $81 | ($63) |
| Mining Tax | US$mm | ($379) | — | — | ($14) | ($14) | ($10) | ($32) | ($20) | ($20) | ($30) | ($53) | ($27) | ($19) | ($13) | ($21) | ($18) | ($15) | ($18) | ($19) | ($21) | ($6) | ($6) | ($1) |
| Income Tax Payable | US$mm | ($986) | — | — | — | ($28) | ($6) | ($88) | ($41) | ($41) | ($79) | ($162) | ($77) | ($43) | ($39) | ($70) | ($59) | ($49) | ($55) | ($59) | ($67) | ($10) | ($11) | — |
| Post-Tax Free Cash Flow | US$mm | $2,305 | ($151) | ($454) | $126 | $141 | ($164) | $274 | $198 | $140 | $271 | $480 | $258 | $102 | $110 | $180 | $156 | $138 | $70 | $176 | $194 | $61 | $64 | ($64) |
| Rolling EOP After-tax NPV (5%) | US$B | $1.4 | $2.0 | $1.9 | $1.9 | $2.2 | $2.0 | $1.9 | $1.8 | $1.6 | $1.2 | $1.0 | $0.9 | $0.9 | $0.7 | $0.6 | $0.5 | $0.4 | $0.3 | $0.1 | $0.0 | |||
| Pre-Tax | Post-Tax | |||||||||||||||||||||||
| NPV (5%) | US$mm | 1,980 | 1,177 | |||||||||||||||||||||
| IRR | % | 29.4 | 22.0 | |||||||||||||||||||||
| Payback | Years | 4.1 | 5.2 | |||||||||||||||||||||
CPM Group’s 10-Year Copper Outlook are now available. ... READ MORE
Arizona Gold and Silver Inc. (TSX-V: AZS) (OTCQB: AZASF) is ple... READ MORE
Brixton Metals Corporation (TSX-V: BBB) (OTCQX: BBBXF) is pleased... READ MORE
Valkea Resources Corp. (TSX-V: OZ) is pleased to announce the clo... READ MORE
Tiger Gold Corp. (TSX-V: TIGR) (FSE: D150) (OTCQB: TGRGF) is plea... READ MORE


