


![]()
Osisko Development Corp. (NYSE: ODV) (TSX-V: ODV) is pleased to announce the results of a positive optimized Feasibility Study for its permitted, 100%-owned Cariboo Gold Project, located in central British Columbia, Canada. The 2025 FS was completed by BBA Engineering Ltd. as lead independent consultant, and supported by other independent engineering firms, in accordance with National Instrument 43-101 – Standards of Disclosure for Mineral Projects. The Company intends to file the technical report in respect of the 2025 FS on SEDAR+ (www.sedarplus.ca) and on EDGAR (www.sec.gov) under Osisko Development’s issuer profile within 45 days of the date of this news release. The 2025 FS confirms strong economics for a low-impact underground operation using mechanized bulk mining methods, with attractive operating costs, manageable capital requirements, and well-positioned to benefit from favorable macroeconomic and gold price trends. The process facilities have been designed to accommodate potential future throughput expansions.
HIGHLIGHTS1
Sean Roosen, Founder, Chairman and CEO, commented, “The completion of this optimized feasibility study represents a critical milestone for the Cariboo Gold Project, one of the few undeveloped, permitted gold projects in a Tier-1 jurisdiction4. The results reaffirm our view that Cariboo is a high-quality asset with robust returns and significant upside potential within the existing mine plan. Our immediate focus remains on advancing project financing and further de-risking the project toward FID, but, we believe additional work could support potential future production increases within the planned mine footprint. Additionally, our extensive land position around the Project area offers numerous opportunities for new discoveries in this prolific gold belt. With today’s favorable gold price backdrop and positive outlook, we believe this project is well-positioned to deliver substantial value to all stakeholders. We look forward to sharing further updates in the coming months.”
A formal positive final investment decision, along with securing of a project financing package in the coming months would enable certain construction activities to commence in the second half of 2025, with project completion targeted for the end of 2027.
Osisko Development will host a conference call and webinar presentation by management on the 2025 FS results on Monday, April 28, 2025 at 11:00 a.m. ET, followed by a question & answer session. Details for dial-in, webcast access, and replay archive are available at the end of this news release.
OPTIMIZED FEASIBILITY STUDY OVERVIEW
The Cariboo Gold Project is envisioned as a traditional underground operation, employing mechanized long-hole open stoping to extract ore from gold-bearing vein corridors—an intricate network of mineralized quartz veins predominantly hosted within unmineralized sandstone. An improved flowsheet from the 2023 FS (as defined herein5), supported by additional metallurgical testwork, envisions ore beneficiation to be exclusively completed at the Mine Site Complex. This would produce saleable gold doré from a gravity concentrate and ~66 tpd of high-grade flotation concentrate averaging ~133 g/t Au. The flotation concentrate would be transported by truck to the Port of Vancouver for transport and sale to a smelting partner. 2025 FS key summary results and assumptions are outlined in Table 1:
| Table 1: Cariboo Gold 2025 FS – Key Results and Assumptions (after-tax) | |||
| Metric | units | Base Case | Spot Case |
| Gold price | US$/oz | $2,400 | $3,300 |
| Exchange rate | USDCAD | 1.35 | 1.40 |
| Net Present Value at 5% discount | $ mm | 943 | 2,066 |
| Internal Rate of Return (IRR) | % | 22.1% | 38.0% |
| Payback, from commercial production | years | 2.8 | 1.6 |
| Average annual free cash flow1 | $ mm | 158 | 314 |
| Average AISC, LOM1 | US$/oz | 1,157 | 1,167 |
Key Improvements and Optimizations vs. 2023 FS
The 2025 FS incorporates several important improvements and de-risking initiatives over the 2023 Feasibility Study that better position the Project from an execution, financing, and operational perspective. Notable changes include:
| Table 2: Cariboo Gold 2025 FS vs. 2023 FS – Project Operating and Financial Metrics | |||
| Assumptions | units | 2023 FS | 2025 FS |
| Gold price | US$/oz | 1,700 | 2,400 |
| Exchange rate | USDCAD | 1.30 | 1.35 |
| Discount rate | % | 5.0% | 5.0% |
| Production | |||
| Mine life | yrs | 12.0 | 10.0 |
| Total ore mined | kt | 16,703 | 17,815 |
| Peak annual throughput | tpd | 4,900 | 4,900 |
| Average gold head grade | g/t Au | 3.78 | 3.62 |
| Total contained gold | koz | 2,031 | 2,071 |
| Avg. gold recovery | % | 92.0% | 92.6% |
| Total recovered gold, payable | koz | 1,869 | 1,894 |
| Avg. gold production, LOM | koz/yr | 164 | 190 |
| Avg. gold production, first 5 yrs | koz/yr | 96 | 202 |
| Operating Unit Costs | |||
| Underground mining | $/t mined | 53.6 | 62.3 |
| Processing | $/t mined | 31.2 | 23.2 |
| Water and waste management | $/t mined | 7.2 | 5.0 |
| Electrical transmission line | $/t mined | — | 4.9 |
| General and administrative | $/t mined | 10.7 | 15.4 |
| Total unit operating costs | $/t mined | 102.6 | 110.7 |
| Total operating costs | $ mm | 1,714 | 1,921 |
| Royalty payments | $ mm | 206 | 292 |
| Offsite charges | $ mm | 5 | 143 |
| Operating Costs | |||
| Total cash costs2 | US$/oz | $792 | $947 |
| AISC2 | US$/oz | $968 | $1,157 |
| Capital Expenditures | |||
| Initial costs | $ mm | 137.3 | 881 |
| Expansion costs | $ mm | 451.1 | — |
| Sustaining costs | $ mm | 466.6 | 426 |
| Closure costs, net3 | $ mm | (38.9) | 99 |
| Total capex | $ mm | 1,016 | 1,406 |
| Economics (after-tax) | |||
| Total free cash flow, LOM2 | $ mm | 901 | 1,577 |
| Net Present Value (NPV5%) | $ mm | 502 | 943 |
| Internal Rate of Return (IRR) | % | 20.7% | 22.1% |
| Payback, from commercial production | yrs | 5.9 | 2.8 |
| Average free cash flow, first 5 yrs2 | $ mm | (63) | 296 |
| Average free cash flow, LOM2 | $ mm | 75 | 158 |
Figure 1: Payable Gold Production and AISC1 Profile by Year
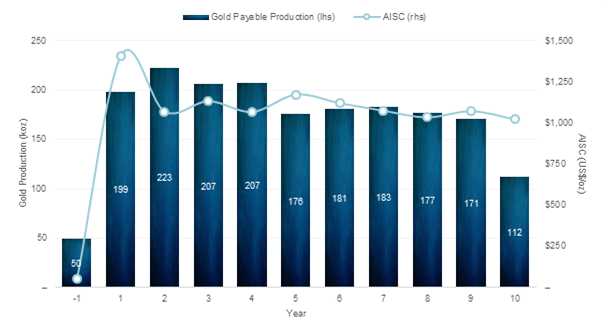
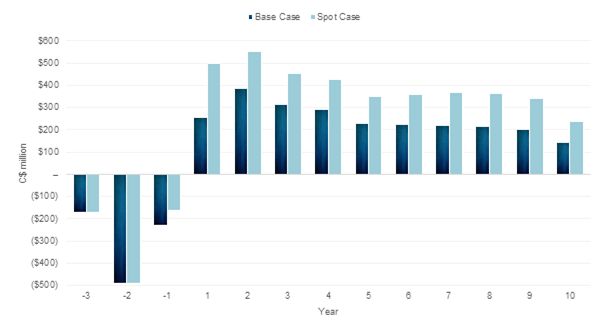
Figure 2: Free Cash Flow1 by Year
ECONOMIC SENSITIVITY ANALYSIS
The Company used a base case gold price assumption of US$2,400/oz and a USDCAD exchange rate of 1.35 in its analysis and incorporated only Probable Mineral Reserves (as defined herein). Based on these assumptions, the Project generates an after-tax NPV5% of $943 million, an after-tax unlevered IRR of 22.1% and a payback of 2.8 years (from commercial production). The 2025 FS economics are most sensitive to fluctuations in the following inputs (in order of magnitude of impact): gold price, foreign exchange, operating costs, and capital costs.
| Table 3: Cariboo Gold 2025 FS – Economic Sensitivity Analysis, after-tax (base case in bold) | ||||
| Gold Price | NPV5% | IRR | Payback | Avg. FCF |
| (US$/oz) | ($ mm) | (%) | (yrs) | ($ mm per yr) |
| $1,800 | 251 | 9.9% | 5.3 | 65 |
| $2,100 | 610 | 16.5% | 3.5 | 113 |
| $2,400 | 943 | 22.1% | 2.8 | 158 |
| $2,700 | 1,275 | 27.2% | 2.2 | 204 |
| $3,000 | 1,604 | 31.9% | 1.9 | 250 |
| $3,300 | 1,934 | 36.3% | 1.7 | 296 |
| $3,600 | 2,263 | 40.5% | 1.5 | 342 |
| $3,900 | 2,592 | 44.5% | 1.3 | 388 |
| $4,200 | 2,921 | 48.3% | 1.2 | 433 |
| $4,500 | 3,249 | 51.9% | 1.1 | 479 |
| Table 4: Cariboo Gold 2025 FS – NPV5% Sensitivity Analysis, after-tax, $ mm (base case in bold) | |||||
| Gold Price | USDCAD Exchange Rate | ||||
| (US$/oz) | 1.25 | 1.30 | 1.35 | 1.40 | 1.45 |
| $1,800 | 59 | 166 | 251 | 335 | 419 |
| $2,100 | 439 | 525 | 610 | 695 | 780 |
| $2,400 | 750 | 847 | 943 | 1,040 | 1,136 |
| $2,700 | 1,058 | 1,167 | 1,275 | 1,382 | 1,490 |
| $3,000 | 1,364 | 1,484 | 1,604 | 1,724 | 1,845 |
| $3,300 | 1,669 | 1,801 | 1,934 | 2,066 | 2,198 |
| $3,600 | 1,974 | 2,118 | 2,263 | 2,408 | 2,552 |
| $3,900 | 2,279 | 2,436 | 2,592 | 2,749 | 2,905 |
| $4,200 | 2,584 | 2,753 | 2,921 | 3,089 | 3,258 |
| $4,500 | 2,888 | 3,069 | 3,249 | 3,430 | 3,610 |
| Table 5: Cariboo Gold 2025 FS – IRR Sensitivity Analysis, after-tax, % (base case in bold) | |||||
| Gold Price | USDCAD Exchange Rate | ||||
| (US$/oz) | 1.25 | 1.30 | 1.35 | 1.40 | 1.45 |
| $1,800 | 6.2% | 8.3% | 9.9% | 11.5% | 13.0% |
| $2,100 | 13.4% | 15.0% | 16.5% | 18.0% | 19.4% |
| $2,400 | 18.9% | 20.6% | 22.1% | 23.7% | 25.2% |
| $2,700 | 23.9% | 25.6% | 27.2% | 28.8% | 30.3% |
| $3,000 | 28.5% | 30.2% | 31.9% | 33.5% | 35.2% |
| $3,300 | 32.8% | 34.6% | 36.3% | 38.0% | 39.7% |
| $3,600 | 36.8% | 38.7% | 40.5% | 42.3% | 44.1% |
| $3,900 | 40.7% | 42.7% | 44.5% | 46.3% | 48.1% |
| $4,200 | 44.4% | 46.4% | 48.3% | 50.1% | 52.0% |
| $4,500 | 47.9% | 49.9% | 51.9% | 53.8% | 55.7% |
MINERAL RESOURCES AND MINERAL RESERVES
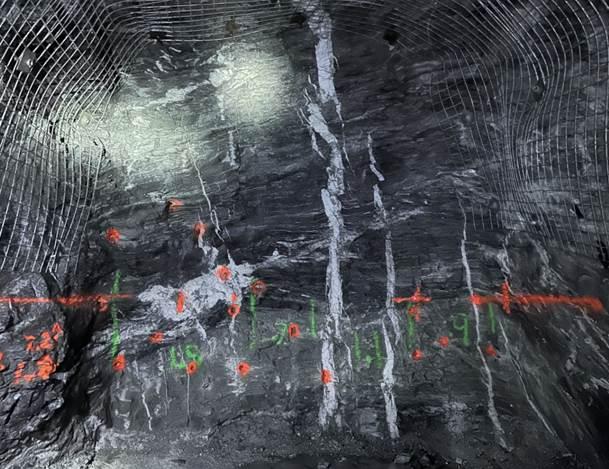
Vein corridors that make up the Cariboo Gold Project Mineral Resources and Mineral Reserves comprise a high-density network of mineralized quartz veins hosted within unmineralized sandstone. Individual mineralized veins within these corridors have widths varying from centimeters to several meters and strike lengths from a few meters to over 50 m. These corridors have been defined from surface to a vertical depth of 650 m, averaging 300m, and remain open for expansion at depth and along strike. Gold grades are intimately associated with quartz vein-hosted pyrite as well as pyritic, intensely silicified wall rock haloes in close proximity to the veins.
Figure 3: Vein Corridor in Lowhee Bulk Sample Area
Mineral Resources Estimate
The Mineral Resources estimate included in the 2025 FS have an effective date of April 22, 2025, and are reported exclusive of Mineral Reserves. Mineral Resources that are not Mineral Reserves do not have demonstrated economic viability. The Mineral Resources estimate have been updated to account for depletion in the Lowhee Zone, due to ongoing development and bulk sample activities, as well as for changes in costs and cut-off grade assumptions. This resulted in an aggregate increase of 3% of the total contained gold ounces in the Indicated Resources category and an increase of 8% of the total contained gold ounces in the Inferred Resources category as compared to the 2023 FS.
There is no certainty that Mineral Resources will be converted into Mineral Reserves. Mineral Resources include Inferred Mineral Resources which have had insufficient work to classify them as Indicated Mineral Resources. It is uncertain but reasonably expected that Inferred Mineral Resources could be upgraded to Indicated Mineral Resources with continued exploration.
| Table 6: Cariboo Gold 2025 FS – Mineral Resources Statement (April 22, 2025) | |||
| Category / Zone | Tonnage | Gold Grade | Contained Gold |
| (000’s tonnes) | (g/t) | (000’s oz) | |
| Measured | |||
| Bonanza Ledge | 47 | 5.06 | 8 |
| Indicated | |||
| Bonanza Ledge | 32 | 4.02 | 4 |
| BC Vein | 1,057 | 3.00 | 102 |
| KL | 527 | 2.80 | 47 |
| Lowhee | 1,333 | 2.76 | 118 |
| Mosquito | 1,553 | 2.96 | 148 |
| Shaft | 6,121 | 2.92 | 575 |
| Valley | 2,718 | 2.70 | 236 |
| Cow | 3,991 | 2.91 | 374 |
| Total Indicated Resources | 17,332 | 2.88 | 1,604 |
| Total Measured & Indicated | 17,380 | 2.88 | 1,612 |
| Inferred | |||
| BC Vein | 596 | 3.17 | 61 |
| KL | 2,514 | 2.53 | 205 |
| Lowhee | 486 | 3.01 | 47 |
| Mosquito | 1,883 | 3.08 | 186 |
| Shaft | 7,457 | 3.44 | 826 |
| Valley | 2,470 | 3.01 | 239 |
| Cow | 3,368 | 2.78 | 301 |
| Total Inferred Resources | 18,774 | 3.09 | 1,864 |
Mineral Reserves Estimate
The 2025 FS outlines Probable Mineral Reserves estimate (with an effective date of April 10, 2025) which is increased slightly from the 2023 FS due to the adjustment of the cut-off-grade dictated by an accelerated ramp-up schedule to 4,900 tpd throughput relative to the 2023 FS.
| Table 7: Cariboo Gold 2025 FS – Mineral Reserves Statement (April 10, 2025) | |||
| Category / Zone | Tonnage | Gold Grade | Contained Gold |
| (tonnes) | (g/t) | (oz) | |
| Proven | — | — | — |
| Probable | |||
| Cow | 3,999,971 | 3.35 | 430,548 |
| Valley | 3,238,636 | 3.59 | 374,058 |
| Shaft | 8,548,295 | 3.72 | 1,021,599 |
| Mosquito | 1,105,370 | 3.94 | 140,102 |
| Lowhee | 923,162 | 3.52 | 104,491 |
| Total Proven & Probable | 17,815,435 | 3.62 | 2,070,798 |
PRODUCTION PROFILE
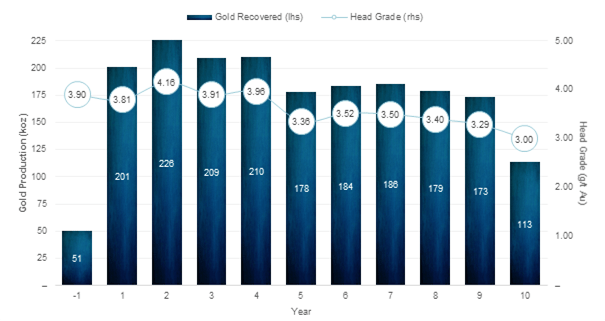
The 2025 FS outlines an average annual gold production profile of 190,000 ounces over a 10-year mine life. Total payable gold recovered is 1.894 million ounces with an average head grade of 3.62 g/t Au, total metallurgical recovery of 92.6% and a 97.75% concentrate payability factor.
Figure 4: Recovered Gold and Grade Profile by Year
MINING AND MINE DESIGN
Underground mining will target five mineralized zones along 4,400 m of strike, accessed via two ramps: the currently operational Cow portal and a new Valley portal. Each zone includes several vein systems extending to a vertical depth of approximately 650 m. Following a 24-month development period, underground mining will ramp up to a design rate of 4,900 tpd over 10 months. The bulk-tonnage long-hole mining method was chosen for its cost-effectiveness, flexibility, and suitability for the sub-vertical vein geometry. To reduce the impacts of dilution, ore sorting technology will be used to separate gold-bearing sulphide ore (pyrite) from the lower-density unmineralized sandstone rock prior to milling and beneficiation (see Processing and Recovery).
The stope design parameters include a minimum width of 3.7 meters, stope heights of approximately 30 meters, and strike lengths ranging from 15 to 25 meters, depending on the zone. The average stope size tonnage has been adjusted based on insights gained from the Bonanza Ledge Phase II operation and the ongoing Lowhee Bulk Sample mining test work. Based on this information stope sizing has been standardized for the 2025 FS resulting in a ~60% increase in the average tonnes extracted per mine shape compared to the 2023 FS. Average stope size for the Project increased to 5,577 tonnes from 3,490 tonnes previously.
Mined ore will be extracted using a fleet of 10 tonne Load Haul Dump and 50 tonne haul trucks to be transported to an underground crushing facility where it will be sized and transported to surface by an inclined conveyor for pre-concentration ore sorting and subsequent flotation concentration and gravity separation.
Underground development will rely on a combination of traditional jumbos and roadheaders. The Company has previously successfully deployed a roadheader in excavating the Cow portal, ramp and one drift in Bonanza Ledge, demonstrating that the underground rock conditions are amenable to the use of roadheaders under certain conditions.
Figure 5: Mining Plan by Deposit Area
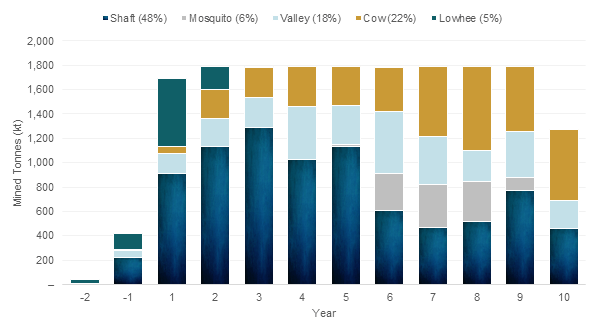
Figure 6: Mining Plan by Zone
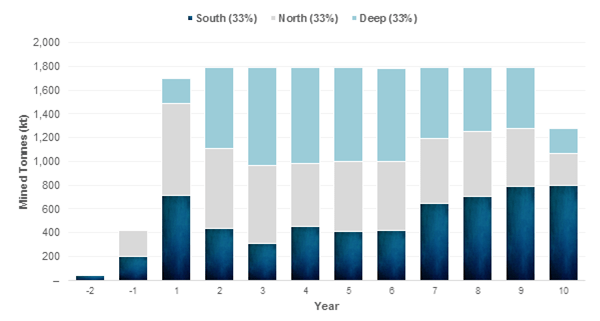
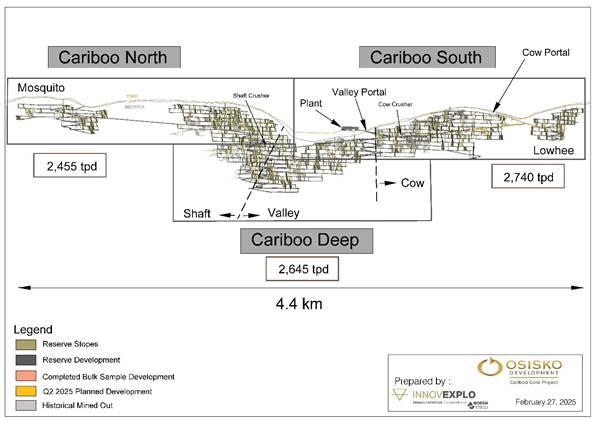
As noted in Figure 7, mining is envisioned to occur in three distinct areas: Cariboo North, South, and Deep. Each area is expected to operate independently of one another and provide a maximum ore feed of 2,455 tpd from Cariboo North, 2,740 tpd from Cariboo South, and 2,645 tpd from Cariboo Deep, such that at any given time an aggregate of 4,900 tpd is mined across all deposit areas.
Figure 7: Mining Plan by Zone Long Section
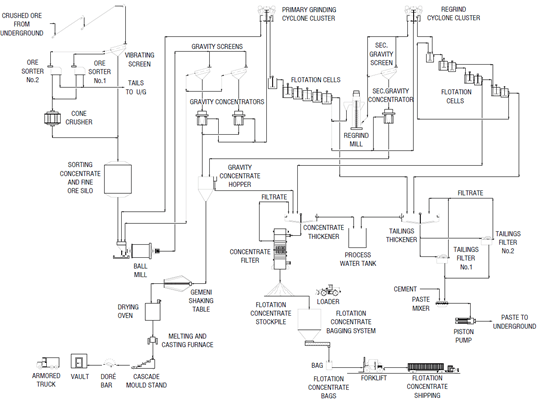
PROCESSING AND RECOVERY
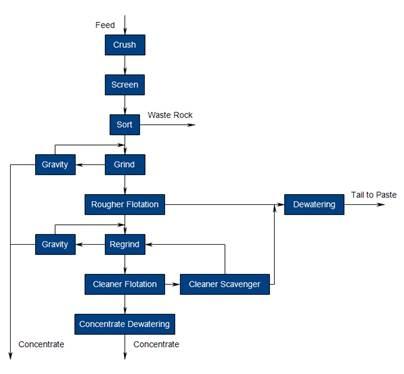
The processing flowsheet is designed for a single processing facility outside of Wells at the Mine Site Complex utilizing a combination of gravity and flotation processing circuits to produce two gold concentrates. Following the construction phase, processing will progressively ramp up to its 4,900 tpd nameplate capacity.
Crushing would occur underground in the Cariboo South region of the ore body (see Figure 7). Material would be conveyed from the secondary crusher to the surface ore sorter. The crushed material is then screened, with fines bypassing the tertiary crusher and reporting directly to the mill feed bin while coarser material would be screened into two suitable feed streams for sorting. The sorted product will be tertiary crushed and returned to the mill feed bin.
As part of the milling circuit, and as an addition to the previous 2023 FS, centrifugal gravity separators have been incorporated into the design. This is expected to contribute to overall gold recovery and recover a significant portion of the gold. Following gravity separation, the milled product (at 80% passing ~189µm) will be floated to produce a rougher concentrate for regrinding at a similar grade to the previous study. This rougher product will be reground to a target 24µm to further liberate gold and enable cleaner flotation. As significant additional gravity recoverable gold was observed in the laboratory test work, the 2025 FS design also features an additional centrifugal gravity unit in the regrind circuit. A scavenger will be included on the cleaner circuit. All flotation tails are disposed of as paste backfill into the underground.
Overall project gold recovery over the LOM is expected to be 92.6%.
Figure 8: Simplified processing flowsheet
Metallurgical Optimization
The metallurgical flowsheet has been improved since the publication of the 2023 FS based on updated metallurgical studies focused on the possibility of cleaner flotation and gravity recovery potential.
| Table 8: Cariboo Gold 2025 FS – Concentrate Comparison versus 2023 FS | |||
| Metric | units | 2023 FS | 2025 FS |
| Recovery | % | 92.01 | 92.6 |
| Average concentrate grade | g/t Au | 25 – 33 | 133 |
| Concentrate production, daily | dmt | 5903 | 66 |
| Transport trucks per day | # | 15 | <3 |
| Gravity concentrate | tonnes | n/a | ~5 tpd |
| Gravity concentrate, total recovery2 | % | n/a | 46% |
| Primary grind size | % | 125 | 189 |
The higher grade and lower volumes of flotation concentrate is expected to result in a 97.75% concentrate payability factor and reduced transportation costs. This will also reduce the number of concentrate trucks on local roads by approximately 80%.
Subsequent to the bulk ore sorter testwork incorporated in the 2023 FS, laboratory scale test work has been completed over the course of 2024 and 2025. The laboratory scale testwork was used to identify gold associations with various mineral phases and their response to x-ray transmission. These results have helped quantify the expected efficiency of the ore sorting machines, allowing for a reduction in the quantity of units required. This has been factored into the updated capital cost estimates used for the 2025 FS.
Flotation Circuit
Rougher flotation testwork was completed at a larger particle size than for the 2023 FS. This has allowed a revision to a larger primary grind size. Additional cleaner flotation testwork has allowed engineering of a cleaner circuit including regrinding to the 20-24µm range for cleaner flotation.
Gravity Recovery
Additional gravity recoverable gold testing, as well as testing of combined gravity and flotation testwork has contributed to the grade of concentrates. Based on averages of testwork to date 46% of the gold recovered is recovered by gravity.
Additional Metallurgical Work
The following metallurgical work is in progress to support refined basic and detailed engineering:
Mineral Ore Sorting
The Company has refined the ore sorting model for this deposit, including the identification of primary gold-bearing particle morphologies and determination of sorter mass pull-gold recovery behavior for each zone. These learnings have improved the precision of the recovery model.
Waste Disposal
Ore sorter waste is to be disposed in the same manner as mined waste rock—in the surface waste rock storage facility. This removes material from the mill circuit and allows a lower cost disposal method for barren rock than is utilized for mill tails streams. Whole flotation tails will be used as paste backfill underground.
Figure 9: Cariboo Gold Process Flowsheet
OPERATING COSTS
Operating costs estimate includes mining, processing costs to produce a gold doré and gold concentrate, as well as transportation. It also includes costs for waste, water management and treatment, and general and administration costs. The average operating costs over the 10-year mine life is estimated to be $110.7 per tonne mined. At its peak, the mine will employ up to 525 persons during operations and 613 during construction.
Mining costs include underground crushing cost and material handing costs, including backfilling costs without the binder content of the paste backfill, which is included in the processing cost.
| Table 9: Cariboo Gold 2025 FS – Operating Costs | ||||
| Metric | Total LOM | Unit Cost | Unit Cost | Split |
| ($ mm) | ($/t mined) | (US$/oz) | (%) | |
| Mining | 1,080 | 62.25 | 434 | 56% |
| Processing | 403 | 23.21 | 162 | 21% |
| Water and waste management | 86 | 4.97 | 35 | 4% |
| Electrical transmission line | 86 | 4.93 | 34 | 4% |
| General and administrative | 266 | 15.36 | 107 | 14% |
| Total site operating costs | 1,921 | 110.73 | 772 | 100% |
| Table 10: Cariboo Gold 2025 FS – Total Cash Costs and All-in Sustaining Costs | ||
| Metric | Total LOM | Unit Cost |
| ($ mm) | (US$/oz) | |
| Total site operating costs | 1,921 | 772 |
| Royalties | 292 | 117 |
| Transport and refining costs | 143 | 58 |
| Total cash costs1 | 2,356 | 947 |
| Sustaining costs, LOM | 426 | 171 |
| Equipment salvage value | (36) | (14) |
| Reclamation and closure costs | 135 | 54 |
| All-in sustaining costs1 | 2,881 | 1,157 |
PROJECT ROYALTIES
A 5.0% Net Smelter Royalty payable to Osisko Gold Royalties Ltd is the only royalty that applies to the Mineral Resources and Mineral Reserves area of the Project and has been incorporated into the economic analysis of the 2025 FS.
CAPITAL COSTS
The 2025 FS focused on presenting a mine plan consistent with the objective of minimizing the overall environmental and carbon footprint of the Project on the surrounding communities and providing a direct 24-month exclusive construction period leading to a 10 month ramp up to full nameplate production, with 60% reached after 6 months.
Initial capital cost for the Project is estimated at $881 million, with sustaining capital costs over the LOM estimated at $525 million. Total cumulative LOM capital costs are estimated at $1,307 million, not including site reclamation and closure costs of $135 million and estimated salvage value of $36 million. The overall capital cost estimate developed in this 2025 FS generally meets the AACE International Class 3 requirements. A total of $72 million in contingency capital (P50) was included, representing approximately 16.5% of initial capital, not including underground mine costs. Underground development costs incorporate contingencies directly into the mine plan by adjusting planned advance and mining rates.
| Table 11: Cariboo Gold 2025 FS – Capital Cost Summary | |||
| Item ($ mm) | Initial CAPEX | Sustaining CAPEX | Total CAPEX |
| Underground mine | 313 | 397 | 710 |
| Waste & Water management | 98 | 24 | 123 |
| Power & electrical | 19 | — | 19 |
| Surface infrastructure | 42 | 1 | 43 |
| Process plant – Mine Site Complex | 180 | — | 180 |
| Construction indirects | 95 | — | 95 |
| Contingency (16.5%) | 72 | 4 | 76 |
| Capital costs | 819 | 426 | 1,246 |
| Pre-production net revenue | (150) | — | (150) |
| Pre-production operating costs | 212 | — | 212 |
| Equipment salvage value | — | (36) | (36) |
| Reclamation and closure costs | — | 135 | 135 |
| Total capital costs | 881 | 525 | 1,406 |
PERMITTING, ENVIRONMENTAL AND CLOSURE
Following the positive decision by the Environmental Assessment Office to grant the project an Environmental Assessment Certificate (#M23-01), the Project underwent a robust and rigorous review by a dedicated Mine Review Committee, set up by the Major Mines Office, and subsequently received the following permits for the Cariboo Gold Project:
The Mines Act (British Columbia) permits received on November 20, 2024, grant the Company the ability to proceed with the construction, operation and reclamation activities on each of the sites outlined within the scope of the Project. The Environmental Management Act (British Columbia) permits pertain to any project-related discharges to the environment, including water and air, and the framework and limitations thereof, within the areas outside of the immediate mine site boundaries. These approvals mark the successful completion of the permitting process for key approvals, solidifying the Project’s shovel-ready status.
Work is ongoing with the Ministry of Water, Land and Resource Stewardship and the Ministry of Forests on obtaining all necessary approvals for the construction of the transmission line, expected for H2 2025.
Changes as compared to the 2023 FS have been implemented in the Project’s 2025 FS to align with the obtained permits. Major areas include:
STAKEHOLDER, COMMUNITY, AND PARTNER ENGAGEMENT
The Company is committed to advancing collaborative partnerships with Indigenous nations related to the Project as evidenced by many years of extensive consultation and the signing and ongoing implementation of the participation agreements with each of the Lhtako Dené Nation (in 2020) and the Williams Lake First Nation (in 2022).
The Company is working towards an agreement with the Xatśūll First Nation. While an agreement has not yet been reached, the Company remains committed to ongoing engagement and consultation. This includes good faith and reasonable offers for financial and other benefits along substantially similar frameworks as those agreed to by Lhtako Dené Nation and Williams Lake First Nation.
The Company continues to engage the District of Wells and signed an agreement to fund a Liaison Position which will be executed once a suitable candidate is found. The Liaison Position is a requirement of the EAC and will work with the local community to ensure communication between the District of Wells and the Company reflect the views of all community members. Further discussions on a community agreement will commence in Q2 2025.
The Company is dedicated to developing a modern, safe and sustainable operation at the Cariboo Gold Project, and remains committed to engaging in constructive dialogue to ensure all Indigenous nations and stakeholders benefit from the development of the Project, whilst ensuring it remains viable.
ADDITIONAL OPTIMIZATION OPPORTUNITIES
There are significant opportunities not included in the 2025 FS that could materially enhance the Project’s economics, timing, and/or permitting—beyond those typical to all mining projects (such as changes in metals prices, exchange rates, and other variables). Additional information and further assessments are recommended to fully understand, quantify and potentially incorporate these opportunities into the Project’s NI 43-101 feasibility-level economics.
The most significant opportunities identified to date are summarized below and have been broadly categorized based on their potential magnitude of positive impact on the Project’s economics. A comprehensive list of all identified potential areas of opportunity will be discussed in greater detail in the Technical Report to be filed within 45 days of this news release.
High potential value opportunities:
Medium potential value opportunities:
CONFERENCE CALL AND WEBCAST DETAILS
| Live event date and time | Monday, April 28, 2025 at 11:00 a.m. ET |
| Conference call details | USA / International Toll +1 (646) 307-1963 USA – Toll-Free (800) 715-9871 Canada – Toronto (647) 932-3411 Canada – Toll-Free (800) 715-9871 |
Conference ID: 5457156
Additional international dial-in numbers are available here:
https://registrations.events/directory/international/itfs.htmlWebcast detailshttps://events.q4inc.com/attendee/466021363
TECHNICAL INFORMATION AND QUALIFIED PERSONS
The 2025 FS was prepared in accordance with NI 43-101 with an effective date of April 22, 2025 and will be filed on SEDAR+ (www.sedarplus.ca) and on EDGAR (www.sec.gov) under Osisko Development’s issuer profile within 45 days of the date of this news release.
The Technical Report supersedes the 2023 FS, which should no longer be replied upon.
For readers to fully understand the information in this news release, reference should be made to the full text of the Technical Report, once filed, including all assumptions, qualifications and limitations therein. The Technical Report is intended to be read as a whole, and sections should not be read or relied upon out of context.
The 2025 FS has been prepared by independent representatives of BBA, InnovExplo, a subsidiary of Norda Stelo, Alius, Falkirk, WSP, Okane, Integrated Sustainability, Clean Energy, and JDS, each of whom is a “qualified person” (within the meaning of NI 43-101). Each QP is independent of Osisko Development and has reviewed and approved that this news release fairly and accurately reflects, in the form and context in which it appears, the information contained in the respective sections of the 2025 FS for which they are responsible. At the effective date of the 2025 FS, each QP has certified that, to the best of their knowledge, information, and belief, the parts of the 2025 FS for which they were responsible, contain all scientific and technical information required to be disclosed to make the 2025 FS not misleading. The affiliation and areas of responsibility for each QP involved in preparing the 2025 FS are provided below.
BBA QPs
InnovExplo QPs
Alius QPs
Falkirk QPs
WSP QPs
Integrated Sustainability QPs
Okane QPs
Clean Energy QPs
JDS QPs
End Notes (excluding tables)
ABOUT OSISKO DEVELOPMENT CORP.
Osisko Development Corp. is a North American gold development company focused on past-producing mining camps located in mining friendly jurisdictions with district scale potential. The Company’s objective is to become an intermediate gold producer by advancing its flagship permitted 100%-owned Cariboo Gold Project, located in central B.C., Canada. Its project pipeline is complemented by the Tintic Project in the historic East Tintic mining district in Utah, U.S.A., and the San Antonio Gold Project in Sonora, Mexico—brownfield properties with significant exploration potential, extensive historical mining data, access to existing infrastructure and skilled labour. The Company’s strategy is to develop attractive, long-life, socially and environmentally responsible mining assets, while minimizing exposure to development risk and growing mineral resources.
For further information, visit our website at www.osiskodev.com or contact:
Appendix A: Detailed Cash Flow Model and Select Key Assumptions (excel file download of the below table)
| Year | Unit | Total (to Yr 12) |
|||||||||||||||
| -3 | -2 | -1 | 1 | 2 | 3 | 4 | 5 | 6 | 7 | 8 | 9 | 10 | 11 | 12 | |||
| Production Summary | |||||||||||||||||
| Total Tonnes Mined | kt | 1.7 | 43.2 | 419.8 | 1,695.1 | 1,788.6 | 1,789.0 | 1,786.9 | 1,793.4 | 1,783.1 | 1,788.5 | 1,788.6 | 1,793.4 | 1,272.7 | 71.5 | – | 17,815.4 |
| Total Tonnes Processed | kt | – | – | 464.7 | 1,695.1 | 1,788.6 | 1,789.0 | 1,786.9 | 1,793.4 | 1,783.1 | 1,788.5 | 1,788.6 | 1,793.4 | 1,272.7 | 71.5 | – | 17,815.4 |
| Head Grade Au | g/t | – | – | 3.90 | 3.80 | 4.16 | 3.91 | 3.96 | 3.36 | 3.52 | 3.50 | 3.40 | 3.29 | 3.00 | 3.55 | – | 3.62 |
| Payable Gold | koz | – | – | 50.0 | 198.8 | 223.0 | 206.6 | 207.5 | 176.2 | 181.3 | 183.3 | 177.0 | 171.1 | 112.0 | 7.3 | – | 1,894.0 |
| Revenue | |||||||||||||||||
| Exchange Rate | USD:CAD | 1.35 | 1.35 | 1.35 | 1.35 | 1.35 | 1.35 | 1.35 | 1.35 | 1.35 | 1.35 | 1.35 | 1.35 | 1.35 | 1.35 | 1.35 | 1.35 |
| Net Smelter Return (NSR) Revenue | $M | – | – | – | 629.4 | 707.5 | 654.7 | 657.9 | 556.5 | 573.3 | 579.8 | 559.4 | 540.2 | 353.1 | 23.2 | – | 5,834.9 |
| Operating Expenses | |||||||||||||||||
| Mining | $M | – | – | – | 113.3 | 118.9 | 119.6 | 114.1 | 106.8 | 111.1 | 111.8 | 104.1 | 106.8 | 68.8 | 4.9 | – | 1,080.2 |
| Processing | $M | – | – | – | 40.1 | 42.0 | 41.2 | 39.9 | 39.9 | 38.8 | 40.2 | 40.3 | 39.1 | 35.4 | 6.0 | – | 402.8 |
| Waste and Water Management | $M | – | – | – | 8.5 | 8.1 | 8.6 | 8.6 | 8.6 | 8.6 | 8.6 | 8.6 | 8.6 | 8.5 | 0.7 | – | 86.3 |
| Electrical Transmission Line | $M | – | – | – | 9.4 | 9.4 | 9.4 | 9.4 | 9.4 | 9.4 | 9.4 | 9.4 | 9.4 | 0.5 | 0.5 | – | 85.6 |
| General and Administration | $M | – | – | – | 28.2 | 25.6 | 26.8 | 26.6 | 26.4 | 26.4 | 26.3 | 26.1 | 26.1 | 24.7 | 3.3 | – | 266.5 |
| Royalty Payments | $M | – | – | – | 31.5 | 35.4 | 32.7 | 32.9 | 27.8 | 28.7 | 29.0 | 28.0 | 27.0 | 17.7 | 1.2 | – | 291.7 |
| Total Operating Expenses | $M | – | – | – | 230.9 | 239.5 | 238.3 | 231.5 | 219.0 | 223.0 | 225.3 | 216.5 | 216.9 | 155.5 | 16.5 | – | 2,213.0 |
| Total Cash Costs | US$/oz | – | – | – | 1,070 | 857 | 900 | 876 | 961 | 972 | 969 | 959 | 997 | 1,016 | -621 | – | 947 |
| All-in Sustaining Costs | US$/oz | – | – | – | 1,409 | 1,071 | 1,135 | 1,069 | 1,175 | 1,122 | 1,076 | 1,036 | 1,073 | 1,024 | 5,840 | – | 1,157 |
| Capital Expenditures | |||||||||||||||||
| Initial | $M | 168.2 | 487.3 | 225.3 | – | – | – | – | – | – | – | – | – | – | – | – | 880.8 |
| Sustaining | $M | – | – | – | 91.2 | 64.3 | 65.5 | 54.1 | 50.8 | 36.6 | 26.4 | 18.4 | 17.6 | 1.2 | – | – | 426.1 |
| Reclamation | $M | – | – | – | – | – | – | – | – | – | – | – | – | – | 36.7 | – | 36.7 |
| Salvage Value | $M | – | – | – | – | – | – | – | – | – | – | – | – | – | -36.0 | – | -36.0 |
| Total Capital Expenditures | $M | 168.2 | 487.3 | 225.3 | 91.2 | 64.3 | 65.5 | 54.1 | 50.8 | 36.6 | 26.4 | 18.4 | 17.6 | 1.2 | 0.7 | – | 1,307.7 |
| Changes in Working Capital | $M | – | – | – | 41.4 | 3.5 | -2.0 | -0.5 | -4.6 | 0.9 | 0.4 | -1.5 | -0.6 | -11.7 | -23.2 | -2.2 | – |
| Pre-Tax Cash Flow | |||||||||||||||||
| Pre-Tax Cash Flow | $M | -168.2 | -487.3 | -225.3 | 265.9 | 400.1 | 352.9 | 372.8 | 291.4 | 312.7 | 327.6 | 326.0 | 306.3 | 208.0 | -34.0 | -3.5 | 2,245.4 |
| Cumulative Pre-Tax Cash Flow | $M | -168.2 | -655.5 | -880.8 | -614.9 | -214.8 | 138.1 | 510.9 | 802.2 | 1,114.9 | 1,442.6 | 1,768.5 | 2,074.8 | 2,282.9 | 2,248.9 | 2,245.4 | |
| Taxes and Duties | |||||||||||||||||
| British Columbia Mining Duties | $M | – | – | 0.4 | 8.6 | 10.0 | 8.9 | 9.2 | 7.3 | 26.6 | 46.1 | 45.6 | 43.0 | 27.6 | – | – | 233.3 |
| Federal Corporate Income Tax | $M | – | – | – | – | – | 15.2 | 39.6 | 30.3 | 32.7 | 33.3 | 34.1 | 33.6 | 19.1 | -18.6 | -5.2 | 214.1 |
| British Columbia Corporate Income Tax | $M | – | – | – | – | – | 12.2 | 31.7 | 24.3 | 26.1 | 26.7 | 27.3 | 26.9 | 15.2 | -14.9 | -4.2 | 171.3 |
| Carbon Tax | $M | 0.5 | 1.6 | 1.9 | 1.1 | 1.4 | 1.7 | 1.5 | 2.0 | 2.0 | 1.9 | 1.8 | 1.9 | 1.5 | 0.3 | – | 21.4 |
| Total Taxes and Duties | $M | 0.5 | 1.6 | 2.3 | 9.7 | 11.4 | 38.1 | 81.9 | 63.9 | 87.5 | 108.0 | 108.8 | 105.4 | 63.4 | -33.1 | -9.4 | 640.1 |
| After-Tax Cash Flow | |||||||||||||||||
| After- Tax Cash Flow | $M | -168.8 | -488.9 | -227.7 | 256.2 | 388.7 | 314.8 | 290.8 | 227.5 | 225.3 | 219.6 | 217.1 | 200.9 | 144.6 | -0.9 | 6.0 | 1,605.3 |
| Cumulative After- Tax Cash Flow | $M | -168.8 | -657.7 | -885.3 | -629.1 | -240.4 | 74.4 | 365.2 | 592.7 | 818.0 | 1,037.6 | 1,254.7 | 1,455.6 | 1,600.2 | 1,599.3 | 1,605.3 |
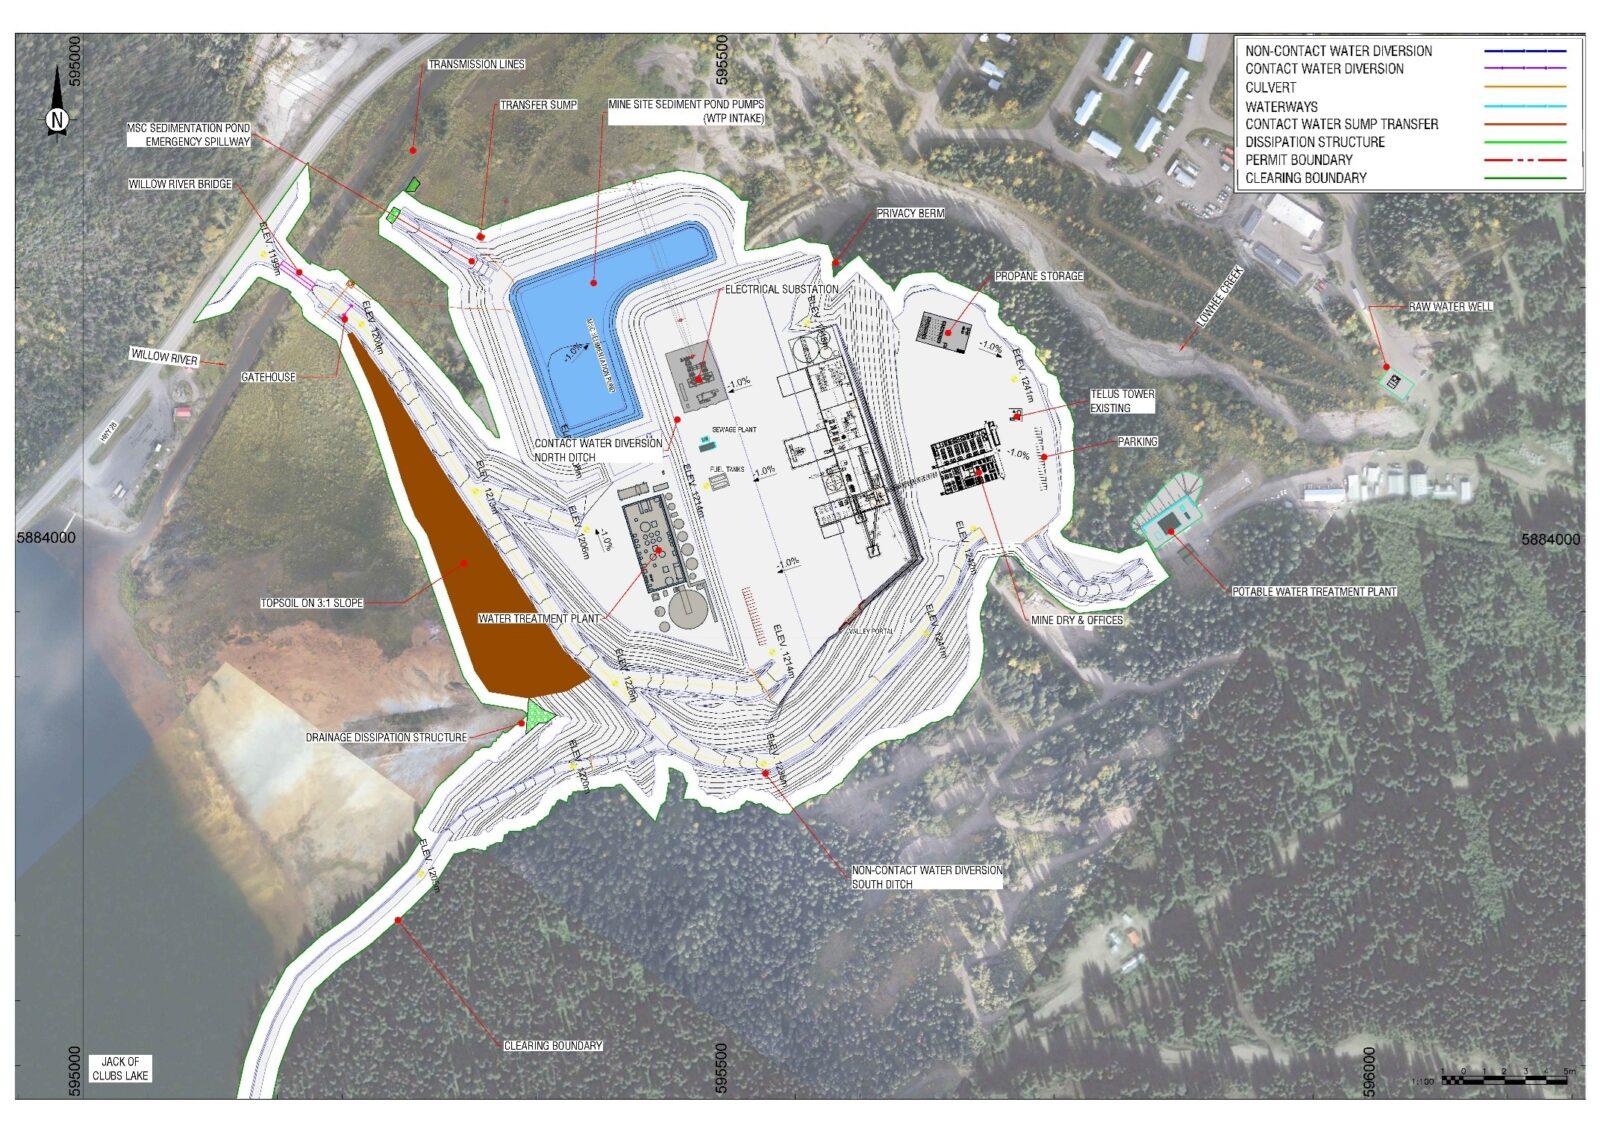
Appendix B: Proposed Conceptual Site Layout
Falco Resources Ltd. (TSX-V:FPC) is pleased to announce the resul... READ MORE
TDG Gold Corp. (TSX-V: TDG) (OTCQX: TDGGF) is pleased to provide ... READ MORE
Extension drilling extended mineralization beyond the current pit... READ MORE
Abcourt Mines Inc. (TSX-V: ABI) (OTCQB: ABMBF) continues its work... READ MORE
Premier American Uranium Inc. (TSX-V: PUR) (OTCQB: PAUIF) is plea... READ MORE


