








Oroco Resource Corp. (TSX-V: OCO) (OTCQB: ORRCF) is pleased to report the fourth batch of assay results from its Phase 2 resource drilling program in the South Zone of the Santo Tomás copper project in Choix, Sinaloa, Mexico. The results cover ten drill holes, S035 through S044.
Drill-hole locations are shown on Figure 1, and collar details are provided in Table 1. Drill holes S061 (at 256 m), S063 (at 225 m) and S064 (at 10 m) are currently in progress in the Pillar Zone between the North and South Zones: 42 holes of the Phase 2 program have been completed including 12,649.3 m drilled. To date, 11,431 m of core has been sampled during Phase 2, representing 7,543 samples of which 6,255 are core samples and 1,288 are QA/QC samples: this count includes some samples from drill holes S057 and S058. The Company has previously reported Phase 2 drilling for holes S022 through S034. Oroco currently has three drill rigs operating at Santo Tomás.
Highlights
Notable Results
All intervals are downhole lengths. See Table 2 and the accompanying technical notes.
“These overall results provide further confidence in the South Zone model while also identifying mineralization beyond the current PEA pit limits,” said Charles Cryer, CEO. “The long S042 intercept and the extensions in S038 and S041 improve our geological understanding as South Zone resource drilling nears completion and the drill rigs migrate into the Pillar Zone. The drilling has also strengthened the historical dataset used for future resource estimation, an important aspect of the current program.”
Southern end of the South Pit
Drill holes S037, S038 and S041 through S044 were completed in the southern quarter of the South Pit and indicate locally higher aggregate grades than those represented in the current South Zone Inferred Mineral Resource model. Holes S038 and S041 ended in mineralization approximately 200 m and 90 m, respectively, below the current PEA pit limits. Any potential addition to Mineral Resources would be subject to updated geological and resource modelling, pit optimization, stripping constraints and the requirement for reasonable prospects of eventual economic extraction.
North-Central Area of the South Pit and Eastern Pit Limits
Holes S035, S036, S039 and S040 comprise infill, metallurgical and twin drilling in the north-central and eastern portions of the South Pit. The assay results generally correspond with the copper grades predicted by the August 2024 PEA block model. The twin drilling also provides additional multi-element data because historical (pre-Oroco) programs did not consistently assay all samples for molybdenum, gold and silver, strengthening the dataset available for future geological and resource modelling.
Phase 2 Program Overview
Phase 2 is designed primarily to provide the drilling density and technical data needed to evaluate the potential conversion of Inferred Mineral Resources to the Indicated category in the South Zone. The program is also collecting geotechnical, hydrogeological and metallurgical data to support Pre-feasibility study -level mine planning.
The South Zone resource-drilling component is well advanced, and drilling has commenced in the Pillar Zone between the North and South Zones.
Table 1: Phase 2 Drill Holes S035 to S044
| Hole | East (m) |
North (m) |
Elev. (m) |
Dip (deg.) |
Az. (deg.) |
Objective / Comment |
| S035 | 778,838 | 2,975,787 | 651 | -65° | 100° | Northern half, central South Pit. Confirmed mineralization tenor relative to historical hole STD-35. |
| S036 | 779,088 | 2,974,949 | 802 | -90° | 0° | Twin of historical hole STD-50. Copper grades correlate well; core will also support metallurgical test work. |
| S037 | 779,260 | 2,974,443 | 763 | -55° | 100° | Southern end of the South Pit. Grades conform with the block model and current pit limit. |
| S038 | 779,257 | 2,974,444 | 763 | -65° | 280° | Drilled westward from the same pad as S037. The hole ended in mineralization approximately 200 m vertically below the current PEA pit limit, indicating potential for mineralization beyond the current pit shell. |
| S039 | 779,199 | 2,975,319 | 759 | -55° | 100° | East-central area of the current South Pit. Assays correspond well with the copper grades estimated in the block model. |
| S040 | 779,069 | 2,975,263 | 761 | -55° | 100° | Similar objective to S039. Assays correspond well with the copper grades estimated in the block model. |
| S041 | 779,179 | 2,974,813 | 813 | -45° | 155° | Tests the higher-grade zone identified in Phase 1 hole S018 to the west. S041 ended in mineralization approximately 90 m vertically below the current PEA pit limit. |
| S042 | 778,951 | 2,974,702 | 717 | -45° | 120° | Infill hole within the higher-grade S018 area of the South Zone; returned 369.3 m grading 0.45% CuEq. |
| S043 | 778,950 | 2,974,701 | 717 | -50° | 170° | Defines the southern limit of mineralization south of the S018 zone. |
| S044 | 778,950 | 2,974,703 | 717 | -55° | 290° | Drilled from the same pad as S043; helps define the western limit of mineralization in the southwest quadrant of the current pit. |
Geometallurgical Core Characterization
Oroco is utilizing Geopyörä drill-core testing technology to develop more comprehensive and spatially representative geotechnical and comminution data across the Santo Tomás deposit. Testing of both historical Phase 1 drill core and core from the current Phase 2 program will provide systematic measurements of rock hardness, breakage characteristics and grindability, allowing these properties to be incorporated spatially into the PFS block model.
This work will improve predictive mill throughput estimates and the understanding of energy consumption variability over the life of mine and inform an updated PFS mine schedule based on an updated Mineral Resource Estimate. The data will allow prioritization of mill feed by rock type and grade to maximize payable metal production at the lowest cost as early as possible in the mining operations. The results will reduce initial capital risk by better sizing process plant elements, in addition to reducing uncertainties associated with life-of-mine metal production and financial performance.
Concurrent and historical point load testing correlates well to date with the Geopyörä data and supports the thesis that South Zone mill feed will require reduced comminution energy relative to the estimate presented in the August 2024 PEA.
Table 2: Significant Assay Results for Sulphide Intercepts**
| Hole | From (m) |
To (m) |
Interval (m) |
CuT % |
Mo % |
Au ppm |
Ag ppm |
CuEq %* |
|||||||||||
| S035 | 74.8 | 100 | 25.2 | 0.34 | 0.002 | 0.090 | 2.19 | 0.45 | |||||||||||
| 108 | 165.4 | 57.4 | 0.55 | 0.002 | 0.120 | 2.80 | 0.72 | ||||||||||||
| S036 | 92 | 109.4 | 17.4 | 0.32 | 0.011 | 0.010 | 2.22 | 0.40 | |||||||||||
| 113 | 299 | 186 | 0.32 | 0.006 | 0.022 | 1.70 | 0.37 | ||||||||||||
| 307 | 389.3 | 82.3 | 0.30 | 0.007 | 0.018 | 1.75 | 0.37 | ||||||||||||
| 435 | 451 | 16 | 0.16 | 0.011 | 0.005 | 1.74 | 0.23 | ||||||||||||
| S037 | 0 | 12 | 12 | 0.09 | 0.005 | 0.006 | 3.07 | 0.16 | |||||||||||
| 18 | 185 | 167 | 0.28 | 0.015 | 0.010 | 1.90 | 0.36 | ||||||||||||
| 195.8 | 247. | . | .28 | 0.009 | 0.018 | 2.47 | 0.36 | ||||||||||||
| S038 | 0 | 33 | 33 | 0.09 | 0.011 | 0.009 | 2.52 | 0.19 | |||||||||||
| 70 | 91.8 | 21.8 | 0.34 | 0.008 | 0.012 | 1.24 | 0.39 | ||||||||||||
| 101.4 | 128.2 | 26.8 | 0. | .011 | 0.011 | 2.62 | 0.45 | ||||||||||||
| 135 | 190.9 | 55.9 | 0.39 | 0.014 | 0.021 | 1.99 | 0.49 | ||||||||||||
| 198 | 274 | 76 | 0.27 | 0.039 | 0.014 | 2.09 | 0.47 | ||||||||||||
| 314 | 329 | 15 | 0.08 | 0.022 | 0.012 | 0.89 | 0.20 | ||||||||||||
| 337 | 359 | 22 | 0.08 | 0.012 | 0.007 | 2.50 | 0.18 | ||||||||||||
| 370 | 399. | .2 | 0.13 | 0.018 | 0.008 | 1.90 | 0.24 | ||||||||||||
| S039 | 25 | 38. | .8 | 0.17 | 0.004 | 0.020 | 1.60 | 0.20 | |||||||||||
| 55 | 66 | 11 | 0.13 | 0.003 | 0.018 | 1.98 | 0.17 | ||||||||||||
| 80 | 90 | 10 | 0.14 | 0.003 | 0.009 | 2.96 | 0.19 | ||||||||||||
| 98 | 201 | 103 | 0.47 | 0.006 | 0.045 | 3.36 | 0.58 | ||||||||||||
| S040 | 131 | 285 | 154 | 0.42 | 0.011 | 0.024 | 2.66 | 0.51 | |||||||||||
| 287 | 301 | 14 | 0.65 | 0.000 | 0.132 | 3.29 | 0.83 | ||||||||||||
| 307 | 319 | 12 | 0.30 | 0.003 | 0.036 | 2.08 | 0.36 | ||||||||||||
| S041 | 73.5 | 285.2 | 211. | .25 | 0.008 | 0.014 | 2.33 | 0.32 | |||||||||||
| 289.3 | 539 | 249.7 | 0.30 | 0.010 | 0.010 | 1.66 | 0.36 | ||||||||||||
| S042 | 0 | 369.3 | 369.3 | 0.34 | 0.018 | 0.015 | 2.42 | 0.45 | |||||||||||
| 370.3 | 393.1 | 22.8 | 0.13 | 0.014 | 0.008 | 1.10 | 0.20 | ||||||||||||
| S043 | 0 | 94.6 | 94.6 | 0.30 | 0.016 | 0.019 | 1.54 | 0.40 | |||||||||||
| 232.6 | 279 | 46.4 | 0.07 | 0.025 | 0.009 | 0.97 | 0.21 | ||||||||||||
| 295 | 313 | 18 | 0.05 | 0.019 | 0.010 | 0.56 | 0.18 | ||||||||||||
| S044 | 0 | 213 | 213 | 0.26 | 0.017 | 0.010 | 1.66 | 0.36 | |||||||||||
| 219 | 229 | 10 | 0.10 | 0.026 | 0.009 | 0.45 | 0.22 | ||||||||||||
| * CuEq (%) = [(Cu% × Cu recovery (variable) × Cu price) + (Mo% × Mo recovery (variable) × Mo price) + (Au g/t × Au recovery (variable) × Au price) + (Ag g/t × Ag recovery (variable) × Ag price)] ÷ (Cu price × Cu recovery (variable)). Metal prices are stated in US$/lb for Cu and Mo and US$/oz for Au and Ag; see Table 3. Metal recoveries are grade-based for each assay within the reported intervals and vary accordingly. Across these intervals, Cu recovery ranges from 82% to 89%, Mo from 50% to 60%, Au from 30% to 85% and Ag from 35% to 67%. Au and Ag recoveries depend on copper and sulphur grades. Copper-equivalent grades are not reported for intervals containing both sulphide and non-sulphide copper. The CuEq presented in Figure 1 is calculated using the method described above. ** Significant intervals are at least 10 m long and comprise samples that grade at least 0.15% Cu, but may include individual intervals of up to 4 m grading at least 0.05% Cu.
Where a hole contains multiple assay intervals in reasonable downhole proximity, lower-grade intervals are also reported to show continuity with significant intercepts and are not themselves held out as significant. This is consistent with the significant-interval reporting convention used for Phase 1 news releases and the August 2024 PEA. Copper-equivalent grades are not reported for intervals with copper oxide assays. |
|||||||||||||||||||
All intervals are downhole core lengths. True widths will be confirmed when the Phase 2 results are incorporated into updated geological and resource models. Where drill holes are oriented approximately perpendicular to the interpreted attitude of the mineralization, the reported core intervals are expected to approximate true thickness.
Copper Equivalent Reporting
CuEq grades in this release are calculated using the variable metal-recovery curves in Chapter 13 of the Company’s August 2024 technical report, “Santo Tomás Copper Project, Sinaloa, Mexico – Technical Report on a Preliminary Economic Assessment” (the “PEA”), filed on SEDAR+ in August 2024, and the metal-price deck in Table 3, which reflects 12-month trailing average prices to April 30, 2026. This price deck differs from the one used in the PEA.
The CuEq grades in this release are therefore not directly comparable with CuEq grades reported in the Company’s 2024 Indicated and Inferred Mineral Resource summary or in drill-result news releases issued before 2024, which used different metal-price assumptions and/or CuEq methodologies. The Company has recalculated the significant-intercept database for the full drill-hole dataset using the updated CuEq methodology. Historical drilling results and results for holes S022 through S044 have been updated in the VRIFY drill-hole viewer and are available through VRIFY and the Company’s website. CuEq values are not calculated for intervals with soluble-copper assays (please refer to News Release of August 6, 2026).
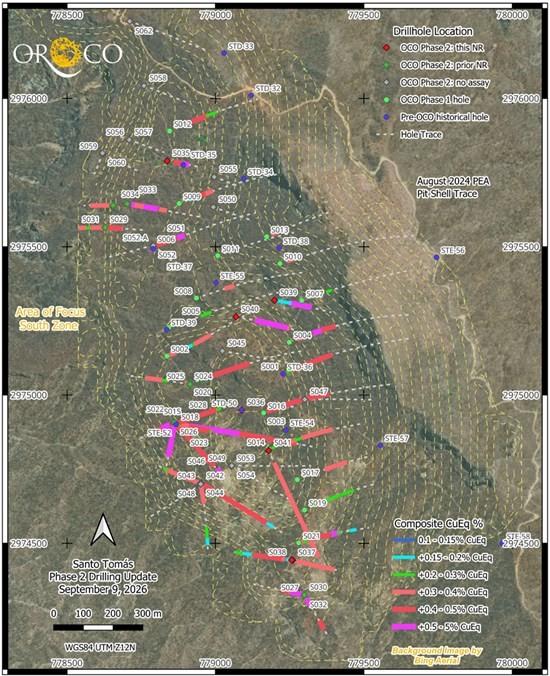
Figure 1: Phase 2 Drill Holes S035 to S044 located in relation to prior drilling and completed Phase 2 holes awaiting assay results.
Table 3: Metal Prices Used for Phase 2 CuEq Calculations
| Metal | Cu | Mo | Au | Ag |
| Price (rounded) | US$5.00/lb | US$25.75/lb | US$4,070/oz | US$56.50/oz |
| Actual trailing average | US$5.05/lb | US$25.74/lb | US$4,070.20/oz | US$56.40/oz |
Quality Assurance / Quality Control
Both the historical drilling data used in the current exploration program and Mineral Resource Estimate and the Phase 2 drilling data reported in this news release were subject to the data-verification procedures described in the Company’s current technical report. Drill-collar locations are verified by differential GPS and checked against LiDAR data. Geological logging, core sampling, sample preparation, analysis and chain of custody are governed by QA/QC protocols that include certified reference materials, blanks and duplicates. Samples are prepared by ALS Chemex in Hermosillo, Mexico, and pulps are sent to ALS Canada Ltd. in Vancouver for analysis. Total copper, molybdenum and silver are determined by ALS method ME-ICP61 (four-acid ICP-AES). Over-limit copper is re-assayed using Cu-OG62, soluble copper is determined by Cu-AA05, and gold is determined by Au-AA23 (30 g fire assay with an AAS finish).
Qualified Person
Andrew Ware, RM-SME, a Qualified Person as defined by National Instrument 43-101 – Standards of Disclosure for Mineral Projects and a senior consulting geoscientist to the Company, has reviewed and approved the scientific and technical information in this news release. The Company follows CIM Best Practices Guidelines in conducting, documenting and reporting its exploration activities.
About Santo Tomás
Santo Tomás is an advanced-stage porphyry copper project in Choix, Sinaloa, Mexico. Oroco holds a net 88.5% interest in the 1,173-hectare Core Concessions and an 80% interest in the surrounding concessions. Historical drilling between 1968 and 1994, together with Oroco’s Phase 1 program of 48,481 m in 76 diamond drill holes, supported the revised Mineral Resource Estimate (“MRE”) and updated PEA.
The August 2024 MRE, prepared by SRK Consulting (U.S.), Inc., outlined an Indicated Resource of 540.6 Mt at 0.33% Cu, 0.008% Mo, 0.028 ppm Au and 2.1 ppm Ag and an Inferred Resource of 530.3 Mt at 0.31% Cu, 0.007% Mo, 0.023 ppm Au and 1.9 ppm Ag. The updated PEA, prepared by Ausenco Engineering USA South Inc., contemplates a staged, open-pit operation ramping from 60,000 t/d in Year 1 to 120,000 t/d by Year 8 over a 22.6-year life of mine, generating an after-tax NPV₈% of US$1.48 billion and an after-tax IRR of 22.2%. Both studies are available at www.orocoresourcecorp.com and on SEDAR+ at www.sedarplus.ca. The PEA is preliminary in nature; see “Cautionary Note” below.
About Oroco Resource Corp.
Oroco Resource Corp. is a Vancouver-based mineral exploration and development company advancing the Santo Tomás copper project in Sinaloa, Mexico.
Brutus Mining Inc. (CSE: BRU) (FSE: ZI3) is pleased to announce that it has closed its non-brokered ... READ MORE
Jaguar Uranium Corp. (NYSE American: JAGU) is pleased to announce an independent Mineral Resource E... READ MORE
Auro Metals Inc. (TSX-V: AURO) (OTCQB: AURFF), is pleased to announce the assay results of the fina... READ MORE
Endeavour Silver Corp. (NYSE: EXK) (TSX: EDR) is pleased to announce that repairs to the primary bal... READ MORE
Scorpio Gold Corp. (NASDAQ: SGLD) (TSX-V: SGLD) (OTCQB: SRCRF) (FSE: RY9) is pleased to announce re... READ MORE


