


![]()
NorthWest Copper Corp. (TSX-V: NWST) is pleased to announce an updated mineral resource estimate for the Kwanika Central deposit at its 100% owned Kwanika-Stardust Project, comprising the Kwanika Central, Kwanika South, and Stardust deposits. NorthWest plans to use the updated Mineral Resource estimate to support an updated Preliminary Economic Assessment targeted for completion in mid 2026.
Paul Olmsted, CEO of NorthWest, commented: “This updated Mineral Resource Estimate represents a significant milestone for the Company and reinforces our strategy of prioritizing higher-grade copper and gold mineralization at Kwanika. The update is an excellent result, demonstrating a substantial Mineral Resource base from which to develop preliminary open pit and underground mine plans that can support a long mine life. Importantly, the results mark a major step toward our goal of a more capital-efficient, top-down underground mining approach, including sub-level caving and sub-level retreat mining methods. In addition, the significant open pit component should help de-risk the early years of a mine schedule, particularly with the potential for a higher-grade starter pit. With this milestone achieved, our immediate focus shifts to advancing the Project toward completion of a PEA in mid-2026. We believe this next phase of work will further demonstrate the opportunity to deliver a more economically compelling Project relative to the 2023 PEA as we continue to advance Kwanika toward development.”
Highlights Kwanika Central Deposit:
Geoff Chinn, VP Business Development and Exploration added: “The updated Kwanika Central Mineral Resource differs in several important ways from previous estimates. Mineralized zones have been more clearly defined and separated into higher-grade and lower-grade zones, as well as into gold and copper dominant zones, fundamentally re-mapping our understanding of the deposit. We have also recognized that sub-parallel, wide mineralized zones are separated by zones of host rock. Notably, this is the first time Mineral Resources has been disclosed with a top-down sub-level cave mining method in mind. A key feature of sub-level cave Mineral Resources is that all material within the preliminary caving shape is considered without a cut-off grade. To illustrate this, we note that approximately 24% of the sub-level cave volume comprises host rock within the mining envelope. As the Project advances to the PEA stage, a goal will be to manage dilution. Two key initiatives aimed at achieving this goal include advancing higher resolution mine designs and processing technologies like ore sorting, as disclosed in our February 23, 2026, News Release.”
Mineral Resource Overview:
The updated Mineral Resource Estimate for Kwanika Central was prepared by SLR Consulting (Canada) Ltd. in accordance with the Canadian Institute of Mining and Metallurgy and Petroleum definitions, as required under National Instrument 43-101. SLR is independent of NorthWest.
The Mineral Resource Estimates for the Stardust and Kwanika South deposits remain unchanged from those disclosed in the Technical Report entitled “Kwanika-Stardust Project, NI 43-101 Technical Report” with an effective date of January 4, 2023, filed on SEDAR+ on February 17, 2023.
The following is the current Mineral Resource estimate as at February 27, 2026.
Table 1 Kwanika Central Mineral Resource Summary (as at the Effective Date)
| Category | Tonnes (Mt) | Grade | Contained Metal | |||||
| Cu % | Au (g/t) | Ag (g/t) | CuEq (%) | Cu (Mlbs) | Au (koz) | Ag (koz) | ||
| Indicated | 16.22 | 0.63 | 0.74 | 2.0 | 1.27 | 226.6 | 383 | 1,035 |
| Inferred | 28.97 | 0.48 | 0.63 | 1.5 | 1.05 | 307.6 | 589 | 1,393 |
Notes:
Table 2a Breakdown of Open Pit Mineral Resource at Kwanika Central Deposit
| Category | Tonnes (Mt) | Grade | Contained Metal | |||||
| Cu % | Au (g/t) | Ag (g/t) | CuEq (%) | Cu (Mlbs) | Au (koz) | Ag (koz) | ||
| Indicated | 8.99 | 0.55 | 0.51 | 1.8 | 0.98 | 109.5 | 148 | 512 |
| Inferred | 9.18 | 0.33 | 0.35 | 1.0 | 0.63 | 66.1 | 104 | 300 |
Notes:
Table 2b Breakdown of Sub-Level Cave Mineral Resource at Kwanika Central Deposit
| Category | Tonnes (Mt) | Average Grade | Contained Metal | |||||
| Cu % | Au (g/t) | Ag (g/t) | CuEq (%) | Cu (Mlbs) | Au (koz) | Ag (koz) | ||
| Indicated | 7.23 | 0.73 | 1.01 | 2.3 | 1.64 | 117.0 | 235 | 523 |
| Inferred | 19.80 | 0.55 | 0.76 | 1.7 | 1.24 | 241.5 | 485 | 1,093 |
Notes:
Dilution in the Mineral Resources
For underground sub-level caving methods, Mineral Resources are constrained within conceptual mining shapes developed using an NSR cut-off of C$56.76/t to demonstrate reasonable prospects for eventual economic extraction. At Kwanika Central, all Indicated and Inferred material contained within the resulting sub-level cave reporting shapes is included in the Mineral Resource, with no additional cut-off applied within the shapes. This reporting approach reflects the inherent inclusion of internal dilution (“must take” material) within the mineralized zones associated with the mining method.
Additional host rock located within the conceptual sub-level cave mining envelope but outside the mineralized zones is also noted for transparency and represents potential additional dilution inherent to the mining method.
More detailed mine design and processing studies will be required to quantify dilution and to assess the potential impact of ore sorting work recently reported by the Company. To provide additional transparency, Table 2b notes the tonnage of poorly mineralized host rock contained within the SLC reporting shapes.
Property
The 35,700 ha Kwanka-Stardust project is 100% owned and is located 150 km north of Fort St. James in the Omineca Mining Division of north-central British Columbia.
Geology
The Kwanika Central and South deposits are located along the western margin of the Quesnel Terrane, a Late Paleozoic to Early Jurassic island arc that hosts numerous calc-alkalic to alkalic Cu-Au porphyry deposits including the Copper Mountain mine, Mount Milligan mine and New Afton Cu-Au mines, the giant Highland Valley Cu-Mo mine, and NorthWest Copper’s Lorraine – Top Cat Cu-Au-Ag±PGE porphyry project.
Kwanika geology is dominated by Jurassic intrusions that are part of the Hogem batholith, to which Kwanika mineralization is related, emplaced into favourable Triassic Takla Group volcanic rocks. The Kwanika hydrothermal system and the Hogem intrusions are truncated on their west side by the Pinchi fault, a regional-scale dextral strike-slip structure. Mineral resources at Kwanika are hosted at the Central deposit with additional mineral potential in and around the Central and South deposit areas.
The Stardust deposit is located only 7 km northwest of the Kwanika Central deposit. It is hosted by the Late Paleozoic Cache Creek Terrane, which occurs west of the Pinchi Fault. Mineralization at Stardust deposit is related to the Eocene Glover Stock, a multiphase felsic intrusion emplaced into Cache Creek limestones and clastic sedimentary rocks. Stardust is a high-grade Cu-Au carbonate replacement deposit (CRD, including skarn).
Stardust occurs in one part of a 2.2 km long corridor that exhibits classic CRD zoning progressing from the northwest to the southeast through:
The Kwanika Central, Kwanika South and Stardust deposits together comprise the Kwanika-Stardust project.
Mineral Resource Estimation Methodology
At the Kwanika Central deposit, sixteen mineralized zones were defined by NWST as follows:
Assay caps were applied on a zone-by-zone basis prior to compositing. Two metre fixed length-weighted composites were used for the interpolation of grades into the block model using inverse distance squared (ID2) interpolation and compared against nearest neighbor (NN) via swath plots and tables for consistency. High-grade search restrictions were implemented within certain zones. A sub-blocked model was created using a 5 m parent cell size with 2.5 m sub block increments to accurately reproduce the wireframe volumes. Block model bulk density values were assigned on a zone-by-zone basis using the arithmetic mean of validated density measurements from samples collected within each mineralized zone. Fixed average bulk density values were assigned to blocks outside the mineralized zones.
MRE classification was based primarily on closest three-hole spacings of up to approximately 35 m (nominal 50 m regular drill spacing) for Indicated Mineral Resources and up to approximately 70 m (nominal 100 m regular drill spacing) for Inferred Mineral Resources, which were applied to create continuous classification categories.
Figure 1: Oblique view of the Mineral Resource pit and sublevel-cave shapes
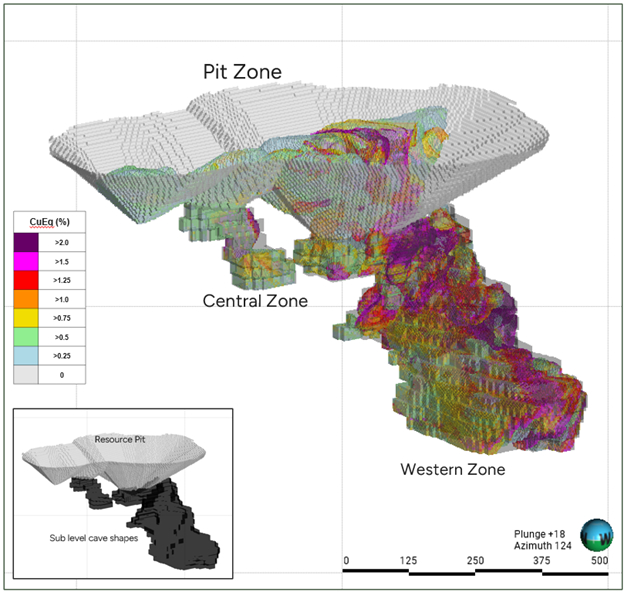
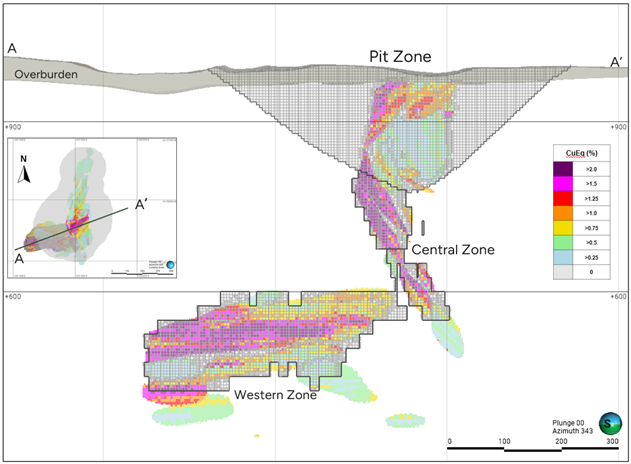
Figure 2: Kwanika Central Deposit Looking Northwest
Metallurgy
For processing, material was ground to a primary grind P80 of approximately 53 microns using conventional ball mills. The majority of the copper mineralization floated quickly, while mineralization with slower kinetics was treated separately in a dedicated bulk flotation circuit. Treating the two different mineralogy’s separately, significantly improved the metallurgical response, while allowing flexibility in the flowsheet. Approximately 89.6% of the copper mineralization was recovered to concentrates. The downstream process included leaching of the float tailings, which increased overall gold extraction in the central zone to over 95%. Reagent consumption during the leach was decreased relative to the previous work as the residual copper content was low. This in turn, allowed the process to use standard tailings treatment processes.
Based on recent test work and project experience, Canenco recommended the following concentrate characteristics, smelter terms and tailing leach parameters to be used in the Mineral Resource estimate:
| Metallurgical Recoveries | Unit | Values |
| Copper | % | 89.6 |
| Gold in Cu | % | 76.3 |
| Gold in Dore | % | 19.2 |
| Gold Total | % | 95.5 |
| Silver in Cu | % | 79.9 |
| Silver in Dore | % | 16.4 |
| Silver Total | % | 96.3 |
| Metal | Unit | Price | |
| Cu | US$/lb | $4.50 | |
| Ag | US$/oz | $36.00 | |
| Au | US$/oz | $3,100 | |
| Concentrate Grades | Unit | Values |
| Copper concentrate | %Cu | 24.5 |
| g/t Au | 40.3 | |
| g/t Ag | 71.6 |
| Copper Concentrate Marketing | Unit | Values |
| Concentrate moisture | % | 9 |
| Transportation (Port/Port Charges/Ocean) | US$/wmt | 269.20 |
| Marketing fee/insurance | % deduction | NA |
| Smelter treatment charge | US$/dmt | 21.25 |
| Copper payable | % | 96.5 |
| Copper refining charge | US$/lb payable | 0.02125 |
| min Copper deduction | % deduction | 1 |
| Gold payable | % | 97 |
| min Gold payable | g/t in Conc | 1 |
| Gold refining charge | US$/oz payable | 5.00 |
| Silver payable | % | 90 |
| min Silver payable | g/t in Conc | 30 |
| Silver refining charge | US$/oz payable | 0.50 |
| Ag/Au Leach – Dore Marketing | Unit | Values |
| Transportation | US$/oz payable | 10.00 |
| Gold payable | % | 99.5 |
| Gold refining charge | US$/oz payable | 5.00 |
| Silver payable | % | 99 |
| Silver refining charge | US$/oz payable | 0.50 |
Net smelter return values were calculated on a block-by-block basis using copper, gold, and silver block grades with the input parameters listed in the tables above. For NSR and CuEq calculations, fixed smelter terms, and recovery values are applied to all blocks within each zone as provided below.
Kwanika Central:
CAD_NSR = (([CU] * (82.46-12.3558)) + ([AU]*92.8704) + ([AG]*0.42))/0.74
CUEQ = ([CAD_NSR] * 0.74) / (4.51*22.046*0.896)
Mining Constraints/RPEEE Shapes
Blocks were constrained by open pit shells and sub-level cave underground mining shapes at a base case mining scenario to demonstrate RPEEE at an NSR cut-off of $24.06/t for open pit and $56.75/t for sub-level caving. The cut-off grades were selected using cost estimates listed in the table below that assume: a processing throughput rate of 7,000 tonnes-per-day (tpd).
| Operating Costs | Unit | Values | |
| Mining costs (OP) | CAD$/t mined | $5.12 | |
| Mining costs (SLC) | CAD$/t mined | $32.70 | |
| Sorting costs | CAD$/t ROM ore | $1.19 | |
| Process costs | CAD$/t ROM ore | $17.71 | |
| G&A costs | CAD$/t ROM ore | $5.15 | |
| Process + Sorting+ G&A Costs | CAD$/t ROM ore | $24.06 | |
Reasonable prospects of eventual economic extraction were demonstrated for the reported Mineral Resource estimate by constraining the open pit material within preliminary optimized pit shells, while the underground material was constrained within sub-level cave shapes.
Open pit Mineral Resource estimates were reported above a C$24.06/t NSR reporting cut-off value, whereas sub-level cave Mineral Resource estimates were reported at a C$0/t NSR cut-off.
At Kwanika Central, for the purposes of open pit and underground RPEEE mining shape optimization, the estimated block model was re-blocked to 5 m by 5 m by 5 m and reported within a sub-blocked model with 5 m by 5 m by 5 m parent cells with 2.5m sub-blocks.
About NorthWest:
NorthWest is a copper-gold exploration and development company with a pipeline of advanced and early-stage projects in British Columbia, including Kwanika-Stardust, Lorraine-Top Cat and East Niv. With a robust portfolio in an established mining jurisdiction, NorthWest is well positioned to participate fully in strengthening global copper and gold markets. The Company is committed to responsible mineral exploration, working collaboratively with First Nations to help ensure future development incorporates stewardship best practices and respects traditional land use. Additional information can be found on the Company’s website at www.northwestcopper.ca.
On Behalf of NorthWest
“Paul Olmsted”
CEO, NorthWest Copper
For further information, please contact:
416-457-3333
info@northwestcopper.ca
Summit Royalties Ltd. (TSX-V: SUM) (OTCQX: SUMMF) is pleased to r... READ MORE
Silver Elephant Mining Corp. (TSX: ELEF) (OTCQB: SILEF) (FSE: 1P... READ MORE
Winshear Metals Corp. (TSX-V: WINS) (FRA: 9HR0) reports positive ... READ MORE
Barksdale Resources Corp. (TSX-V: BRO) (OTCQB: BRKCF) (FSE: 2NZ) ... READ MORE
Prospector Metals Corp. (TSX-V: PPP) (OTCQB: PMCOF) (FSE: 1ET) ... READ MORE


