


Nighthawk Gold Corp. (TSX: NHK) (OTCQX: MIMZF) is pleased to report its maiden PEA1 for the Colomac Gold Project, located 200 kilometres north of Yellowknife, NWT, Canada. Please refer to Tables 1 and 2 for a summary of the Project PEA economics and Conceptual LOM plan, respectively.
Table 1: Project PEA1 Economics*
| Potential Economics | Gold Price (US$/oz) | |||
| US$1,300
Downside |
US$1,600
Base Case |
US$1,672
Long-term Consensus3 |
US$2,000
Upside Case |
|
| Pre-tax IRR (%) | 22.5% | 42.4% | 47.1% | 68.1% |
| After-tax IRR (%) | 18.4% | 34.6% | 38.5% | 56.2% |
| Pre-tax NPV5% (C$M) | $824 | $1,800 | $2,034 | $3,101 |
| After-tax NPV5% (C$M) | $532 | $1,170 | $1,322 | $2,016 |
| After-tax LOM free cash flow (“FCF”)4,
Net of Initial Capex (“C$M”) |
$958 | $1,802 | $2,005 | $2,927 |
| FX rate assumption (US$/C$) | 0.74 | 0.74 | 0.74 | 0.74 |
| Pre-taxNPV5%/Initial Capex ratio | 1.3x | 2.8x | 3.1x | 4.7x |
| After-taxNPV5%/Initial Capex ratio | 0.8x | 1.8x | 2.0x | 3.1x |
| Pre-tax Payback period (years) | 4.1 | 2.1 | 1.9 | 1.5 |
| After-tax Payback period (years) | 4.9 | 2.1 | 1.9 | 1.5 |
| *Numbers may not add up due to rounding | ||||
Table 2: Conceptual LOM Plan, Capex, Cost, and ESG Summary*
| Metrics | LOM Total | Average
or Per Unit |
| Conceptual Production | ||
| Conceptual mine life (“LOM”) | 11.2 years | – |
| Waste material – Open Pit (“OP”)(M tonnes (“t”)) | 554.1 Mt | 49.5 Mt/year |
| Mineralized material OP + Underground (“UG”)(Mt) | 67.2 Mt | 6.0 Mt/year |
| OP strip ratio (Waste : Mineralized Material) | 9.0 | |
| Mill head grade – grams per tonne gold (“g/t Au”) | 1.57 g/t Au | – |
| Mill recovery rate (%) | 96.3% | – |
| Potential LOM payable gold production (Koz) | 3,256 Koz | 290Koz/year |
| OP production
UG Production |
2,503Koz
753Koz |
223Koz/year
67Koz/year |
| Peak potential payable gold production – Year 2 | 340Koz | – |
| Potential payable gold production – Years 1-4 | 1,254Koz | 313Koz/year |
| Capex and Operating Costs (“Opex”) | ||
| Initial Capex (including contingency) | C$654M | – |
| Sustaining Capex | C$665M | C$59M/year |
| Total Cash Costs | C$2,960M | US$673/oz |
| AISC2 | C$3,643M | US$828/oz |
| AIC2 | C$4,297M | US$977/oz |
| ESG | ||
| Sustainable energy dependency (wind + solar) | 60% | |
| Carbon intensity | 0.48t CO2e/oz | |
| Mill and site | 0.18t CO2e/oz | |
| Mining fleet | 0.30t CO2e/oz | |
| *Numbers may not add up due to rounding | ||
The PEA1 is preliminary in nature and includes inferred mineral resources that are considered too speculative geologically to have the economic considerations applied to them that would enable them to be categorized as mineral reserves, and there is no certainty that the PEA will be realized. Mineral resources that are not mineral reserves do not have demonstrated economic viability.
Nighthawk President and CEO Keyvan Salehi, P.Eng. commented: “The results of our PEA demonstrate that the Colomac Gold Project has the potential to be a phenomenal asset, and the PEA is a monumental milestone for our Company. The PEA gives us a snapshot of the free-cash-flow-generating potential of the Project. We believe that the Colomac Gold Project is a top-tier North American mining project that could deliver significant value to our shareholders and has the potential to meaningfully contribute to the NWT economy. Only a handful of gold projects in the world (that are owned by junior gold companies) have similar favourable economics with the potential to deliver approximately 300,000 oz of annual gold production over a 10 year mine life and achieve an NPV5% to Initial Capex ratio close to 2.0. As such, we believe our Project belongs to this rare class of global gold assets and that there is runway for the Project to continue to grow as we start exploring for other meaningful deposits across our massive greenstone Property.”
“All our deposits remain wide open along strike and at depth with the potential for further expansion of the existing mineral resources. Furthermore, we’ve only scratched the surface on the immense exploration upside of our 930 km2 District Scale Property; our Property has more than 27 historical gold occurrences that warrant follow-up exploration. We strongly believe that this Project PEA is the cornerstone of what could be a major gold camp.”
“We have an exciting rest of the year ahead of us. In the near term, we are expecting assay results from the highly prospective Leta Arm Zone. We are also planning to further drill the Cass, 24/27, and Damoti deposits, which we believe have the potential to expand mineralization beyond what has been outlined in the PEA. We look forward to updating the markets with our progress.”
Conceptual Mine Development and Mine Plan
Conceptual Mine Development
The Project envisions the extraction of mineralized material predominantly by OP mining, with a small portion of the overall mineralized material to be extracted via UG. Mineralized material will be mined from the following deposits:
See Figure 1 for the District Scale Property Regional Map displaying the location of the Project Deposits.
The main components of the PEA development plan include: a phased approach to pit development (minimal pre-stripping) of the OP deposits, the construction of haul roads to access the Satellite Deposits, and the development of ramp systems from surface to access the UG mineralized material. Construction is managed by EPCM then transitioned to owner-operator upon commencement of initial gold production. Conceptual mine development is expected to be completed over 24 months, with some mineralized material stockpiled ahead of the completion of the processing plant.
Conceptual Mine Plan
The PEA conceptual mine plan envisions a “hub-and-spoke” model. The main infrastructure and processing facilities are located within the Colomac Centre Area and mineralized material from the Satellite Deposits are trucked to the Colomac Centre Area via haul roads. The conceptual mine plan envisions a phased approach to mining the deposits and scheduling prioritizes the extraction of higher-grade (above 1.5 g/t Au gold grade) OP mineralization to maximize after-tax NPV5% and IRR.
The conceptual OP mining of the near-surface mineralized material envisions a conventional drill/blast/load/haul method within the 5-metre-high benches of the pit. The Colomac Main deposit contains the largest amount of OP mineralization and comprises 6 pit pushbacks (over a strike length of roughly 6 km) that are phased throughout the LOM. All Satellite Deposits are mined as one phase from top to bottom.
Conceptual UG mining utilizes mechanized cut-and-fill methods. UG mineralization will be accessed via portal and ramp system from surface. The average size of planned UG stopes is 20 metres (“m”) (height) x 20 m (depth) x 3 m (width).
The Conceptual mine plan covers a period of 11.2 years, followed by reclamation. Overall LOM average annual throughput is expected to reach a maximum capacity of 6.1 Mt per annum (“Mtpa”). The conceptual mine plan estimates an average overall OP strip ratio of 9.0, however the strip ratio varies depending on the deposit. The OP mill feed grades average 1.32 g/t Au over the LOM, and UG mill feed grades average 4.12 g/t Au over the LOM.
Assuming a 96.3% mill recovery (See “Processing” section for further details), the Project LOM potential payable gold production is 3.256 Moz for an average potential production profile of 290,000oz per year; for the first four years, average annual potential payable gold production 313,000oz per year.
See Figures 2-5 for the conceptual pit shells and surrounding infrastructure for the Colomac Centre (Colomac Main, Grizzly Bear, and Goldcrest), Kim and Cass, Damoti, and 24/27 Deposits, respectively. See Figure 6 for the Project PEA LOM potential production, capex and cost profile.
Project Powered by Sustainable Energy
The Project PEA contemplates the construction of wind turbines and solar panels to provide up to 60% of the year-round power requirements for the processing plant and camp operation. Wind and solar energy have been primary sources of power generation for a couple of NWT diamond mines for more than a decade. The remaining 40% power requirement would come from diesel generation. Initial and sustaining capex of the sustainable power supply amounts to C$103 million and C$10 million, respectively.
Processing
The Project PEA contemplates the processing of mineralized material through a conventional milling, gravity, and leach recovery circuit. The milling circuit consists of a primary crusher, secondary crusher, followed by a semi-autogenous grinding mill, gravity circuit and ball mill before entering the leaching circuit (See Figure 7 for the Planned Mill Circuit Flow Sheet). The average estimated gold recovery is 96.3%, which is supported by the metallurgical testing5 completed by the Company. The mill processing circuit has an operating capacity of up to 17,000t per day, or 6.1Mtpa.
Tailings Storage Facility, Water Management and Permitting
TSF
The PEA contemplates the phased construction of conventional tailings storage facilities. There is ample TSF capacity to handle the LOM waste material generated by the Project PEA. The TSF locations are proximal to the deposits. Please see Figures 2-5 for more information on the TSF locations.
Water Management
The conceptual OP mine plan requires the diversion of shallow bodies of water that are adjacent to some of the deposits. The largest body of water that requires diversion is Baton Lake, located on the eastside of the Colomac Main Deposit.
Permitting and Closure
Permitting requires a minimum of 2 years of environmental baseline studies to be completed as part of the Environmental Assessment. The EA is reviewed and approved by the NWT Mackenzie Valley Environmental Review Board (which includes all relevant Federal agencies as parties to the process). Upon EA approval, the Mackenzie Valley Land and Water Board will then process applications for a Water License and Land Use Permit through a public process. Closure and reclamation costs at the end of the mine life are estimated to be C$50 million.
Other Site Infrastructure
In addition to the mill, TMF, and sustainable power components, other site infrastructure includes a truck shop and other maintenance buildings, haul roads, 300-person camp, wastewater treatment plant, airstrip upgrade to accommodate cargo planes and ditching and sedimentation ponds for water management.
Capex and Opex
Please refer to Tables 3 and 4 for the Project PEA capex and opex, respectively.
Table 3 – Summary of the Project PEA Capex*
| Capex item | Initial
(C$M) |
Sustaining
(C$M) |
Total
(C$M) |
| Mining6 | $161 | $547 | $708 |
| Processing (including the mill) | $160 | – | $160 |
| TSF | $34 | $23 | $57 |
| Sustainable power supply (wind and solar) | $103 | $10 | $113 |
| Other Site Infrastructure
(including access roads and expanded airstrip) |
$42 | $53 | $95 |
| Total Directs: | $499 | $633 | $1,133 |
| Total Indirects7 | $59 | – | $59 |
| Closure (net of salvage) | – | $18 | $18 |
| Contingency (17%8) | $96 | $32 | $127 |
| Kim & Cass NSR Buyback | – | $3 | $3 |
| Total Capex | $654 | $686 | $1,340 |
| *Numbers may not add up due to rounding | |||
Table 4 – Summary of the Project Opex*
| Cost Item | LOM
(C$ millions) |
Per Mineralized Tonne
(C$/t) |
Per Production Ounce
(US$/oz) |
| Total Mining (OP+UG) | $2,183 | $3.5/t mined | $496 |
| OP mining | $1,504 | $2.5/t mined | $342 |
| UG mining | $680 | $115.0/t mined | $154 |
| Processing | $600 | $8.9/t milled | $136 |
| G&A | $168 | $2.5/t milled | $38 |
| Total operating cost | $2,952 | $43.9/t | $671 |
| Refining, transport, royalties | $8 | – | $2 |
| Total Cash Costs | $2,960 | $44.0/t | $673 |
| Total AISC | $3,643 | – | $828 |
| Total AIC | $4,297 | – | $977 |
| *Numbers may not add up due to rounding | |||
Taxes, Royalties, and Other Production Taxes
Corporate Taxable Income for entities located in the Northwest Territories are subject to a combined (federal and territorial) income tax rate of 26.5%. Furthermore, the Northwest Territories Mining Regulations require the payment of royalty taxes based on a “sliding scale” between 5-14% based on the output of the mine – mine output of C$10,000 triggers 5% in royalty taxes and C$45 million (and above) qualifies for the maximum 14% royalty tax rate.
There is a minor 2.5% net smelter royalty on the Kim and Cass Properties. The NSR agreement gives NHK the right to buy back 100% of the NSR for C$2.5 million, which the Company intends to execute before the commencement of potential commercial production.
Nighthawk intends to engage with the local First Nation communities as part of an impact benefits agreement or cooperation agreement.
Economics
Using a Base Case of US$1,600/oz Au, the Project generates C$1.2 billion of after-tax NPV5% and 35% after-tax IRR. At an Upside Case of US$2,000/oz Au, Project PEA generates C$2.0 billion after-tax NPV5% and 56% after-tax IRR. Below are select sensitivity tables:
Tables 5 (after-tax NPV5%) and 6 (after-tax IRR): Gold Price vs. US$/C$ Exchange Rate
| Table 5 | Table 6 | |||||||||||
| After-Tax NPV5% (C$M) Sensitivity To Gold Price and FX Rate | After-Tax IRR% Sensitivity To Gold Price and FX Rate | |||||||||||
| FX Rate (US$/C$) | Gold Price (US$/oz) | FX Rate (US$/C$) | Gold Price (US$/oz) | |||||||||
| $1,300 | $1,600 | $1,672 | $2,000 | $1,300 | $1,600 | $1,672 | $2,000 | |||||
| 0.80 | $321 | $915 | $1,057 | $1,700 | 0.80 | 13.0% | 28.2% | 31.7% | 48.3% | |||
| 0.77 | $422 | $1,038 | $1,184 | $1,852 | 0.77 | 15.6% | 31.3% | 35.0% | 52.1% | |||
| 0.74 | $532 | $1,170 | $1,322 | $2,016 | 0.74 | 18.4% | 34.6% | 38.5% | 56.2% | |||
| 0.72 | $609 | $1,264 | $1,421 | $2,133 | 0.72 | 20.4% | 37.0% | 41.0% | 59.2% | |||
| 0.70 | $691 | $1,363 | $1,525 | $2,257 | 0.70 | 22.5% | 39.5% | 43.7% | 62.3% | |||
Tables 7 (after-tax NPV5%) and 8 (after-tax IRR): Capex vs. Opex
| Table 7 | Table 8 | |||||||||||||
| After-Tax NPV5% (C$M) Sensitivity To Capex and Opex Change | After-Tax IRR% Sensitivity To Capex and Opex Change | |||||||||||||
| Total Capex Change | Total Capex Change | |||||||||||||
| Opex Change | (20.0%) | (10.0%) | Base Case | 10.0% | 20.0% | Opex Change | (20.0%) | (10.0%) | Base Case | 10.0% | 20.0% | |||
| (20.0%) | $1,621 | $1,540 | $1,457 | $1,374 | $1,292 | (20.0%) | 56.6% | 48.5% | 41.8% | 36.5% | 32.2% | |||
| (10.0%) | $1,479 | $1,396 | $1,313 | $1,231 | $1,148 | (10.0%) | 52.3% | 44.4% | 38.2% | 33.3% | 29.2% | |||
| Base Case | $1,335 | $1,252 | $1,170 | $1,087 | $1,004 | Base Case | 47.7% | 40.3% | 34.6% | 30.0% | 26.2% | |||
| 10.0% | $1,191 | $1,109 | $1,026 | $943 | $860 | 10.0% | 43.0% | 36.2% | 31.0% | 26.7% | 23.2% | |||
| 20.0% | $1,048 | $965 | $882 | $799 | $716 | 20.0% | 38.3% | 32.2% | 27.3% | 23.4% | 20.1% | |||
Tables 9 (after-tax NPV5%) and 10 (after-tax IRR): Mill Head Grade vs. Mill Recoveries
| Table 9 | Table 10 | |||||||||||||
| After-Tax NPV5% (C$M) Sensitivity To Head Grade and Recovery Change | After-Tax IRR% Sensitivity To Head Grade and Recovery Change | |||||||||||||
| Head Grade Change | Head Grade Change | |||||||||||||
| Mill Recovery | (10.0%) | (5.0%) | Base Case | 5.0% | 10.0% | Mill Recovery | (10.0%) | (5.0%) | Base Case | 5.0% | 10.0% | |||
| 98.0% | $883 | $1,056 | $1,228 | $1,400 | $1,573 | 98.0% | 27.3% | 31.6% | 36.0% | 40.4% | 44.9% | |||
| Base Case | $821 | $995 | $1,170 | $1,343 | $1,516 | Base Case | 25.8% | 30.2% | 34.6% | 39.0% | 43.5% | |||
| 95.0% | $788 | $956 | $1,123 | $1,289 | $1,456 | 95.0% | 24.9% | 29.1% | 33.3% | 37.5% | 41.8% | |||
| 92.5% | $709 | $872 | $1,035 | $1,197 | $1,360 | 92.5% | 22.9% | 27.0% | 31.1% | 35.2% | 39.3% | |||
The PEA is preliminary in nature and includes inferred mineral resources that are considered too speculative geologically to have the economic considerations applied to them that would enable them to be categorized as mineral reserves, and there is no certainty that the PEA will be realized. Mineral resources that are not mineral reserves do not have demonstrated economic viability.
Recommendations
The Company is evaluating a series of recommendations to further advance and de-risk the Project:
2023 Mineral Resource Estimate9
The 2023 MRE provides the basis for the PEA conceptual mine plan, please refer to Table 11 for the summary.
Table 11 – 2023 MRE9 Summary
| Indicated Mineral Resource | Inferred Mineral Resource | |||||
| Potential
mining method |
Tonnes
(000s) |
Grade
(g/t Au) |
Contained
gold ounces |
Tonnes
(000s) |
Grade
(g/t Au) |
Contained
gold ounces |
| Open Pit (OP) | 59,945 | 1.45 | 2,804,000 | 11,070 | 2.33 | 830,000 |
| Underground (UG) | 10,486 | 1.73 | 583,000 | 13,364 | 2.03 | 872,000 |
| Global (OP+UG) | 70,432 | 1.50 | 3,387,000 | 24,434 | 2.17 | 1,702,000 |
There is no certainty that the 2023 MRE will be converted to Proven and Probable Mineral Reserve categories or will be realized in the future. Mineral Resource estimates that are not Mineral Reserves do not have demonstrated economic viability. The 2023 MRE may be materially affected by environmental, permitting, legal, title, taxation, socio-political, marketing, or other relevant risks, uncertainties and other factors, as more particularly described in the Cautionary Statements at the end of this news release.
Technical Report and Qualified Persons
A Technical Report prepared in accordance with NI 43-101 (as defined below) in support of the PEA1 will be filed on SEDAR (www.sedar.com) within 45 days. Readers are encouraged to read the 2023 MRE9 and PEA Technical Reports in its entirety, including all qualifications, assumptions and exclusions that relate to the 2023 MRE and PEA. The PEA Technical Report is intended to be read as a whole, and sections should not be read or relied upon out of context.
Scientific and technical information related to the PEA1 and 2023 MRE10 contained in this news release has been reviewed and verified by:
These persons have the ability and authority to verify the authenticity and validity of this data and are independent from the Company.
John McBride, MSc., P.Geo., VP Exploration of Nighthawk, is a “Qualified Person” as defined by NI 43-101 for this Project, has reviewed and approved of the scientific and technical disclosure contained in this news release.
About Nighthawk Gold Corp.
Nighthawk is a Canadian-based gold exploration company with 100% ownership of more than 930 km2 District Scale Property within 200 km north of Yellowknife, Northwest Territories, Canada. The Colomac Gold Project PEA1 demonstrates a potential large-scale gold operation of 290,000oz/year per year over 11.2-year conceptual mine life that generates a C$1.2 billion after-tax NPV5% and 35% after-tax IRR based on a US$1,600/oz gold. Nighthawk’s experienced management team, with a track record of successfully advancing projects and operating mines, is working towards rapidly advancing its assets towards a development decision.
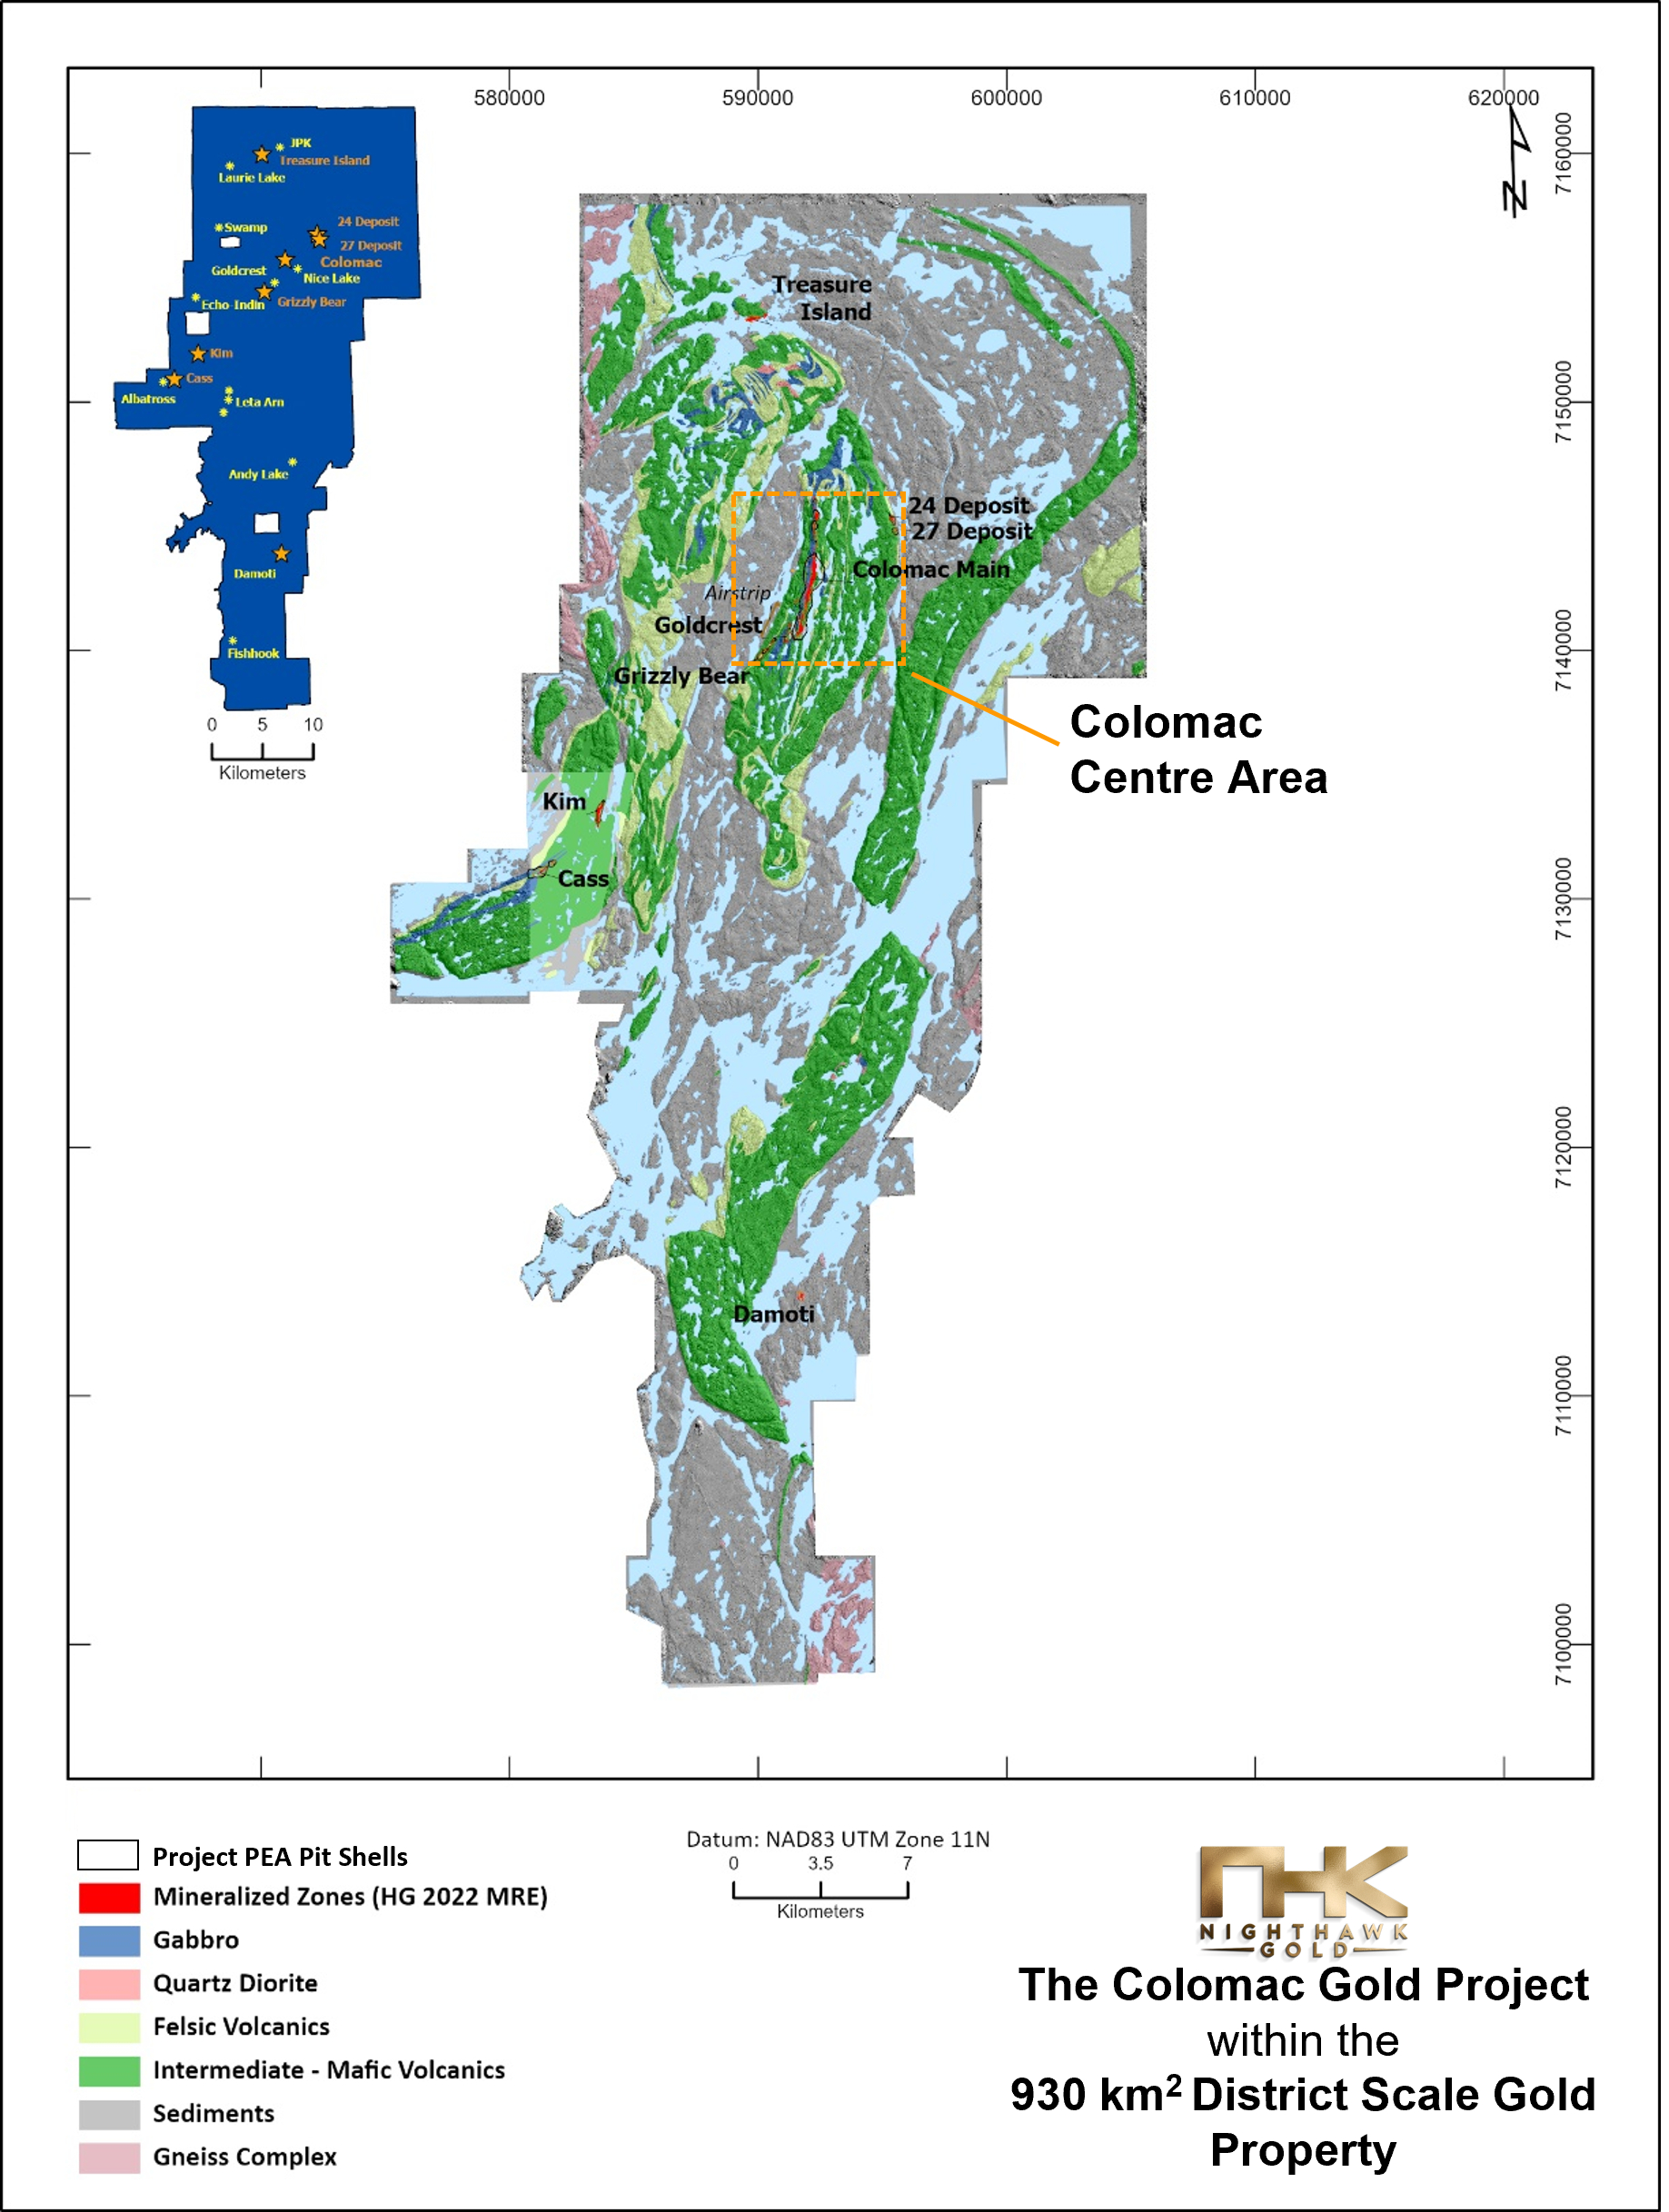
Figure 1 – The Colomac Gold Project within the District Scale Property – Map (Graphic: Business Wire)

Figure 2 – Colomac Centre Area – Colomac Main, Grizzly Bear, and Goldcrest Deposits Pit Shells and Main Infrastructure (Graphic: Business Wire)
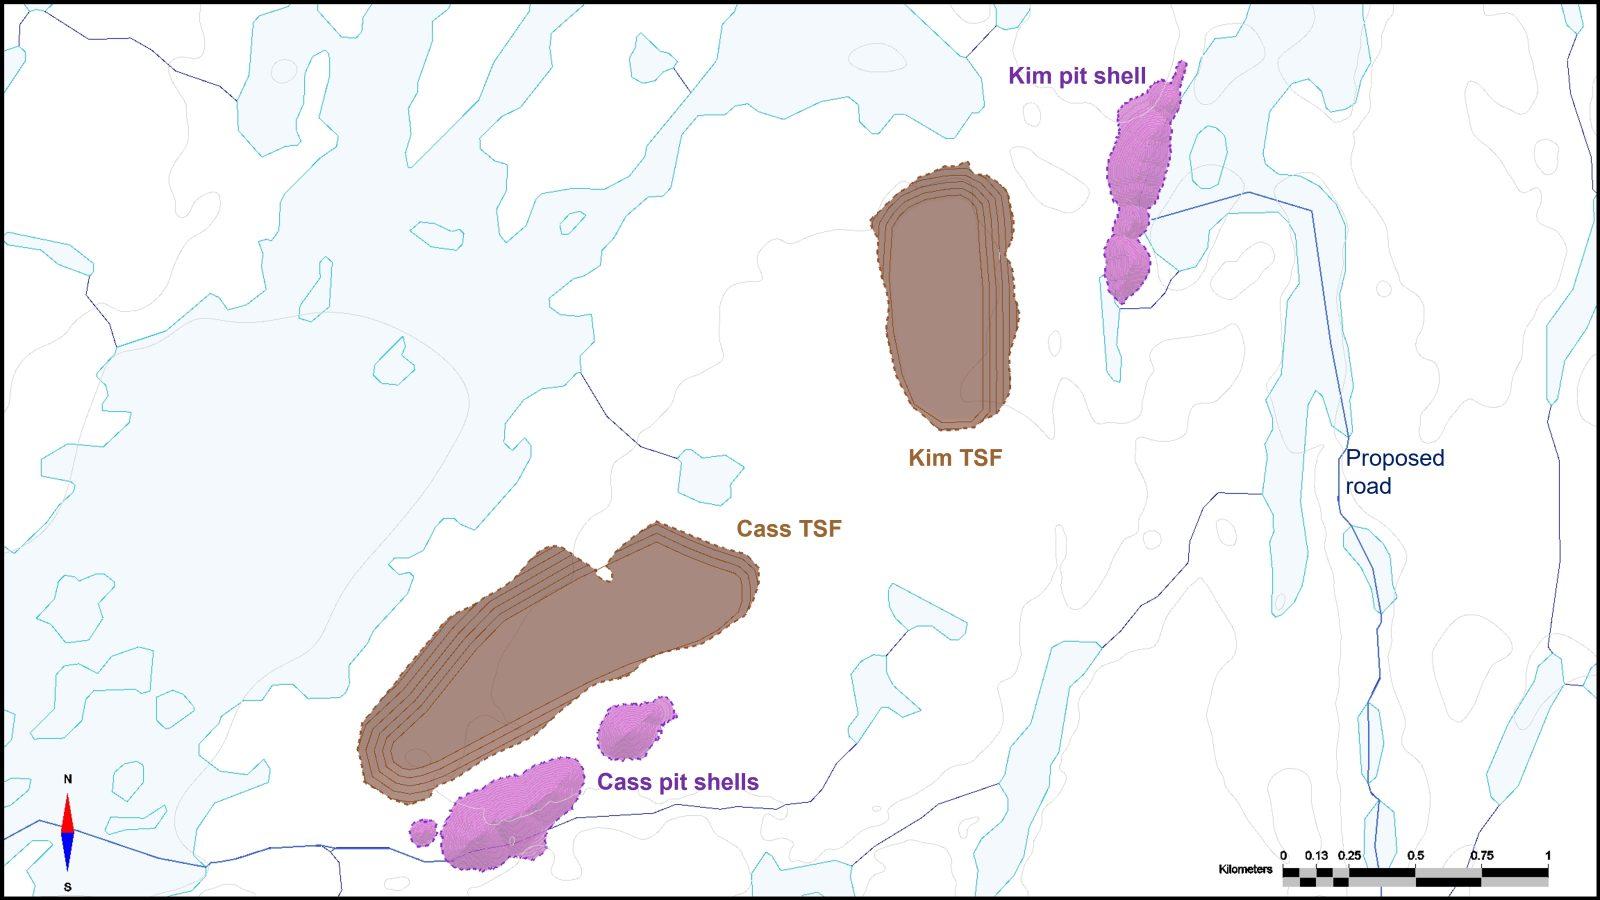
Figure 3 – Kim and Cass Deposits Pit Shells and TSF (Graphic: Business Wire)

Figure 4 – Damoti Deposit Pit Shells and TSF (Graphic: Business Wire)
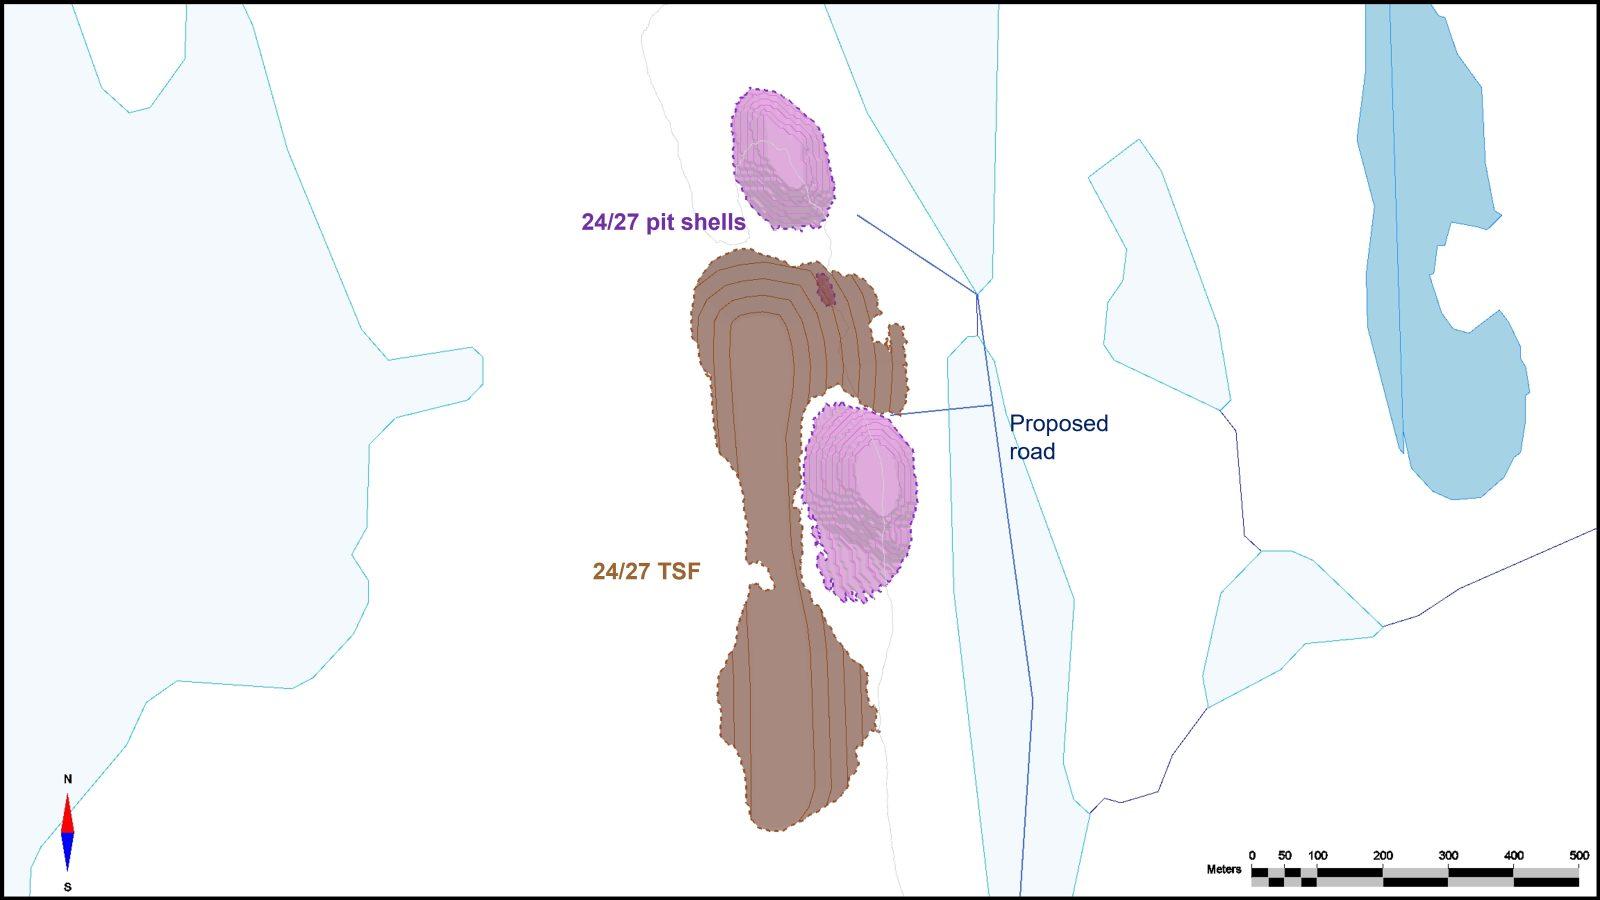
Figure 5 – 24/27 Deposit Pit Shells and TSF (Graphic: Business Wire)
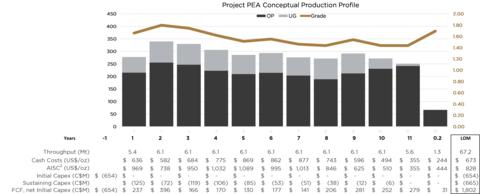
Figure 6 – Project PEA LOM Potential Production, Capex, Cost, and FCF Profile (Graphic: Business Wire)
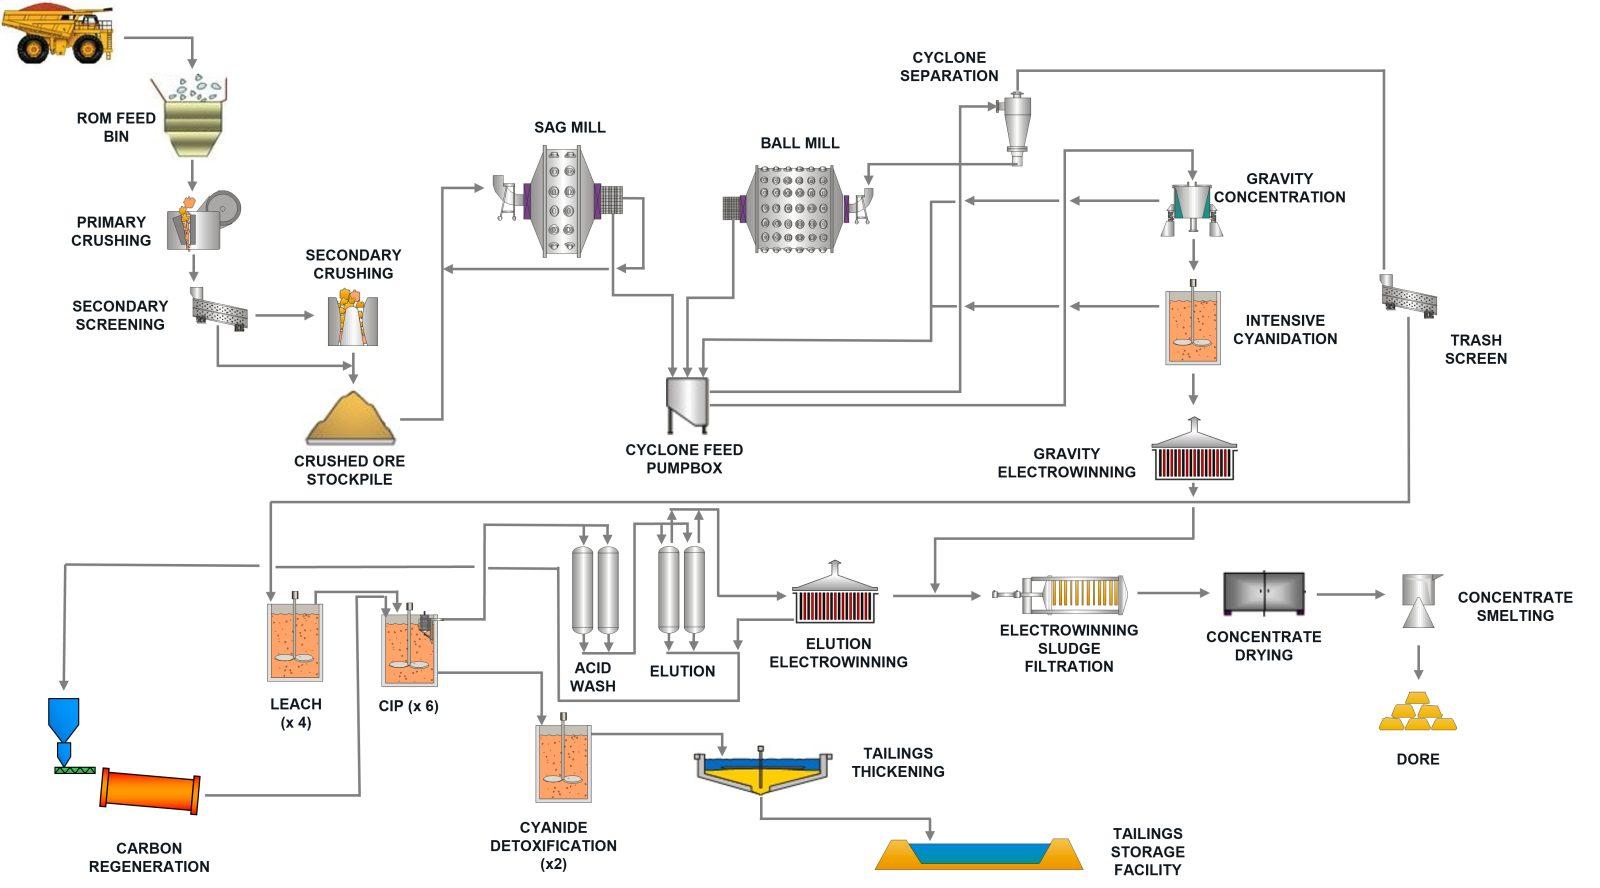
Figure 7 – Planned Mill Circuit Flow Sheet (Graphic: Business Wire)
Aura Minerals Inc. (NASDAQ: AUGO) (B3: AURA33) is pleased to anno... READ MORE
GR Silver Mining Ltd. (TSX-V: GRSL) (OTCQX: GRSLF) (FRANKF... READ MORE
Empress Royalty Corp. (TSX-V: EMPR | OTCQX: EMPYF) is pleased to ... READ MORE
JZR Gold Inc. (TSX-V: JZR) (OTCPK: JZRIF) is pleased to announce ... READ MORE
Colibri Resource Corporation (TSX-V: CBI) is pleased to announce ... READ MORE


