


NexGen Energy Ltd. (TSX:NXE) (NYSE:NXE) is pleased to announce the positive results of its independent maiden Preliminary Economic Assessment of the basement-hosted Arrow Deposit, located on the Company’s 100% owned Rook I project in Saskatchewan’s Athabasca Basin.
The maiden PEA was completed by Roscoe Postle Associates Inc. and is based on the mineral resource estimate announced by the Company in March 2017 (with an effective date of December 20, 2016) that comprised an Indicated Mineral Resource of 179.5 M lb of U3O8 contained in 1.18 M tonnes grading 6.88% U3O8, and an Inferred Mineral Resource of 122.1 M lb of U3O8 contained in 4.25 M tonnes grading 1.30% U3O8. The PEA does not include the results of the Company’s winter or summer 2017 drill programs which will total over 66,000 m of additional drilling.
Table 1 – Summary of Arrow Deposit Preliminary Economic Assessment
| PEA Financial Highlights | |
| After-Tax Net Present Value (NPV8%) | CAD $3.49 Billion |
| After-Tax Internal Rate of Return (IRR) | 56.7% |
| After-Tax Cash Payback | 1.1 Years |
| Pre-production Capital Costs (CAPEX) | CAD $1.19 Billion |
| Average Annual Production (Years 1-5) | 27.6 M lbs U3O8 |
| Average Annual Production (Life of Mine) | 18.5 M lbs U3O8 |
| Mine Life | 14.4 Years |
| Average Unit Operating Cost (Years 1-5) | CAD $5.53 (US $4.42)/lb U3O8 |
| Average Unit Operating Cost (Life of Mine) | CAD $8.37 (US $6.70)/lb U3O8 |
| Uranium Price Assumption | USD $50/lb U3O8 |
| Saskatchewan Royalties (Life of Mine) | CAD $2.98 Billion |
Exchange Rate CAD$1 = USD$0.80
Leigh Curyer, Chief Executive Officer, commented: “The Arrow Deposit is one of the most strategically significant and economically powerful mineral projects I am aware of across any resource commodity. Yet, it is still in it’s infancy in terms of ultimate resource size given the openness of mineralization and new discoveries in close proximity to Arrow highlighted in our recent drilling results. This PEA highlights Arrow’s unique technical setting, grade and characteristics of mineralization, resulting in it hosting the potential to be a leading source of mined uranium in the world with a relatively low capital and operating cost per lb over the life of the mine. Importantly, the project is located in Saskatchewan – regarded by the Fraser Institute in 2016 as the most attractive mining jurisdiction in the world for investment. With CAD$200 million in the treasury, NexGen is well financed to continue to expand and optimize economically this generational mineral resource.”
Table 2 – Summary of Arrow PEA Production Profile
| Unit | Years 1-5 | Years 1-10 | LOM | |
| Recovered Production | ||||
| Total Tonnes | kt | 2,502 | 5,050 | 7,310 |
| Average Annual Tonnes | ktpa | 501 | 505 | 487 |
| Tonnes per Day Processed | tpd | 1,430 | 1,445 | 1,448 |
| Average Annual Grade U3O8 | % | 2.62 | 2.14 | 1.73 |
| Total Pounds U3O8 | ‘000 lbs U3O8 | 137,955 | 227,713 | 267,203 |
| Average Annual Pounds U3O8 | ‘000 lbs U3O8 | 27,591 | 22,771 | 18,549 |
| Unit Operating Cost per Tonne | ||||
| Underground Mining | C$ / t proc | 129 | 128 | 132 |
| Processing | C$ / t proc | 112 | 112 | 111 |
| Surface & GA | C$ / t proc | 64 | 63 | 63 |
| Total Operating Cost | C$ / t proc | 305 | 303 | 306 |
| Unit Operating Cost | C$ / lb U3O8 | 5.53 (US $4.42) | 6.73 (US $5.39) | 8.37 (US $6.70) |
| Operating Margin | % | 90.4 | 88.3 | 85.5 |
Table 3 – PEA Sensitivity to Uranium Price
| Uranium Price ($ USD/lb U3O8) | After-Tax NPV1,2 | After-Tax IRR | After-Tax Cash Pay Back1,2 |
| $80/lb U3O8 | CAD $6.45 Billion | 82.3% | 0.7 Years |
| $60/lb U3O8 | CAD $4.48 Billion | 65.9% | 0.9 Years |
| $50/lb U3O8 | CAD $3.49 Billion | 56.7% | 1.1 Years |
| $40/lb U3O8 | CAD $2.49 Billion | 46.2% | 1.4 Years |
| $30/lb U3O8 | CAD $1.50 Billion | 34.1% | 1.9 Years |
| $25/lb U3O8 | CAD $1.00 Billion | 27.0% | 2.4 Years |
| Notes: 1. Based on an 8% Discount Rate. 2. Based on a 0.80 USD / 1.00 CAD Exchange Rate. |
|||
Figure 1 – Arrow Undiscounted Cumulative After-Tax Cash Flow

Production Summary
The PEA envisions a production profile supported by conventional long-hole stope mining averaging 1,448 tonnes per day at an average head grade of 1.73% U3O8 over the life of mine. It is envisaged that mine production will be fed into a conventional uranium processing plant where uranium recovery is projected to be 96.0% over the life of mine.
It is envisaged that cemented paste fill tailings will be used, where tailings are constituted into a paste, mixed with approximately 5% cement and delivered back underground. The cemented paste fill tailings will be used to backfill stopes and the excess will be placed in a, purpose built, Underground Tailings Storage Facility (see Figure 3 below). Among many other benefits, this tailings management process is expected to significantly reduce the surface footprint of the project.
The positive results of the PEA are a function of a conventional long-hole stope mine plan conceivably extracting compact near-vertical high-grade uranium mineralization localized in competent crystalline basement rocks. Arrow is considered an optimal deposit for long-hole stope mining because it is comprised of stacked high-grade veins with strong continuity on strike, dip and vertical extent. Additionally, there are natural pillars due to the spacing between the mineralized A1 through A4 shears. Due to the geometry of the Arrow deposit, approximately 93% of the mineral resource was converted into mineable resources. The positive results of the PEA are further supported by a high process recovery rate (96.0%), due to simple mineralogy and low deleterious elements.
Figure 2 – Arrow Annual Production and Grade Profile

Figure 3 – Long Section View of Conceptual Arrow Deposit Mine Infrastructure

Capital Costs
The capital costs for the contemplated underground mine, process plant and supporting infrastructure at Arrow are estimated at CAD $1.66 billion including initial capital costs of CAD $1.19 billion. The initial capital cost includes a contingency of 25% or CAD $237 million. RPA estimated the capital costs based on input and consultation with leading expert service providers who have experience in construction projects and cost estimation both in the Athabasca Basin and globally. The CAPEX is summarized below in Table 4.
Table 4 – Summary Breakdown of Capital Cost Estimates
| Capital Costs ($ CAD Millions) | Initial | Sustaining | Total |
| Mine | $324 | $205 | $529 |
| Process Plant & Infrastructure & Indirect Costs | $627 | $199 | $826 |
| Decommissioning | – | $64 | $64 |
| Contingency | $237 | – | $237 |
| Total Capital Costs | $1,188 | $468 | $1,656 |
Operating Costs
The operating cost estimate is based on a shaft accessed underground mine with a conventional longitudinal and transverse long-hole stope mining method, conventional processing facility and underground placement of cemented paste tailings. The OPEX is summarized below in Table 5, and the total cash costs and average production from the Arrow deposit over the first five years is compared to current global producers of uranium in Figure 4 and other select underground global producers across commodities in Figure 5.
Table 5 – Unit Operating Cost Estimates
| Operating Costs | $ CAD/lb U3O8 |
| Mining | $3.61 |
| Mineral Processing | $3.03 |
| General and Administration | $1.73 |
| Total Operating Costs | $8.37 |
Figure 4 – Total Cash Costs and Annual Production Compared Globally

Notes to Figure 4:
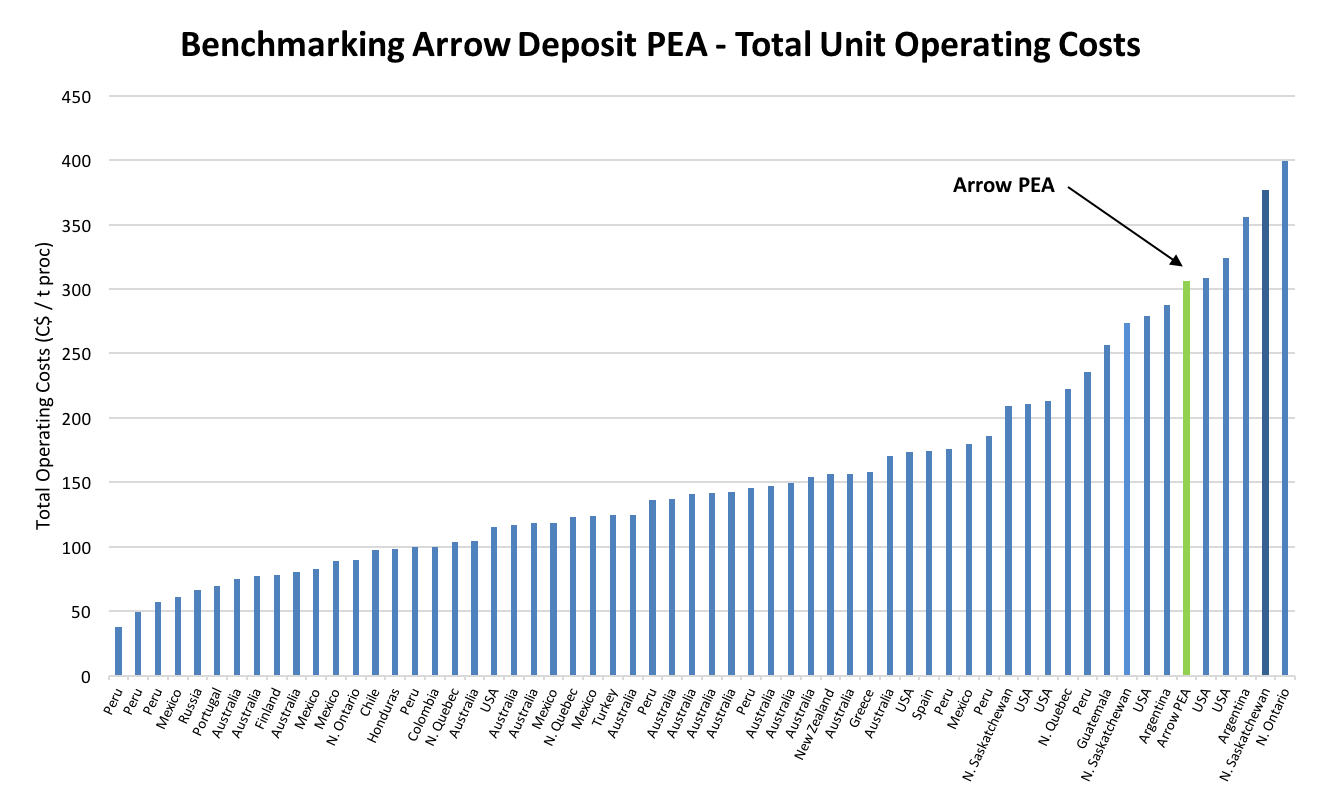
Figure 5 – Total Unit Operating Costs Per Tonne Costs Compared Globally

Notes to Figure 5:
The PEA is preliminary in nature and includes inferred mineral resources that are too speculative geologically to have economic considerations applied to them that would enable them to be categorized as mineral reserves. There is no certainty that PEA results will be realized. Mineral resources that are not mineral reserves do not have demonstrated economic viability.
About NexGen
NexGen is a British Columbia corporation with a focus on the acquisition, exploration and development of Canadian uranium projects. NexGen has a highly experienced team of uranium industry professionals with a successful track record in the discovery of uranium deposits and in developing projects through discovery to production.
NexGen owns a portfolio of prospective uranium exploration assets in the Athabasca Basin, Saskatchewan, Canada, including a 100% interest in Rook I, location of the Arrow Discovery in February 2014 and Bow Discovery in March 2015 and the Harpoon discovery in August 2016. The Arrow deposit’s updated mineral resource estimate with an effective date of December 20, 2016 was released in March 2017, and comprised 179.5 M lbs U3O8 contained in 1.18 M tonnes grading 6.88% U3O8 in the Indicated Mineral Resource category and an additional 122.1 M lbs U3O8 contained in 4.25 M tonnes grading 1.30% U3O8 in the Inferred Mineral Resource category.
Technical Disclosure
The scientific and technical information in this news release with respect to the PEA has been reviewed and approved by David Robson, P.Eng., M.B.A., and Jason Cox, P.Eng. of RPA, each of whom is an independent “qualified person” under National Instrument 43-101 – Standards of Disclosure for Mineral Projects (“NI-43-101“). All other scientific and technical information in this news release has been approved by Mr. Garrett Ainsworth, P.Geo., Vice President – Exploration & Development for NexGen. Mr. Ainsworth is a qualified person for the purposes of NI 43-101 and has verified the sampling, analytical, and test data underlying the information or opinions contained herein by reviewing original data certificates and monitoring all of the data collection protocols.
Significant copper and molybdenum intersections include: HM09: 13... READ MORE
Aya Gold & Silver Inc. (TSX: AYA) (OTCQX: AYASF) is pleased t... READ MORE
Key Highlights – Preliminary Economic Assessment Pre-Tax Net Pr... READ MORE
Aris Mining Corporation (TSX: ARIS) (NYSE-A: ARMN) announces its ... READ MORE
Orla Mining Ltd. (TSX: OLA) (NYSE: ORLA) announces the results fo... READ MORE


