New Pacific Metals Delivers Strong Economics for Carangas in Preliminary Economic Assessment
New Pacific Metals Corp. (TSX: NUAG) (NYSE-A: NEWP) is pleased to report the results of its Preliminary Economic Assessment for the Carangas project in Oruro Department, Bolivia. The PEA is based on the Mineral Resource Estimate for the Project, which was reported on September 5, 2023, and prepared in accordance with National Instrument 43‐101- Standards of Disclosure for Mineral Projects.
Highlights from the PEA are as follows (all figures in US Dollars):
- Post-tax net present value (5%) of $501 million and internal rate of return of 26% at a base case price of $24.00/oz silver, $1.25/lb zinc, and $0.95/lb lead;
- NPV and IRR of $748 million and 34%, respectively, at $30/oz silver;
- 16-year life of mine, excluding 2-years of pre-production, producing approximately 106 million oz of payable silver, 620 million pounds of payable zinc and 382 Mlbs of payable lead;
- Payable silver production of approximately 8.5 Moz per year in years one through six; with LOM average silver production exceeding 6.5 Moz per year;
- Initial capital costs of $324 million and a post-tax payback of 3.2 years;
- Average LOM all-in sustaining cost (“AISC”) of $7.60/oz silver, net of by-products; and
- Approximately 500 direct permanent jobs to be created from the Project.
“The PEA for the Carangas project marks a significant milestone for our company, outlining a robust, high-margin project with strong economics. By focusing our efforts on a discrete, near surface, subset of silver rich material we were able to define a project with a post-tax NPV of $501 million, an IRR of 26% and an initial capital expenditure of $324 million,” stated Andrew Williams, CEO and President.
“This study not only underscores the quality of this asset but also highlights the exceptional work of our team who discovered this greenfield project only three years ago. While Silver Sand remains our flagship asset, Carangas has become a significant standalone project for our Company. Carangas provides balance and scale to our portfolio of quality silver projects in Bolivia. We are grateful for the collaboration with the local community and government that has brought us to this point and look forward to continuing this partnership as we advance the Project and unlock value for all stakeholders.”
Economic Results and Sensitivities
Table 1 shows key assumptions and summarizes the projected production and economic results of the PEA. Tables 2 and 3 show sensitivities to silver prices and operating and capital costs.
Table 1: Carangas Open Pit Mining – Key Economic Assumptions and Results
| Item | Unit | Value |
| Silver Price | $/oz | 24 |
| Zinc Price | $/lb | 1.25 |
| Lead Price | $/lb | 0.95 |
| Total Mill Feed | Mt | 64.4 |
| Open Pit Strip Ratio1 | t:t | 1.7 |
| Annual Processing Rate | Mtpa | 4.0 |
| Average Silver Grade2 | g/t | 63 |
| Average Silver Grade in first 6 years | g/t | 83 |
| Silver Recovery | % | 87.3 |
| Total Payable Silver | Moz | 106 |
| Total Payable Zinc | Mlbs | 620 |
| Total Payable Lead | Mlbs | 382 |
| Mine Life3 | Yrs | 16.2 |
| Average Annual Payable Silver Metal over LOM | Moz | 6.6 |
| Annual Payable Silver Metal in first 6 years | Moz | 8.5 |
| Total Revenue | $M | 3,296 |
| Total Revenue Contribution from Silver | % | 76 |
| Total Operating Costs (net of by-products)4 | $/oz | 4.25 |
| Government Royalties | $/oz | 1.79 |
| AISC (net of by-products)5 | $/oz | 7.60 |
| Initial Capital Costs | $M | 324 |
| Sustaining Capital Costs6 | $M | 128 |
| Payback Period (post-tax)7 | Yrs | 3.2 |
| Cumulative Net Cash Flow (pre-tax) | $M | 1,447 |
| Cumulative Net Cash Flow (post-tax) | $M | 867 |
| Post-tax NPV (5%) | $M | 501 |
| Post-tax IRR | % | 26 |
| NPV (5%) to Initial Capex Ratio | $:$ | 1.5 |
|
Notes |
||
| 1. | LOM average strip ratio. | |
| 2. | LOM average. | |
| 3. | Excludes 2 years pre-production period. | |
| 4. | Includes mining costs, processing costs, tailing costs, G&A costs, and selling costs. | |
| 5. | Includes total operating costs, royalties, sustaining capital costs, and closure costs. | |
| 6. | Excludes mine closure costs of $39 M. | |
| 7. | The payback period is measured from the beginning of production after construction is completed. | |
Table 2: Carangas Project Economic Sensitivity Analysis for Silver Prices – Post-Tax
| Silver Price Sensitivity | |||||
| Silver Price (US$/oz) | $18.00 | $21.00 | $24.00 (Base Case) | $27.00 | $30.00 |
| Results (post-tax NPV $M / IRR) | 254/17% | 378/22% | 501/26% | 625/30% | 748/34% |
|
Note: Inputs for the base case (100%) are listed in Table 1. Table 2 presents how the Project’s post-tax NPV and IRR are affected by varying the selling price of silver. For example, if the silver price increases by $3/oz (from $24.00 to $27.00/oz) while other Inputs remain as the “Base Case”, then the NPV becomes $625 M and the IRR is 30%. NPV values are discounted at a rate of 5%. Zinc and lead prices are kept constant at $1.25/lb and $0.95/lb respectively. |
|||||
Table 3: Carangas Project Economic Sensitivity Analysis for Costs – Post-Tax
| Cost Sensitivity | |||||
| Sensitivity Items | -20 % | -10 % | 100% (Base Case) |
+10 % | +20 % |
| Mining Cost
(post-tax NPV $M / IRR) |
534/27% | 518/26% | 501/26% | 485/25% | 468/25% |
| Process Cost
(post-tax NPV $M / IRR) |
563/28% | 532/27% | 501/26% | 470/25% | 439/24% |
| Life-of-Mine Capex
(post-tax NPV $M / IRR) |
558/32% | 530/29% | 501/26% | 473/23% | 444/21% |
|
Note: Inputs for the base case (100%) are listed in Table 1. Table 3 lists sensitivity analysis for three “Input” variables. For example, if LOM Capex increases by 20% (+20%), while silver price, mine operating cost, and process operating cost remain the same as the “Base Case” input, the NPV becomes $444M and IRR is 21%. NPV values are discounted at a rate of 5%. |
|||||
Capital and Operating Costs
The Project, as outlined in the PEA, is anticipated to include an open-pit operation, with mining to be carried out by a contract mining company, supplying mill feed to a flotation plant, producing silver-lead and zinc concentrates. The PEA anticipates the Project will have several capital and operating cost advantages:
- Mineralized material is flat-lying and near-surface, which is anticipated to result in a shallow pit with a final depth of approximately 230 meters below surface and a low LOM average strip ratio of 1.7:1;
- It is proposed that the mine will be operated by a contractor with current operations in Bolivia, eliminating the need for the Company to procure a mining fleet and sustain capital for fleet replacement;
- Bond ball mill work index (BWi) averaging 12 and a Bond abrasion index (Ai) averaging 0.06, therefore it is anticipated that processing mineralized material will require modest power consumption and low grinding media consumption;
- Test work shows that total silver recoveries are favorable at 87.3%, with the Pb concentrate containing a high silver content expected to exceed 3,500 g/t, along with an absence of deleterious elements to enhance smelter terms;
- It is expected that the mine will be connected to the national electricity grid, providing low-cost power at $0.05/kWh to the processing plant and other on-site infrastructure;
- The site can be accessed via national highways and all-season local roads; and
- The Project could be a major supplier for a proposed government-operated zinc smelter in Oruro.
Table 4: Total Operating Cost Estimate
| Item | Cost ($/t milled) |
| Mining1 | 6.00 |
| Processing | 9.00 |
| General and Administration | 3.60 |
| Total operating cost | 18.60 |
| Note | |
| 1. | Mining cost is $2.48/t mined. |
A summary of capital costs is shown in Table 5.
Table 5: Total Capital Cost Estimate
| Item1 | Cost ($M) |
| Mine development | 43 |
| Processing plant | 188 |
| Site infrastructure2 | 68 |
| Tailings Storage Facility (“TSF”)3 | 14 |
| Owner’s cost | 11 |
| Initial capital | 324 |
| Life of mine sustaining capital4 | 167 |
|
Note |
|
| 1. | Includes direct, indirect, and contingency costs. Contingency costs total approximately $43 M. |
| 2. | Includes $37 M for a 200km 115 kV power line. |
| 3. | Tailings capital includes initial earthworks, liners/membranes, and a water management facility. |
| 4. | Sustaining capital costs include expansion of the TSF, refurbishment and replacement of processing equipment, and mine closure of $39 M. |
Mining
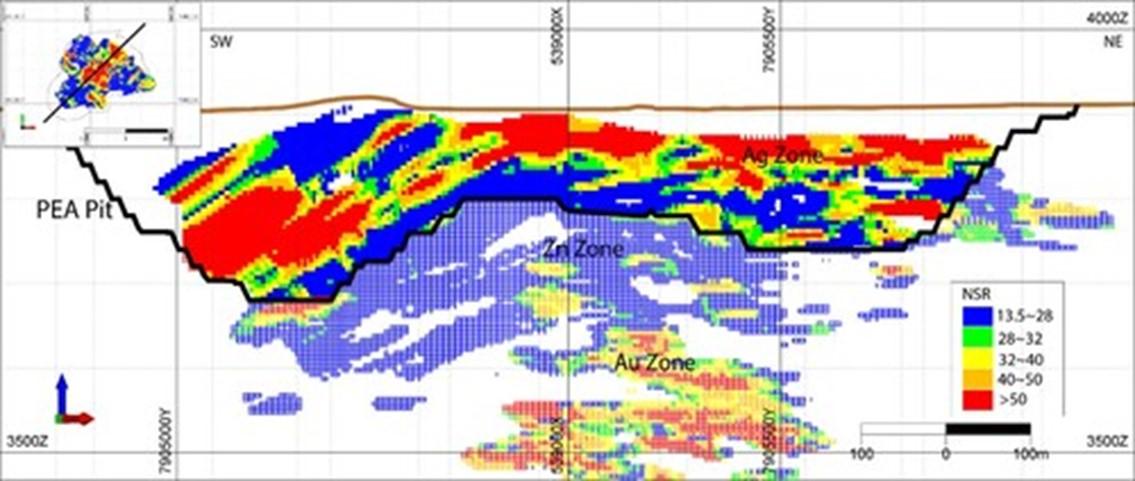
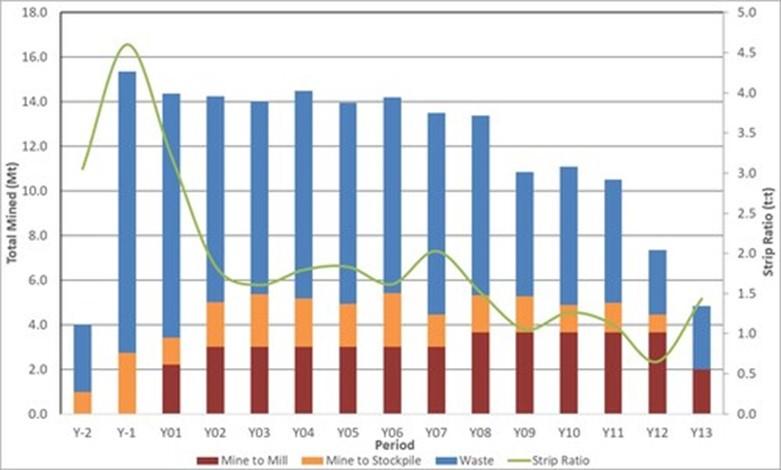
It is anticipated that the deposit will be mined using a conventional open pit approach. This entails drilling and blasting, with loading by hydraulic excavators and haulage by off-highway rear dump haul trucks. The PEA pit is designed to be relatively shallow, resulting in comparatively short hauls for both mill feed and waste. A SW-NE cross section showing the resource model grades and pit is illustrated in Figure 1. The mine production schedule is illustrated in Figure 2.
Mill feed tonnes and grade are a subset of the Mineral Resource Estimate, accounting for planned mining dilution and recovery. A mining net smelter return cutoff grade of $28/t was applied and all mined material below this cutoff grade is treated as waste. The mining cutoff grade was chosen to cover all operating costs as well as a built-in economic margin for the Project.
The PEA assumes that mill feed will be hauled to the primary crusher or a run-of-mine (“ROM”) stockpile near the crusher. A portion of the oxides and lower grade resources mined in the early years are planned to be stockpiled and processed over the life of mine. Waste rock will be hauled to waste storage facilities. It is anticipated that mine operations will be conducted by a contractor with current operations in Bolivia.
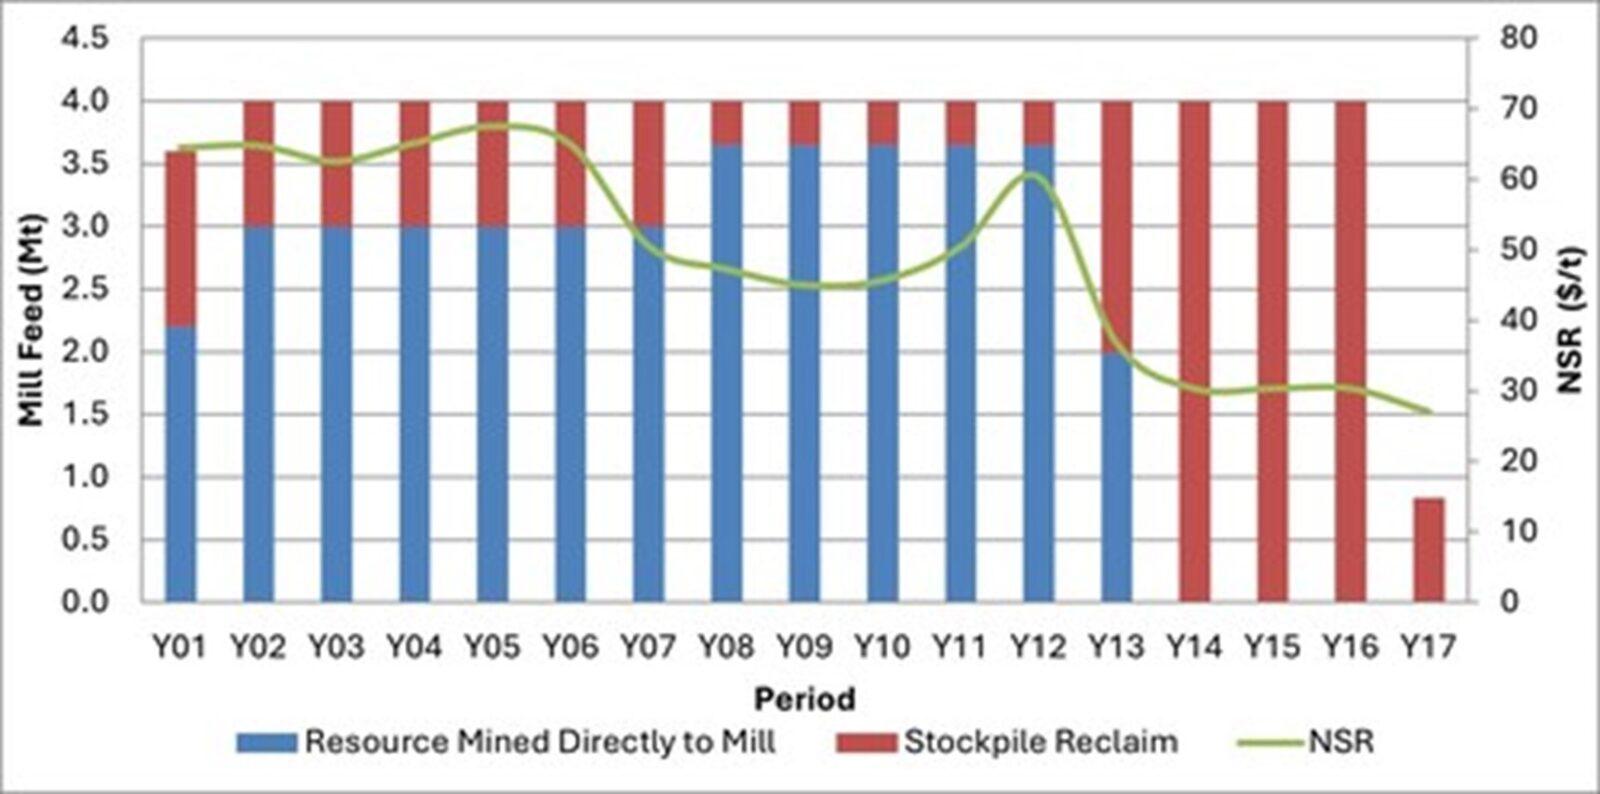
It is anticipated that open-pit mining will commence in the first year of construction. The mine plan anticipates that 19 Mt of waste and oxide material will be mined, with the oxides stockpiled, over a two-year pre-production period. Peak open-pit production is expected to be 15 Mt per year. The planned open pit contains a total of 176 Mt of material (mineralized material and waste) which is scheduled to be mined out by Year 13 of milling operations. 24 Mt of oxide and lower grade material is planned to be processed throughout the mine, with years 14-17 processing stockpiles exclusively.
|
Notes: Net Smelter Prices and metallurgical recoveries are used to define the NSR cutoff grade. NSPs include market price assumptions of $23.0/oz Ag, $0.95/lb Pb, $1.25/lb Zn. Various smelter and refining terms, offsite costs, and a 6% royalty derive NSPs of $20.5/oz Ag, $0.64/lb Pb, and $0.74/lb Zn. Metallurgical recoveries of 90% Ag, 83% Pb, and 58% Zn are applied. The metal prices, smelter terms, and recoveries for the economic analysis are slightly different from the values described here. Checks have been made by the qualified person to ensure that the PEA mine plan would not be materially altered by revising these inputs to the final PEA values. |
Mineral Processing
The Project is designed to process 4.0 Mt of mineralized material per year. The overall production schedule is illustrated in Figure 3. The processing facility will use conventional comminution circuits followed by selective sequential flotation to produce a lead/silver concentrate and a zinc/silver concentrate. This is planned to include primary crushing, followed by a SAG-Ball milling circuit and sequential sulfide flotation to separate silver/lead and zinc while rejecting pyrite and non-sulfidic gangue minerals. Tailings would then be thickened and pumped to a conventional storage facility.
Mineral Resource Estimate
The MRE, which used conceptual open pit mining constraints for reporting purposes, was previously reported by the Company in a news release dated September 5, 2023. The MRE, stated at a 40 g/t AgEq cut‐off, is shown in Table 6.
To minimize upfront capital while maximizing the Project’s return, the Company based the PEA on a 64 Mt subset of the near-surface, higher-grade material within the Upper Silver Zone of the MRE, as illustrated in Figure 1. This is anticipated to preserve the optionality to mine and process the remainder of the MRE at a later date.
Table 6: Mineral Resource as of August 25, 2023
| Domain | Category | Tonnage | Ag | Au | Pb | Zn | AgEq | |||||
| Mt | g/t | Mozs | g/t | Kozs | % | Mlbs | % | Mlbs | g/t | Mozs | ||
| Upper Silver Zone | Indicated | 119.2 | 45 | 171.2 | 0.1 | 216.4 | 0.3 | 916.6 | 0.7 | 1,729.6 | 85 | 326.8 |
| Inferred | 31.3 | 43 | 43.3 | 0.1 | 104.6 | 0.3 | 202.4 | 0.5 | 350.0 | 80 | 80.8 | |
| Middle Zinc Zone | Indicated | 43.4 | 11 | 15.0 | 0.1 | 77.4 | 0.4 | 343.6 | 0.8 | 739.4 | 56 | 78.1 |
| Inferred | 9.3 | 9 | 2.6 | 0.1 | 15.6 | 0.4 | 74.1 | 0.8 | 162.3 | 54 | 16.2 | |
| Lower Gold Zone | Indicated | 52.3 | 11 | 19.1 | 0.8 | 1,294.4 | 0.2 | 184.7 | 0.2 | 184.7 | 92 | 154.9 |
| Inferred | 4.4 | 13 | 1.8 | 0.7 | 97.5 | 0.2 | 21.4 | 0.2 | 21.4 | 91 | 12.8 | |
| Source: compiled by RPMGlobal, 2023 | ||||||||||||
|
Notes: |
||||||||||||
| 1. | CIM Definition Standards (2014) were used for reporting the Mineral Resources. | |||||||||||
| 2. | The qualified person (as defined in NI 43-101) for the purposes of the MRE is Anderson Candido, FAusIMM, Principal Geologist with RPMGlobal. | |||||||||||
| 3. | Mineral Resources are constrained by an optimized pit shell at a metal price of US$23.00/oz Ag, US$1,900.00/oz Au, US$0.95/lb Pb, US$1.25/lb Zn, recovery of 90% Ag, 98% Au, 83% Pb, 58% Zn and Cut-off grade of 40 g/t AgEq. | |||||||||||
| 4. | Drilling results up to June 1, 2023. | |||||||||||
| 5. | The numbers may not compute exactly due to rounding. | |||||||||||
| 6. | Mineral Resources are reported on a dry in-situ basis. | |||||||||||
| 7. | Mineral resources are not Mineral Reserves and have not demonstrated economic viability. | |||||||||||
Next Steps
With the completion of the PEA, New Pacific intends to continue its efforts to secure the necessary permits for the Project. The Company will only proceed with a feasibility study, expected to take 12-18 months, once it has confidence in a favorable and timely permitting outcome. This is anticipated to include securing a comprehensive mine development agreement with the local community, converting the Company’s exploration license into a mining license, substantially progressing an Environmental Impact Assessment Study (“EIA”) and obtaining legal certainty for the Project’s location within 50 kilometers of the Bolivian border with Chile. The Company anticipates being in such a position no earlier than the second half of 2025.
Significant progress has been made towards these milestones over the past year. For the EIA, the Company has completed baseline environmental data collection for both the dry and wet seasons and has recently secured community consent to begin the primary socioeconomic baseline data collection, which is expected to take several months to complete. This baseline data will help refine the Project’s design, assess potential environmental and social impacts and will help inform agreements with the local community.
The Company is encouraged by the strong support from both the Oruro Department and the federal government in advancing the Project. Through its recently formed Oruro Mining Task Force, the Government of Bolivia has established a pathway for transitioning from an exploration license to a mining license, with Carangas set to become the first project to do so under Bolivia’s 2014 mining code. The Company believes that continued collaboration and support from governmental authorities are crucial for the Project’s success and its potential to become a key source of raw material for a zinc plant under construction by the Bolivian government in Oruro.
Qualified Persons
The qualified persons for the PEA are Mr. Marcelo del Giudice, FAusIMM, Principal Metallurgist with RPMGlobal, Mr. Pedro Repetto, SME, P.E., Principal Civil/Geotechnical Engineer with RPMGlobal, Mr. Gonzalo Rios, FAusIMM, Executive Consultant – ESG with RPMGlobal, Mr. Jinxing Ji, P.Eng., Metallurgist with JJ Metallurgical Services, and Mr. Marc Schulte, P.Eng., Mining Engineer with Moose Mountain Technical Services. The specific sections for which each qualified person is responsible will be outlined in the NI 43-101 PEA Technical Report. This is in addition to Mr. Anderson Candido, FAusIMM, Principal Geologist with RPMGlobal who estimated the Mineral Resource. All such qualified persons have reviewed the technical content relevant to the sections of the PEA for which they are responsible included in this news release for the deposit at the Project and have approved its dissemination.
Further details supporting the PEA will be available in an NI 43‐101 Technical Report which will be posted under the Company’s profile at sedarplus.com within 45 days of this news release.
This news release has been reviewed and approved by Alex Zhang, P.Geo., Vice President of Exploration of New Pacific Metals Corp. who is the designated qualified person for the Company.
About New Pacific Metals
New Pacific is a Canadian exploration and development company with three precious metal projects in Bolivia. The Company’s flagship Silver Sand project has the potential to be developed into one of the world’s largest silver mines. The Company is also advancing its robust, high-margin silver-lead-zinc Carangas project. Additionally a discovery drill program was completed at Silverstrike in 2022.

Figure 1: Pit Design, SW-NE Section View (CNW Group/New Pacific Metals Corp.)

Figure 2: Mine Production Schedule Summary (CNW Group/New Pacific Metals Corp.)

Figure 3: Annual Mill Feed Tonnes and Grade (CNW Group/New Pacific Metals Corp.)
MORE or "UNCATEGORIZED"
Delta Reports New Gold Intercept at Nova Target in Wedge Area, 4 Kilometres West of Eureka; Follow-Up Drill Program Underway
Delta Reports New Gold Intercept at Nova Target in Wedge Area, 4 ... READ MORE
Silver One Announces Closing Of Final Tranche Of $32 Million Financing
Silver One Resources Inc. (TSX-V: SVE) (OTCQX: SLVRF) (FSE: BRK1)... READ MORE
SAGA Metals Achieves 100% Drilling Success in 2025—Reports Final Assays from Trapper South at Radar Critical Minerals Project in Labrador
Exceptional grades of Titanium, Vanadium and Iron in all 15 drill... READ MORE
Near Surface Intersection Yields 6.58 g/t gold over 10.35 metres
Intersection is within 33 metres from surface and contained in a ... READ MORE
Alamos Gold Provides Three-Year Operating Guidance Outlining 46% Production Growth by 2028 at Significantly Lower Costs
Further production growth to one million ounces annually expected... READ MORE


