


It’s time to make a house call on Dr. Copper, conduct a physical examination, diagnose what is ailing, and prognosticate his short-term future.
I last posted on copper, the real electric metal, a couple of years ago when it was mired in a five-year bear market of falling prices (Mercenary Musing, April 11, 2016).
The 10-year LME spot price chart tells all: the metals market crash that occurred prior to the global economic meltdown in late 2008; the quick drop to bottom and relatively rapid recovery; the booming bull market that followed; the aforementioned bear market for hard commodities that bottomed in January 2016; and an incipient bull market that is now less than two years old:
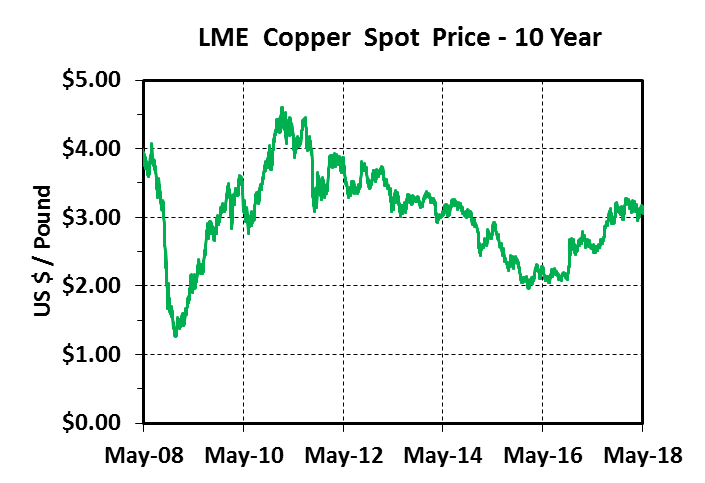
In retrospect, it has been a volatile and tumultuous decade for both the world economy and copper, the commodity generally accepted as the best indicator of near-term economic health and activity; ergo, “Dr. Copper”.
Let’s now turn our focus to the time after the red metal hit rock bottom at less than $2.00/lb in mid-January 2016. From its low of $1.96/lb and given Friday’s close at $3.12, it has risen 59%. That said, copper has underperformed zinc, which is up 71% since their respective January 2016 lows.
Consider that it traded above $4.00 from early December 2010 until mid-September of 2011 with an all-time high of $4.63/lb. So copper still has a long way to go before a full-fledged bull market call can be made.
After reaching its nadir in early 2016, it drifted sideways for nearly 10 months, mostly in the range of $2.05 to $2.25 a pound.
Then coincident with the election of Donald J. Trump as 45th President of the United States on November 8, 2016, copper immediately jumped about 30 cents and has since risen in a largely stepwise fashion:
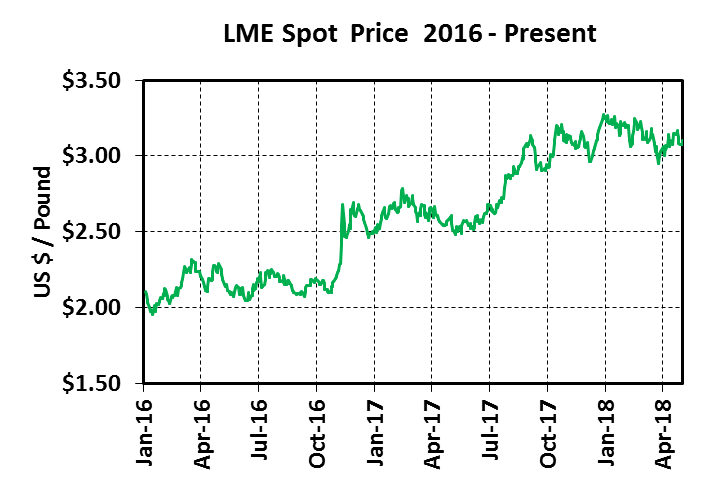
Note also that it has made higher highs and higher lows over the past year and a half and is up more than 35% since the election.
Copper reached a 3.8 year peak of $3.28 at the end of 2017 then stalled and is down 5% year-to-date. We are two-thirds thru Q2 and both precious and industrial metals have shown choppy patterns with no obviously discernible trends.
Over the past month, the red metal has been range-bound between $3.00 and $3.20 with the spot price moving up or down as much as seven cents in a day. The talk of trade tariffs (or wars) between the US and the rest of the world has been a major factor in its daily volatility. Other geopolitical events have also caused perturbations in the copper price recently including the United States exodus from the Iran nuclear deal and the spectacle of North Korean-American detente.
So far, 2018 has been an unusual year for copper.
Normal price seasonality is not evident. The 14-year composite LME record shows copper up an average of 10% from January to mid-April. Then it falls about 4% to mid-June before recovering over the summer months. Major consumers prepare for the North American construction season by stocking copper inventories in the late winter to early spring and use them up in the late spring to early summer. Prices generally rise then fall as this demand comes and goes.
Our 14-year composite chart is normalized on a yearly basis and illustrates copper’s usual price seasonality and 2018’s divergence from this pattern in green:

Seasonal inventory buildups of copper are the norm in January and February because of relatively low winter demand, port closures due to weather, and the Chinese New Year. This year is outside the norm as excess supplies continued to build into the early spring.
World warehouse inventories have vacillated since market bottom in January 2016. Our weekly tracking of warehouse stocks illustrates the volatility in the London Metal Exchange (LME) and Shanghai Financial Exchange (ShFE) tonnages. The spiky patterns indicate significant copper cathode moving in and out on a daily basis (cancelled warrants) and also at times, material being transferred from one set of warehouse exchanges to the other. Meanwhile, Comex stocks have steadily built from the beginning of 2017 to the present and now represent an anomalously high one-third of the copper in storage:

As mentioned above, there was an unusual increase in warehoused copper stocks from early January to early April.
On April 6, total stocks in official storage facilities including LME, Comex, and ShFE comprised 911,000 tonnes of grade A copper cathode, equal to more than 14 days of world demand.
It was the most copper in storage since April-July of 2013 and before that, all of 2003. Such large stocks would logically seem to be a bearish indicator for near-term prices. Despite those very high inventories, the price of copper was down but 9% in 2013 and actually jumped 46% in 2003.
On Friday May 18, official copper stocks held by the world’s three major warehousing entities totaled 820,000 tonnes or about 13 days of world use. That number does not account for material stashed in unofficial facilities or the role that scrap copper played in obscuring a normally transparent market in 2017.
I will have more on the scrap factor below.
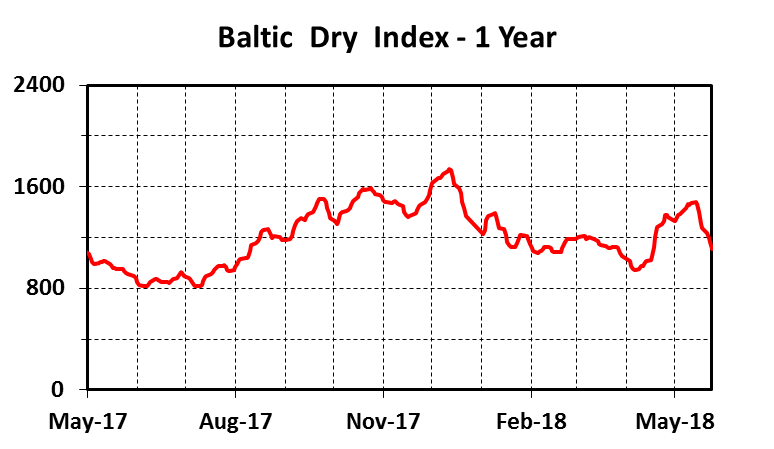
One of the world’s leading economic indicators is the Baltic Dry Index (Mercenary Musing, December 19, 2016), which measures the cost of shipping bulk dry cargoes worldwide. Although BDI is dominated by very large transports carrying iron ore and coking coal around the southern capes, copper is a significant component of the smaller ships that traverse major canals. BDI is notoriously volatile and recently surged to a five-month high before backing off over the past two weeks:
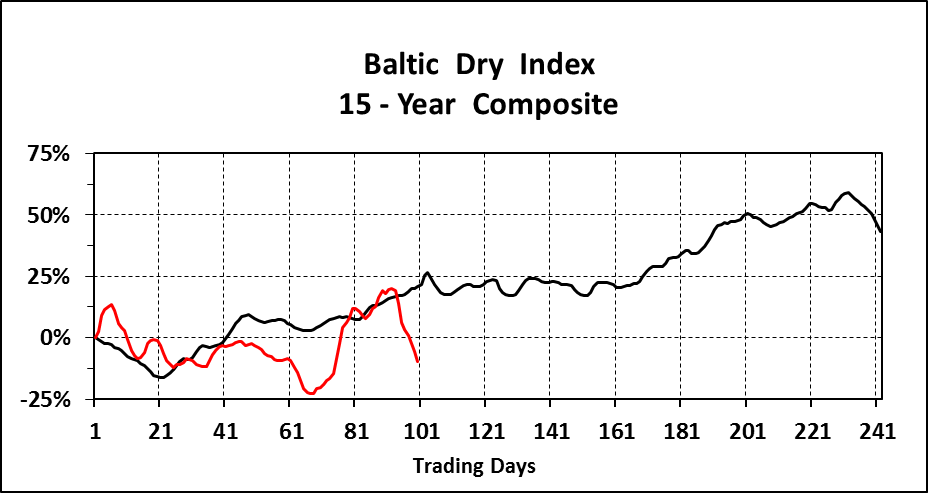
The 2018 BDI record is also at odds with its 15 year-seasonality:
Other indicators of short-term copper market sentiment include futures and options contracts. The London Metals Exchange (LME) and Chicago Mercantile Exchange (CME) futures and options arenas are the world’s largest commodity derivative markets and are dominated by commercial traders and hedge fund speculators.
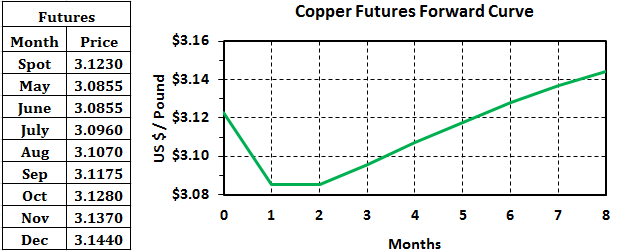
The red metal’s current near-term forward curve is in backwardation from the front month (May) to September and then in weak contango to year’s end:
Reuters’ Andy Home has reported that last August CME futures markets had a record 125,000 net-long contracts held by money managers and the copper price responded bullishly. Beginning in January, those positions were exited en masse by the hedge funds and by mid-April, contract positions were nearly neutral at 3800 net-longs.
Home noted a similar pattern played out in London over this period and commented that open interest in Shanghai surged in March. Prices slid 13% from late February to late March, and he opines it was due to a mass shorting by Chinese speculators.
In my opinion, these massive movements of hedge fund money largely explain copper’s tepid performance year-to-date. At this juncture, it appears neither hedge fund speculators nor commercial traders have big bets riding on copper’s direction either way for the remainder of the year.
At the beginning of every year, metals analysts who are mostly from the big banks, forecast a surplus or deficit and average price for copper. Their numbers generally assume a blanket 4% disruption in supplies for reasons that can include labor issues, accidents, weather, unplanned closures, and/or terrorism.
Two potential disruptions in 2018 are out of the ordinary. First is the likelihood of major strikes in Chile, which produced 27% of the world’s copper last year. 38 expiring contract are scheduled for re-negotiation this year. So far, major contracts have been settled without incident but many more remain to be resolved over the next seven months. The most important is undoubtedly Escondida, the world’s only million tonne per year copper mine, with union contracts expiring on July 31.
A wildcard was slipped into the supply-demand hand in late July of 2017 when China proposed a ban of scrap copper imports into the country and scheduled its implementation for late 2018.
This was another catalyst that sent the price of copper soaring from August to mid-October. Rising prices then led to a surge of scrap hoarded during the bear market years being sold into the market over the second half of the year.
In 2017, world copper demand grew 0.7% while refined production from concentrates dropped as did copper recovered directly from SX-EW operations. The resulting supply gap was filled by the large influx of scrap copper into the Chinese marketplace and that largely balanced the year’s copper supply-demand equation. According to the International Copper Study Group, there was a deficit of 135,000 tonnes over the year, or a little more than two days of world demand.
The new Chinese policy was partially implemented early this year with a ban on low-grade scrap and has resulted in a significant drop in their scrap imports. It has also caused some low-grade material (e.g., motor windings, insulated copper wire) to go into other Asian markets for upgrading before making its way into China.
The scrap market is quite opaque and is especially so for materials used in direct-melt manufacturing processes. In Q2 of 2018, scrap remains a disrupting market factor and will be until the final Chinese position is clear and the obscure supply plays out.
The copper market is largely in supply-demand balance, and this has been the normal paradigm since the world economic crisis of 2008 and 2009.
Because annual surpluses or deficits continue to be miniscule compared to overall demand, i.e., a few days of use on either side of the equation, the near-term price is largely dependent on the current mood of traders and speculators. Therefore, sustained price movements are increasingly due to hedge fund bets, and supply disruptions can quickly tip sentiment one way or the other.
Therefore, it should be of no surprise that big traders and speculators control the shorter term market and can manipulate it up or down.
Hoarding in times of low prices and dumping of stores into the market when prices rise is also a common strategy. The latest episode occurred with accumulated copper scrap that was held during the bear years and came flooding into the market when the price went above $2.75 in mid-Q3 of 2017. Scrap copper supplies and their movements continue to disrupt the marketplace.
Supply disruptions, Chinese import and export data, rises or falls in inventories, transfers of stocks from one set of global warehouses to another, and/or dumping of hoards into the market can wildly swing the spot price up or down and futures contracts into backwardation or robust contango from one day or one week to another.
In short (or long if you prefer), the near-term price of copper is not always dependent on actual supply-demand fundamentals and is often influenced by market manipulators. That is why futures and options markets are best left to the few players with the capital wherewithal and trading savvy to skew (or screw) the marketplace Over, Under, Sideways, Down (Yardbirds, 1966).
I have attempted to show that the near-term prognosis for the price of copper is neutral at best. At this juncture, there is lack of evidence for a strong directional move in 2018.
Copper’s daily, weekly, and monthly perturbations will continue to depend on a variety of factors including:
In this missive, I examined the near-term outlook for copper but did not address the mid- and long-term outlooks for the electric metal.
Please stay tuned for further assessments of Dr. Copper’s condition. Rest assured though, his long-term health outlook is indeed robust.
Ciao for now,
Mickey Fulp
Mercenary Geologist
The Mercenary Geologist Michael S. “Mickey” Fulp is a Certified Professional Geologist with a B.Sc. Earth Sciences with honor from the University of Tulsa, and M.Sc. Geology from the University of New Mexico. Mickey has 35 years experience as an exploration geologist and analyst searching for economic deposits of base and precious metals, industrial minerals, uranium, coal, oil and gas, and water in North and South America, Europe, and Asia.
Mickey worked for junior explorers, major mining companies, private companies, and investors as a consulting economic geologist for over 20 years, specializing in geological mapping, property evaluation, and business development. In addition to Mickey’s professional credentials and experience, he is high-altitude proficient, and is bilingual in English and Spanish. From 2003 to 2006, he made four outcrop ore discoveries in Peru, Nevada, Chile, and British Columbia.
Mickey is well-known and highly respected throughout the mining and exploration community due to his ongoing work as an analyst, writer, and speaker.
Contact: Contact@MercenaryGeologist.com
Disclaimer and Notice: I am not a certified financial analyst, broker, or professional qualified to offer investment advice. Nothing in any report, commentary, this website, interview, and other content constitutes or can be construed as investment advice or an offer or solicitation or advice to buy or sell stock or any asset or investment. All of my presentations should be considered an opinion and my opinions may be based upon information obtained from research of public documents and content available on the company’s website, regulatory filings, various stock exchange websites, and stock information services, through discussions with company representatives, agents, other professionals and investors, and field visits. My opinions are based upon information believed to be accurate and reliable, but my opinions are not guaranteed or implied to be so. The opinions presented may not be complete or correct; all information is provided without any legal responsibility or obligation to provide future updates. I accept no responsibility and no liability, whatsoever, for any direct, indirect, special, punitive, or consequential damages or loss arising from the use of my opinions or information. The information contained in a report, commentary, this website, interview, and other content is subject to change without notice, may become outdated, and may not be updated. A report, commentary, this website, interview, and other content reflect my personal opinions and views and nothing more. All content of this website is subject to international copyright protection and no part or portion of this website, report, commentary, interview, and other content may be altered, reproduced, copied, emailed, faxed, or distributed in any form without the express written consent of Michael S. (Mickey) Fulp, MercenaryGeologist.com LLC.
Copyright © 2018 Mercenary Geologist.com, LLC. All Rights Reserved.
Kootenay Silver Inc. (TSX-V: KTN) is pleased to announce that the... READ MORE
U.S. Gold Corp. (NASDAQ: USAU), is pleased to announce that it h... READ MORE
Getchell Gold Corp. (CSE: GTCH) (OTCQB: GGLDF) (FWB: GGA1) is ple... READ MORE
Imperial Metals Corporation (TSX:III) reports quarterly copper an... READ MORE
ALX Resources Corp. (TSX-V: AL) (FSE: 6LLN) (OTC: ALXEF) is pleas... READ MORE


