McEwen Mining: Grey Fox Exploration Update

| Accessible Mineralization and Good Exploration Potential |
| Assay Highlights:
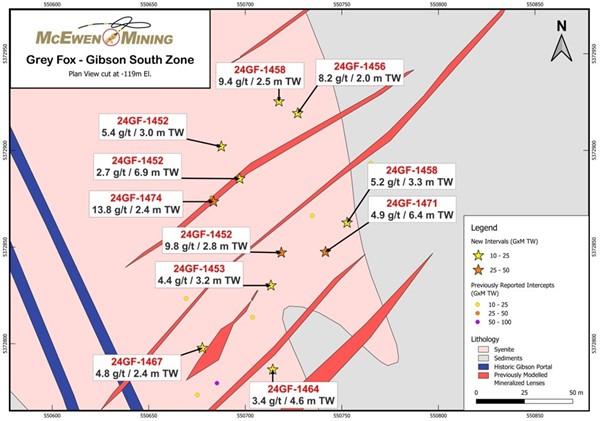
24GF-1471: 4.9 g/t Au over 6.4 m (0.16 oz/t Au over 23.0 ft) 24GF-1474: 13.8 g/t Au over 2.4 m (0.44 oz/t Au over 9.8 ft) 24GF-1452: 9.8 g/t Au over 2.8 m (0.31 oz/t Au over 11.2 ft) See Figure 5. All assay value intervals are true widths unless otherwise noted; TW=True Width, CW=Core Width
McEwen Mining Inc. (NYSE: MUX) (TSX: MUX) is pleased to provide new assay results from its Grey Fox deposit, part of the Fox Complex located in the Timmins region of Ontario, Canada. These results (see Table 1) demonstrate that the Gibson area of Grey Fox has good grading mineralization over mineable widths in close proximity to existing underground infrastructure. Grey Fox is currently a +1 Million ounce gold deposit and is the next project in our growth pipeline after the current development of our Stock Project (see June 20th/2024 Press Release).
Table 1 – Highlights of Recent Drill Intercepts from the Grey Fox Exploration Program*. *Au values capped to 30 g/t
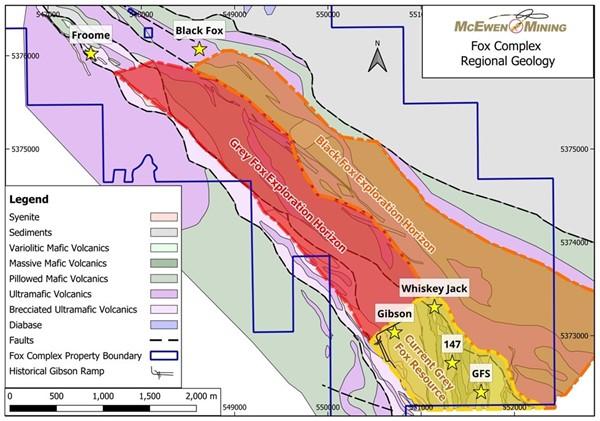
In addition, geological interpretations have created an exciting new exploration target shown in Figure 1 – one that suggests that high grade Black Fox horizon style mineralization (in orange-red) may exist below and adjacent to the Grey Fox deposit (see in red) and could extend 3 km along trend towards the Black Fox Mine. The current Grey Fox gold resource is estimated to contain more than 1.1 million ozs of indicated mineralization and greater than 0.2 million ozs of inferred mineralization (shown in yellow).
An earlier geophysical survey that previously identified multiple targets, including one that became the Froome mine, is the main focus for two key areas planned for drilling in 2025. The first area is the Grey Fox exploration horizon (shown in red) located to the North-West of the current Grey Fox resource (shown in yellow) which contains the Gibson, Whiskey Jack, 147 and the GFS (Grey Fox South) zones.
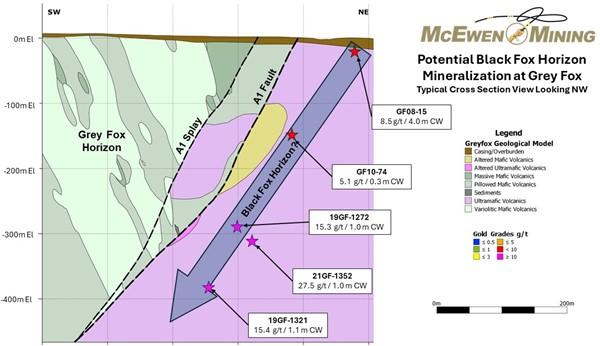
The second area is what our geologists believe could be the Black Fox horizon located stratigraphically below the Grey Fox horizon (which can also be seen in Figure 8).
Figure 1. Plan View Regional Geology Map of the Fox Complex. Location of Froome Mine, Black Fox Mine, Grey Fox zones of Gibson. Whiskey Jack, 147 and GFS (Grey Fox South) are also shown.
A follow-up geophysical survey will be conducted in Q4, with the goal of delineating additional anomalies between the Grey Fox resource and the Black Fox Mine.
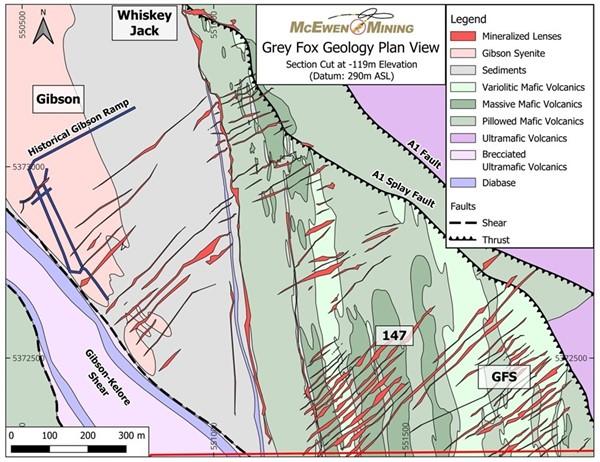
Figure 2 is a plan view geological map for Grey Fox showing some of the delineated lenses of mineralization (in red) and the location of the historical Gibson Ramp (in blue) at Grey Fox. Much of the 2024 drilling campaign at Grey Fox was concentrated on identifying mineralization in proximity to this ramp system. This ramp would offer early access to near-term production.
Figure 2. Plan View Geology Map of the Grey Fox Area.
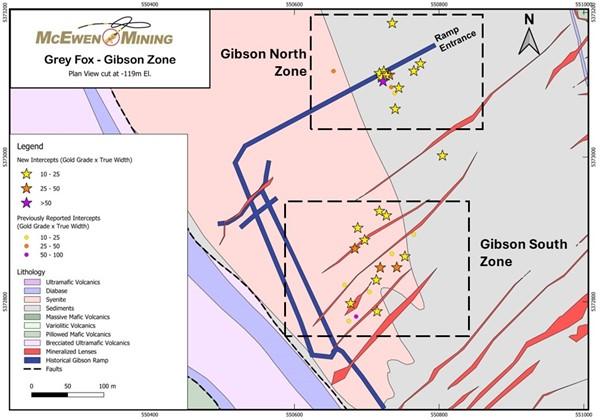
Figure 3 is a plan view for the Gibson area at Grey Fox. Most of the recent good drill results are within 50-100 m of the Gibson Ramp. Much of the 2024 drilling was designed to increase the indicated and inferred mineralization in proximity to this ramp. However, some holes were drilled to deeper levels to test for continuity of the gold mineralization and shown in Figure 6. Note that Figure 3 only shows results from surface down to a vertical depth of 300 m.
Figure 3. Plan View Geology map of the Gibson Area at Grey Fox with recent & previously released Assay Results.
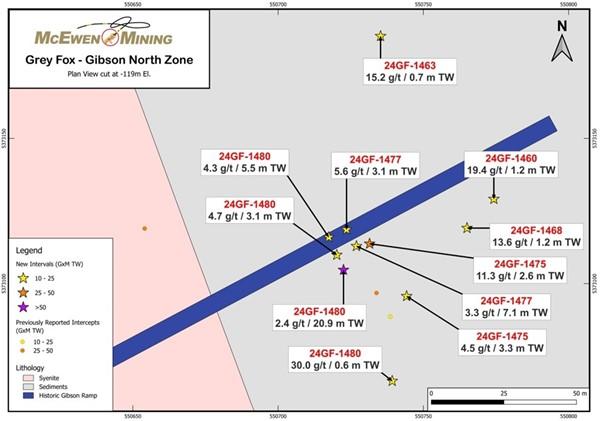
Figures 4 & 5 are enlarged plan view sections for the Northern and Southern portions of the Gibson ramp system, respectively. It is evident that there are abundant good grading drillholes with mineable widths within 100 m of existing ramp infrastructure. Again, these results are shallow, within 300 m below surface. In addition, many of the new results reported e.g., 24GF-1474 (13.8 g/t Au over 2.4 m) & 24GF-1452 (9.8 g/t Au over 2.8 m) are well above the current average indicated resource grade for Grey Fox of 4.8 g/t Au.
Figure 4. Enlarged Plan View of the Northern Section of the Gibson Ramp with recent and previously published Assay Results.
Figure 5. Enlarged Plan View of the Southern Section of the Gibson Ramp showing recent and previously published Assay Results.
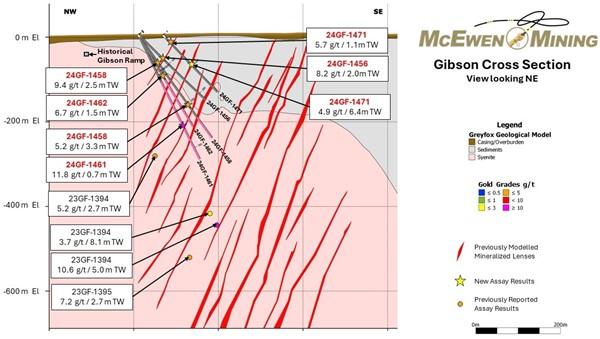
In Figure 6, gold mineralization at Gibson is characterized by multiple, stacked and sub-parallel vein sets that begin less than 10 m below surface and extend below 600 m. These vein sets are generally planar and have good strike and vertical depth components. Due to their strong continuity and good grades with mineable widths, these vein sets are attractive areas for either underground development or open pit mining methods.
Figure 6. Cross section (looking NE) for the Southern Portion of the Gibson Area
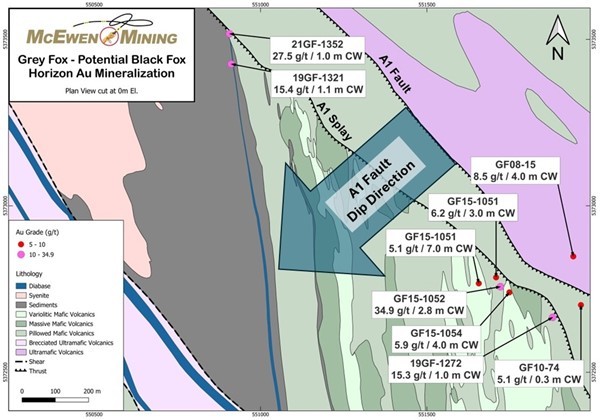
Figure 7 and Figure 8, show results from earlier drilling that encountered gold mineralization in the footwall i.e., below Grey Fox. High assay values seen in holes 21GF-1352 (27.5 g/t Au / 1.0 m CW) and GF08-15 (8.5 g/t Au / 4.0 m CW) identified gold mineralization in a similar geological setting to that seen at the Black Fox mine, located about 3 km to the North-West. These results are most encouraging as this area is relatively untested.
Figure 7. Plan view Southern portion of Grey Fox Highlighting Historical intercepts in the Footwall (i.e., Below) of the Grey Fox Deposit.
Figure 8. Cross Section View for the South-East Portion of Grey Fox Suggesting Mineralization in the Footwall i.e., Below Grey Fox.
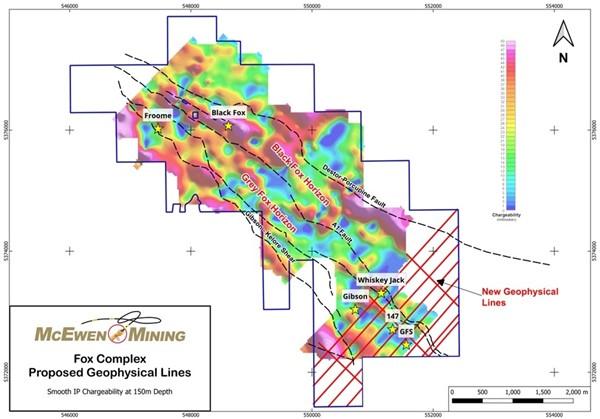
Figure 9: A previous geophysical survey completed in 2010 left some areas in the SE portion of the Fox Complex untested – an infill survey is expected to begin in Q4 (red lines at bottom left). The goal is to identify Black Fox style mineralization both adjacent to Grey Fox and back towards Black Fox Mine. The 2010 survey helped to discover what became the Froome Mine. Additional targets were tested over the following years but without the benefit of a full geological model and understanding to help augment the proposed drilling. We now have a much better understanding of both the regional and local Fox Complex geology and are now in a better position to continue to follow up on previously identified geophysical targets.
Figure 9. Plan View for a previously performed TITAN 24 Geophysical Survey of the Fox Complex.
For a list of drilling results at Grey Fox since May 27, 2024 including hole location and alignment, click here: https://www.mcewenmining.com/files/doc_news/archive/2024/20240911_fox_drill.xlsx
Technical Information
Technical information pertaining to the Fox Complex exploration contained in this news release has been prepared under the supervision of Sean Farrell, P.Geo., Chief Exploration Geologist, who is a Qualified Person as defined by Canadian Securities Administrators National Instrument 43-101 “Standards of Disclosure for Mineral Projects.”
The technical information related to resource and reserve estimates in this news release has been reviewed and approved by Luke Willis, P.Geo., McEwen Mining’s Director of Resource Modelling and is a Qualified Person as defined by SEC S-K 1300 and Canadian Securities Administrators National Instrument 43-101 “Standards of Disclosure for Mineral Projects.”
New analyses reported herein were submitted as ½ core samples and assayed by the photon assay method at the accredited laboratory MSA Labs (ISO 9001 & ISO 17025) in Timmins, Ontario, Canada. |
ABOUT MCEWEN MINING
McEwen Mining is a gold and silver producer with operations in Nevada, Canada, Mexico and Argentina. McEwen Mining also holds a 48.3% interest in McEwen Copper, which is developing the large, advanced-stage Los Azules copper project in Argentina. The Company’s goal is to improve the productivity and life of its assets with the objective of increasing the share price and providing a yield. Rob McEwen, Chairman and Chief Owner, has a personal investment in the Company of US$225 million.
MORE or "UNCATEGORIZED"
Delta Reports New Gold Intercept at Nova Target in Wedge Area, 4 Kilometres West of Eureka; Follow-Up Drill Program Underway
Delta Reports New Gold Intercept at Nova Target in Wedge Area, 4 ... READ MORE
Silver One Announces Closing Of Final Tranche Of $32 Million Financing
Silver One Resources Inc. (TSX-V: SVE) (OTCQX: SLVRF) (FSE: BRK1)... READ MORE
SAGA Metals Achieves 100% Drilling Success in 2025—Reports Final Assays from Trapper South at Radar Critical Minerals Project in Labrador
Exceptional grades of Titanium, Vanadium and Iron in all 15 drill... READ MORE
Near Surface Intersection Yields 6.58 g/t gold over 10.35 metres
Intersection is within 33 metres from surface and contained in a ... READ MORE
Alamos Gold Provides Three-Year Operating Guidance Outlining 46% Production Growth by 2028 at Significantly Lower Costs
Further production growth to one million ounces annually expected... READ MORE


