McEwen Copper: Los Azules – New Assay Results

Significant Infill Intercepts
0.50% Cu over 502 m, including 0.87% Cu over 172 m (AZ22181)
1.00% Cu over 282 m, including 1.40% Cu over 172 m (AZ22186)
0.66% Cu over 500 m, including 0.92% Cu over 276 m (AZ22184A)
McEwen Copper Inc., 52%-owned by McEwen Mining Inc. (NYSE: MUX) (TSX: MUX), is pleased to report the latest assay results from Los Azules, where an ongoing drilling program continues to deliver consistent infill results. Located in San Juan, Argentina, the Los Azules Project has many features comparable to world-class copper-gold deposits in South America, including a thick blanket of higher-grade Enriched (or Supergene) mineralization.
Highlights
- Hole AZ22183 returned an Enriched zone intercept of 0.87% Cu over 152 m (est. true thickness) which expands mineralization from adjacent high-grade results drilled in prior programs (Figure 1 and 2).
- In hole AZ22184A, an Enriched zone interval grading 0.92% Cu over 276 m (est. true thickness) occurs in a hydrothermal magmatic breccia within the core of the deposit (Figure 3). This breccia unit acts as a conduit for mineralizing fluids, sometimes forming higher grades within the broader porphyry mineralization at Los Azules.
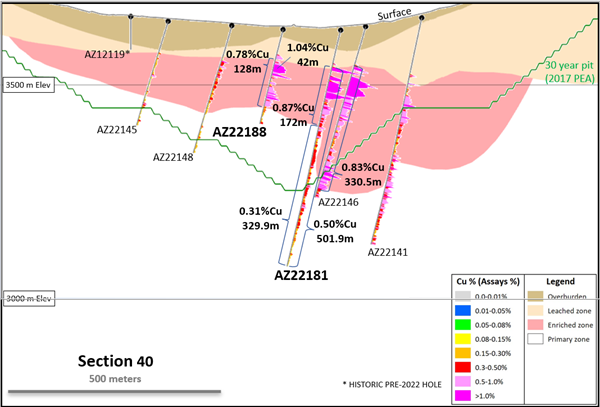
- Hole AZ22181 returned an Enriched zone intercept of 0.87% Cu over 172 m (est. true thickness) and fills a gap between high-grade holes drilled earlier in 2022 (Figure 4).
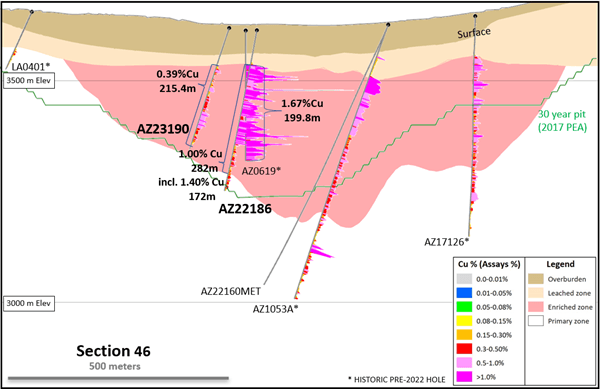
- Hole AZ22186 includes an interval grading 1.00% Cu over 282 m (true thickness of 247 m) in the Enriched zone nearby a historic high-grade- intercept (Figure 5).
“We have four different drilling contractors with 13 drills turning,” commented Michael Meding, Vice President and General Manager of McEwen Copper. “This initiative also involves training and optimizing the entire value chain, with the significant engagement of local suppliers and services.”
After resuming the exploration program in October 2022, drilling has now reached the 25,000 meters initially planned and will continue until the end of the field season. Key objectives of the program include:
- Increasing drilling density to upgrade the classification of shallower copper resources to measured and indicated categories.
- Providing metallurgical, hydrological and geotechnical data for the feasibility study mine design to be completed in late 2024.
- Testing for extensions of Los Azules mineralization to the north, south and at depth.
Table 1 presents the summary of copper (Cu), gold (Au) and silver (Ag) assay results from nineteen recently completed exploration or geotechnical holes totaling some 8,000 meters of core.
Table 1 – Los Azules drilling results, February – March 2023
| Hole-ID | Type | Predominant Mineral Zone | From (m) |
To (m) |
Length (m) |
Cu % |
Au (g/t) |
Ag (g/t) |
Comment |
| AZ22178 | Exploration | Total | 96.0 | 597.0 | 501.0 | 0.40 | 0.07 | 1.04 | |
| Enriched | 96.0 | 390.0 | 294.0 | 0.51 | 0.08 | 0.99 | |||
| Primary | 390.0 | 597.0 | 207.0 | 0.25 | 0.06 | 1.12 | |||
| AZ22179 | Exploration | Total | 106.0 | 749.0 | 643.0 | 0.54 | 0.08 | 1.34 | |
| Enriched | 106.0 | 548.0 | 442.0 | 0.63 | 0.09 | 1.55 | Incl. 96 m of 1.13% Cu | ||
| Primary | 548.0 | 749.0 | 201.0 | 0.34 | 0.06 | 0.90 | |||
| AZ22180 | Exploration | Total | 94.0 | 639.5 | 545.5 | 0.40 | 0.07 | 0.88 | |
| Enriched | 94.0 | 416.0 | 322.0 | 0.46 | 0.07 | 1.02 | |||
| Primary | 416.0 | 639.5 | 223.5 | 0.33 | 0.08 | 0.70 | Incl. 46 m of 0.51% Cu | ||
| AZ22181 | Exploration | Total | 72.0 | 573.9 | 501.9 | 0.50 | 0.09 | 1.29 | |
| Enriched | 72.0 | 244.0 | 172.0 | 0.87 | 0.13 | 0.80 | Incl. 52 m of 1.46% Cu | ||
| Primary | 244.0 | 573.9 | 329.9 | 0.31 | 0.07 | 1.55 | |||
| AZ22183 | Exploration | Total | 76.0 | 330.0 | 254.0 | 0.64 | 0.07 | 1.13 | |
| Enriched | 76.0 | 228.0 | 152.0 | 0.87 | 0.07 | 1.08 | Incl. 54 m of 1.18% Cu | ||
| Primary | 228.0 | 330.0 | 102.0 | 0.30 | 0.07 | 1.23 | |||
| AZ22184A | Exploration | Total | 114.0 | 614.0 | 500.0 | 0.66 | 0.10 | 1.18 | |
| Enriched | 114.0 | 390.0 | 276.0 | 0.92 | 0.13 | 1.48 | Incl. 76 m of 1.40% Cu | ||
| Primary | 390.0 | 614.0 | 224.0 | 0.34 | 0.08 | 0.84 | |||
| AZ22185 | Exploration | Total | 124.0 | 521.7 | 397.7 | 0.62 | 0.07 | 1.43 | |
| Enriched | 124.0 | 516.0 | 392.0 | 0.62 | 0.07 | 1.44 | Incl. 72 m of 1.32% Cu | ||
| Primary | 516.0 | 521.7 | 5.7 | 0.23 | 0.01 | 0.78 | |||
| AZ22186 | Exploration | Total | 74.0 | 371.2 | 297.2 | 0.96 | 0.06 | 1.18 | |
| Enriched | 74.0 | 356.0 | 282.0 | 1.00 | 0.06 | 1.23 | Incl. 172 m of 1.40% Cu | ||
| Primary | 356.0 | 371.2 | 15.2 | 0.26 | 0.02 | 0.35 | |||
| AZ22187A | Exploration | Total | 42.0 | 284.0 | 242.0 | 0.04 | 0.01 | 0.67 | |
| Enriched | 42.0 | 86.0 | 44.0 | 0.08 | 0.01 | 0.62 | |||
| Primary | 86.0 | 284.0 | 198.0 | 0.04 | 0.01 | 0.69 | |||
| AZ22188 | Exploration | Total | 60.0 | 229.5 | 169.5 | 0.64 | 0.06 | 0.95 | |
| Enriched | 60.0 | 188.0 | 128.0 | 0.78 | 0.07 | 1.13 | Incl. 42 m of 1.04% Cu | ||
| Primary | 188.0 | 229.5 | 41.5 | 0.23 | 0.02 | 0.42 | |||
| AZ23189 | Exploration | Total | 78.0 | 299.6 | 221.6 | 0.39 | 0.02 | 0.35 | |
| Enriched | 78.0 | 299.6 | 221.6 | 0.39 | 0.02 | 0.35 | Incl. 102 m of 0.50% Cu | ||
| AZ23190 | Exploration | Total | 90.0 | 305.4 | 215.4 | 0.39 | 0.02 | 0.47 | |
| Enriched | 90.0 | 305.4 | 215.4 | 0.39 | 0.02 | 0.47 | Incl. 30 m of 0.73% Cu | ||
| AZ23192 | Exploration | Total | 102.0 | 329.5 | 227.5 | 0.24 | 0.02 | 0.37 | |
| Enriched | 102.0 | 310.0 | 208.0 | 0.24 | 0.02 | 0.36 | |||
| Primary | 310.0 | 329.5 | 19.5 | 0.17 | 0.02 | 0.47 | |||
| AZ23193 | Exploration | Enriched | 108.0 | 448.7 | 340.7 | 0.34 | 0.03 | 1.39 | |
| AZ23194 | Exploration | Total | 96.0 | 307.0 | 211.0 | 0.45 | 0.03 | 0.84 | |
| Enriched | 96.0 | 300.0 | 204.0 | 0.46 | 0.03 | 0.82 | Incl. 20 m of 1.09% Cu | ||
| Primary | 300.0 | 307.0 | 7.0 | 0.24 | 0.07 | 1.64 | |||
| GTK2212 | Geotechnical | Total | 74.0 | 477.0 | 403.0 | 0.29 | 0.02 | 0.77 | |
| Enriched | 74.0 | 178.0 | 104.0 | 0.71 | 0.04 | 1.59 | |||
| Primary | 180.0 | 477.0 | 297.0 | 0.14 | 0.01 | 0.48 | |||
| GTK2313 | Geotechnical | Total | 69.0 | 439.0 | 370.0 | 0.30 | 0.01 | 0.34 | |
| Enriched | 69.0 | 434.0 | 365.0 | 0.30 | 0.01 | 0.34 | Incl. 40 m of 0.62% Cu | ||
| Primary | 434.0 | 439.0 | 5.0 | 0.08 | 0.00 | 0.25 | |||
| GTK2314A | Geotechnical | Enriched | 94.0 | 142.8 | 48.8 | 0.09 | 0.00 | 0.25 |
Results are summarized on four schematic cross-sections that include simplified interpretations of overburden thickness and the Leached, Enriched and Primary mineral zones. The Enriched (or Supergene) mineral zone refers to the enrichment of a copper deposit by precipitation-derived water circulation that carries copper minerals downward through the rocks to accumulate in a thick, often horizontal “blanket”. Immediately above the Enriched zone is the Leached zone, from which copper was removed and transported. Weathering and oxidation often aid in this process. Below the Enriched zone, the Primary (or Hypogene) zone is formed by ascending copper-rich thermal fluids having a much deeper magmatic origin.
The green line outlines the 30-year pit floor from the 2017 NI 43-101 Preliminary Economic Assessment (PEA) report. Figure 1 is a plan view showing the location of these cross sections.
The cross sections are located 50 m apart, with the lowest numbered section beginning at the south end of the deposit and increasing to the north.
Figure 1 – Plan View Location of Cross-sections and Drill Holes in the Deposit

Figure 2 – Section 38 – Drilling, mineral zones and 30-year PEA pit (looking north)

In Figure 2, Section 38 shows an intercept of 0.87% Cu over 152 m (AZ22183) in the Enriched zone. Immediately to the east of this hole, the Enriched zone is modelled with a true thickness exceeding 300 m based on historic drilling results including 0.72% Cu over 333.1 m (AZ1168) and 0.74% Cu over 313.1 m (AZ1063). In this interval, the dominant copper mineral is chalcocite, which is highly soluble and an attractive attribute from a metallurgical point of view is that it allows for simplified recovery of much of the copper.
Figure 3 – Section 39 – Drilling, mineral zones and 30-year PEA pit (looking north)

In Figure 3, Section 39 shows an intercept of 0.66% Cu over 500 m (AZ22184A), including 0.92% Cu over 276 m in the Enriched zone and 0.34% Cu over 224 m in the deeper Primary zone. It is notable that the Enriched zone includes a high-grade sub-interval of 1.40% Cu over 76 m, associated with hydrothermal magmatic breccia. The breccia unit is the highest-grade domain modelled at Los Azules. The true thickness of the Enriched zone exceeds 300 m in the center of the section due to the influence of structural controls, such as faults, which affect the core of the deposit.
Figure 4 – Section 40 – Drilling, mineral zones and 30-year PEA pit (looking north)

In Figure 4, Section 40, hole AZ22181 shows a grade of 0.50% Cu over 501.9 m, including 0.87% Cu over 172 m in the Enriched zone and 0.31% Cu over 329.9 m in the Primary zone. Further to the west, hole AZ22188 shows an Enriched zone intercept grading 0.78% Cu over 128 m and includes 1.04% Cu over 42 m. Grades are consistent with those reported in the previous campaign for hole AZ22146 (0.83% Cu over 330.5 m). The Enriched zone is estimated up to 300 m in vertical thickness immediately east of hole AZ22181.
In Figure 5 below, Section 46 shows hole AZ22186 with an Enriched zone interval grading 1.00% Cu over 282 m including 1.40% Cu over 172 m, where the hydrothermal magmatic breccia is well mineralized. The intercept compares well with nearby historic hole AZ0619 which graded 1.67% Cu over 199.8 m.
Figure 5 – Section 46 – Drilling, mineral zones and 30-year PEA pit (looking north)

Technical information
The technical content of this press release has been reviewed and approved by Stephen McGibbon, P. Geo., McEwen Mining’s Senior Consulting Geologist, and a qualified person as defined by NI 43-101.
All samples were collected in accordance with generally accepted industry standards. Drill core samples, usually taken at 2 m intervals, were split and submitted to the Alex Stewart International laboratory located in the Province of Mendoza, Argentina, for the following assays: gold determination using fire fusion assay and an atomic absorption spectroscopy finish (Au4-30); a 39 multi-element suite using ICP-OES analysis (ICP-AR 39); copper content determination using a sequential copper analysis (Cu-Sequential LM-140). An additional 19-element analysis (ICP-ORE) was performed for samples with high sulphide content.
The company conducts a Quality Assurance/Quality Control program in accordance with NI 43-101 and industry best practices using a combination of standards and blanks on approximately one out of every 25 samples. Results are monitored as final certificates are received, and any re-assay requests are sent back immediately. Pulp and preparation sample analyses are also performed as part of the QAQC process. Approximately 5% of the sample pulps are sent to a secondary laboratory for control purposes. In addition, the laboratory performs its own internal QAQC checks, with results made available on certificates for Company review.
Link to geochemical results, locations and lengths of drill-hole collars corresponding to October 2022 through January 2023 at Los Azules:
Table 2 – Hole Locations and Lengths for Released Drilling Results at Los Azules
| HOLE-ID | Azimuth | Dip | Length | Loc X | Loc Y | Loc Z | |
| AZ22178 | 250 | -75 | 597.0 | 2383521 | 6559032 | 3655 | |
| AZ22179 | 252 | -82 | 749.0 | 2383358 | 6559469 | 3640 | |
| AZ22180 | 70 | -79 | 639.5 | 2383341 | 6559233 | 3637 | |
| AZ22181 | 250 | -77 | 573.9 | 2383261 | 6559363 | 3628 | |
| AZ22183 | 250 | -72 | 330.0 | 2383304 | 6559266 | 3635 | |
| AZ22184A | 70 | -79 | 614.0 | 2383292 | 6559321 | 3633 | |
| AZ22185 | 250 | -85 | 521.7 | 2383258 | 6559468 | 3628 | |
| AZ22186 | 250 | -80 | 371.2 | 2382940 | 6559572 | 3615 | |
| AZ22187A | 250 | -83 | 284.0 | 2382123 | 6559695 | 3580 | |
| AZ22188 | 250 | -75 | 229.5 | 2383133 | 6559317 | 3630 | |
| AZ23189 | 250 | -75 | 299.6 | 2382934 | 6559457 | 3625 | |
| AZ23190 | 264 | -71 | 305.4 | 2382883 | 6559545 | 3619 | |
| AZ23192 | 250 | -83 | 329.5 | 2383255 | 6559042 | 3664 | |
| AZ23193 | 245 | -60 | 448.7 | 2382943 | 6559898 | 3604 | |
| AZ23194 | 250 | -78 | 307.0 | 2382953 | 6559517 | 3620 | |
| GTK2212 | 250 | -72 | 477.0 | 2383084 | 6559352 | 3630 | |
| GTK2313 | 250 | -72 | 439.0 | 2382652 | 6559674 | 3607 | |
| GTK2314A | 277 | -70 | 142.8 | 2382661 | 6559783 | 3600 | |
| Coordinates listed in Table 2 based on Gauss Kruger – POSGAR 94 Zone 2 | |||||||
ABOUT MCEWEN MINING
McEwen Mining is a gold and silver producer with operations in Nevada, Canada, Mexico and Argentina. In addition, it has large exposure to copper through its 52% ownership of McEwen Copper which owns the large, advanced stage Los Azules copper project in Argentina. The Company’s goal is to improve the productivity and extend the life of its mines with the objective of increasing its share value and price and providing a yield. Rob McEwen, Chairman and Chief Owner, has personal investment in the company of US$220 million. His annual salary is US$1.
MORE or "UNCATEGORIZED"
Delta Reports New Gold Intercept at Nova Target in Wedge Area, 4 Kilometres West of Eureka; Follow-Up Drill Program Underway
Delta Reports New Gold Intercept at Nova Target in Wedge Area, 4 ... READ MORE
Silver One Announces Closing Of Final Tranche Of $32 Million Financing
Silver One Resources Inc. (TSX-V: SVE) (OTCQX: SLVRF) (FSE: BRK1)... READ MORE
SAGA Metals Achieves 100% Drilling Success in 2025—Reports Final Assays from Trapper South at Radar Critical Minerals Project in Labrador
Exceptional grades of Titanium, Vanadium and Iron in all 15 drill... READ MORE
Near Surface Intersection Yields 6.58 g/t gold over 10.35 metres
Intersection is within 33 metres from surface and contained in a ... READ MORE
Alamos Gold Provides Three-Year Operating Guidance Outlining 46% Production Growth by 2028 at Significantly Lower Costs
Further production growth to one million ounces annually expected... READ MORE


