


Gold has enjoyed one heck of a run.
It has gained almost 60% since March 2024, when it broke out from its 13-year cup and handle pattern. It’s up 85% in the past 18 months.
This is a natural bull market, but bull markets correct and rest occasionally.
Let’s evaluate Gold at present as compared to history.
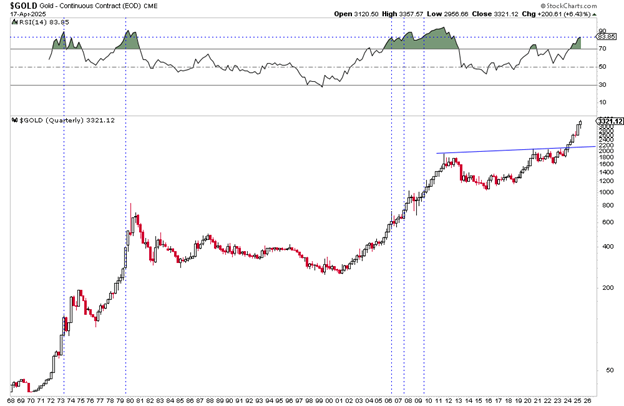
The quarterly RSI reading is one way to determine how overbought Gold is in the big picture. More so than weekly or monthly RSI, it best determines how overbought Gold has been throughout its history.
The quarter just started, but if Gold were to close at this level, it would compare to similar RSI readings at peaks in 1973, 1979, 2006, late 2007, and 2009.
The late 2007 and 2009 readings occurred amidst breakouts later in the secular bull market. Gold was already naturally overbought as its secular bull market was well established.
The best comparisons to today are 1973, a few years after an extremely significant breakout, and 2006, one year after a breakout from a multi-decade base, although below the all-time high.
Many analysts stop there.
They don’t consider intermarket analysis, which helps explain the state of capital flows and provides insight into Gold’s status and performance in real terms.
Many believe Gold is expensive or has been in the bull market for a while.
In real terms, the bull market is just getting started.
We plot Gold against the 60/40 Portfolio (60% Stocks, 40% Bonds) and Gold against the S&P 500.
The previous secular bull markets in Gold and precious metals were confirmed when Gold broke out against the 60/40 Portfolio. It broke out of a base and exploded above the 40-month moving average.
That transpired in 1930, 1972, and 2002. Major secular peaks were years away.
Gold against the 60/40 Portfolio broke out of a 10-year-long base last month. This was powered by Gold’s breakout against the S&P 500.
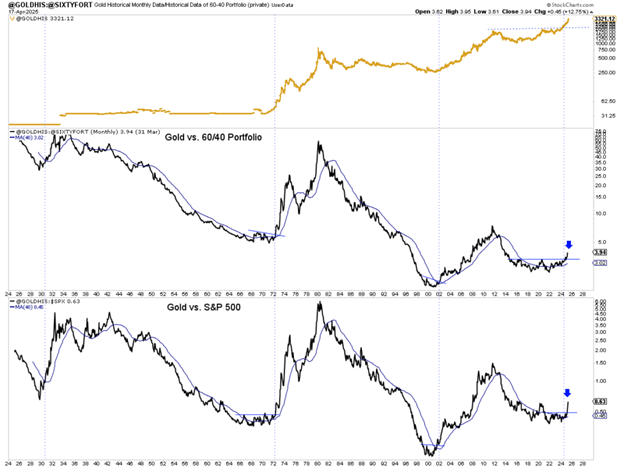
As reflected in the Gold to 60/40 Portfolio ratio, capital invested in traditional stocks and bonds has only begun to rotate into Gold and precious metals. It has a long way to go.
Topdown Charts provides strong evidence supporting that statement.
The charts below show the implied allocations (via ETFs) to Gold and Gold Miners. Allocations have only just begun to move off multi-decade lows.
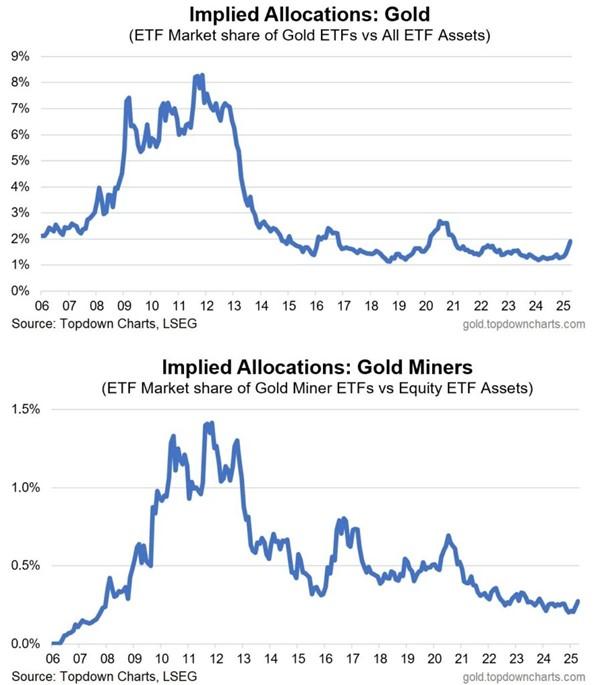
Gold’s breakout against the conventional portfolio, coupled with low investor allocation, signals that it’s too soon to anticipate a major correction.
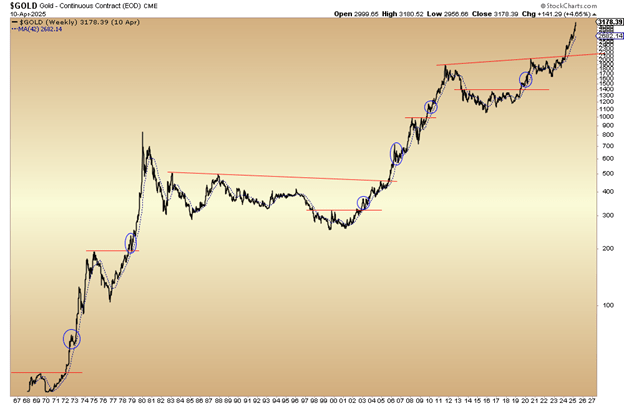
Gold does have a history of retesting its 200-day moving average after major breakouts.
The chart below highlights the six major breakouts in Gold and the weekly equivalent to the 200-day moving average, currently at $2700/oz.
It should reach $2900/oz in June and $3000/oz by the end of July.
These big-picture charts help us understand where the market is and where it’s not.
It’s certainly not at a 1979-like or 2008-like peak.
Gold just broke out of a 13-year cup and handle pattern only a year ago. Furthermore, it broke out against the 60/40 Portfolio only a month ago.
Gold is in the early innings of a long and huge move.
Of the potential similarities between 1973, 1979, 2006, late 2007, and 2009, the early 1970s are clearly the best fit.
As an aside, we did not mention the current secular bear market in Bonds, which is another similarity to the 1970s.
Furthermore, Silver began to outperform Gold after Gold corrected to its 200-day moving average after a breakout to a new all-time high.
The coming correction could be your last chance to buy high-quality junior gold and silver companies at a reasonable price.
Namibia Critical Metals Inc. (TSX-V: NMI) (OTCQB: NMREF) is pleased to announce that Japan Organizat... READ MORE
Eldorado Gold Corporation (TSX: ELD) (NYSE: EGO) today reports the Company’s financial and operati... READ MORE
DPM Metals Inc. (TSX: DPM) (ASX: DPM) announced its operating and financial results for the second q... READ MORE
IMC Rare Earths Ltd, a company focused on the mineral exploration and development of magnet rare ear... READ MORE
Fairchild Gold Corp. (TSX-V: FAIR), is pleased to announce the closing, on July 29, 2026, of its pre... READ MORE


