


Positive free cash flow generation from all operations for the first nine month
Hecla Mining Company (NYSE:HL) announced third quarter 2022 financial and operating results.
THIRD QUARTER HIGHLIGHTS
“Hecla reported another quarter of solid operational performance as Greens Creek achieved its best ever throughput and Lucky Friday’s production exceeded 1 million ounces for the second consecutive quarter,” said Phillips S. Baker Jr., President & CEO. “Free cash flow generation was lower for the quarter due to deferral of the sale of about a million ounces of silver and other metals, increased capital investment in our mines, and Alexco acquisition costs. All operations are free cash flow positive year to date and reflect the strong margins at our silver operations despite lower prices and an inflationary environment.”
Baker continued, “Hecla is the United States’ largest silver miner, producing about 40% of all the silver mined. With Keno Hill’s pre-production development on plan, we should become Canada’s largest silver miner in the next few years.”
FINANCIAL OVERVIEW
“Total cost of sales” as used in this release is comprised of cost of sales and other direct production costs and depreciation, depletion and amortization.
| In Thousands unless stated otherwise | Q3-2022 | Q2-2022 | Q1-2022 | Q4-2021 | Q3-2021 | YTD-2022 | YTD-2021 | |||||||||||||||||||||
| FINANCIAL AND OPERATIONAL HIGHLIGHTS | ||||||||||||||||||||||||||||
| Sales | $ | 146,339 | $ | 191,242 | $ | 186,499 | $ | 185,078 | $ | 193,560 | $ | 524,080 | $ | 622,395 | ||||||||||||||
| Total cost of sales | $ | 137,892 | $ | 153,979 | $ | 141,070 | $ | 131,837 | $ | 158,332 | $ | 432,941 | $ | 457,835 | ||||||||||||||
| Gross profit | $ | 8,447 | $ | 37,263 | $ | 45,429 | $ | 53,241 | $ | 35,228 | $ | 91,139 | $ | 164,560 | ||||||||||||||
| (Loss) income applicable to common stockholders | $ | (23,664 | ) | $ | (13,661 | ) | $ | 4,015 | $ | 11,737 | $ | (1,117 | ) | $ | (33,310 | ) | $ | 22,806 | ||||||||||
| Basic (loss) income per common share (in dollars) | $ | (0.04 | ) | $ | (0.03 | ) | $ | 0.01 | $ | 0.02 | $ | — | $ | (0.06 | ) | $ | 0.04 | |||||||||||
| Adjusted EBITDA 2 | $ | 26,554 | $ | 70,474 | $ | 58,202 | $ | 58,249 | $ | 49,414 | $ | 155,230 | $ | 220,531 | ||||||||||||||
| Net Debt to Adjusted EBITDA2,* | 1.9 | 1.1 | ||||||||||||||||||||||||||
| Cash (used in) provided by operating activities | $ | (24,322 | ) | $ | 40,183 | $ | 37,909 | $ | 53,355 | $ | 42,742 | $ | 53,770 | $ | 166,982 | |||||||||||||
| Capital Expenditures | $ | (37,430 | ) | $ | (34,329 | ) | $ | (21,478 | ) | $ | (28,838 | ) | $ | (26,899 | ) | $ | (93,237 | ) | $ | (80,210 | ) | |||||||
| Free Cash Flow 3 | $ | (61,752 | ) | $ | 5,854 | $ | 16,431 | $ | 24,517 | $ | 15,843 | $ | (39,467 | ) | $ | 86,772 | ||||||||||||
|
Production Highlights
|
||||||||||||||||||||||||||||
| Silver ounces produced | 3,549,392 | 3,645,454 | 3,324,708 | 3,226,927 | 2,676,084 | 10,525,917 | 9,660,313 | |||||||||||||||||||||
| Silver payable ounces sold | 2,479,724 | 3,387,909 | 2,687,261 | 2,606,622 | 2,581,690 | 8,554,894 | 9,027,180 | |||||||||||||||||||||
| Gold ounces produced | 44,747 | 45,719 | 41,707 | 47,977 | 42,207 | 132,173 | 153,350 | |||||||||||||||||||||
| Gold payable ounces sold | 40,443 | 44,225 | 41,053 | 44,156 | 53,000 | 125,721 | 157,454 | |||||||||||||||||||||
| Cash Costs and AISC, each after by-product credits4,5 | ||||||||||||||||||||||||||||
| Silver cash costs per ounce | $ | 3.43 | $ | (1.14 | ) | $ | 1.09 | $ | 1.69 | $ | 2.49 | $ | 1.11 | $ | 1.26 | |||||||||||||
| Silver AISC per ounce | $ | 14.20 | $ | 8.55 | $ | 7.64 | $ | 10.08 | $ | 12.82 | $ | 10.17 | $ | 8.88 | ||||||||||||||
| Gold cash costs per ounce | $ | 1,349 | $ | 1,371 | $ | 1,516 | $ | 1,143 | $ | 1,163 | $ | 1,409 | $ | 1,127 | ||||||||||||||
| Gold AISC per ounce | $ | 1,738 | $ | 1,641 | $ | 1,810 | $ | 1,494 | $ | 1,450 | $ | 1,729 | $ | 1,349 | ||||||||||||||
|
Realized Prices |
||||||||||||||||||||||||||||
| Silver, $/ounce | $ | 18.30 | $ | 20.68 | $ | 24.68 | $ | 23.49 | $ | 23.97 | $ | 21.25 | $ | 25.75 | ||||||||||||||
| Gold, $/ounce | $ | 1,713 | $ | 1,855 | $ | 1,880 | $ | 1,802 | $ | 1,792 | $ | 1,817 | $ | 1,794 | ||||||||||||||
| Lead, $/pound | $ | 0.95 | $ | 0.97 | $ | 1.08 | $ | 1.13 | $ | 1.02 | $ | 0.98 | $ | 1.00 | ||||||||||||||
| Zinc, $/pound | $ | 1.23 | $ | 1.44 | $ | 1.79 | $ | 1.74 | $ | 1.35 | $ | 1.47 | $ | 1.34 | ||||||||||||||
| *Reflects trailing twelve months ending September 30,2022. Reconciliations are available at the end of the release. | ||||||||||||||||||||||||||||
Sales in the third quarter declined by $44.9 million compared to the second quarter of 2022 primarily due to lower realized prices for all metals, and lower revenue from the deferral of silver concentrate shipments from Greens Creek and Lucky Friday to the fourth quarter. Compared to the prior quarter, realized silver prices have declined 12%, gold has declined 8%, lead and zinc prices are lower by 2% and 15% respectively. In comparison to the same quarter last year, gold prices are relatively unchanged, while silver prices have declined by 24% with lead and zinc lower by 7% and 9% respectively. The deferral of approximately 1 million ounces of silver, 1,800 ounces of gold, and 1,300 tons of lead in the silver concentrate shipments at Greens Creek was to ensure adequate volumes of concentrate for cost-effective shipping. At Lucky Friday the deferral was due to a planned multi week shutdown of the Trail smelter for maintenance. This concentrate is being shipped to a new customer and represents approximately 5% of Lucky Friday’s annual concentrate production.
Total cost of sales for silver were $76.7 million for the third quarter and were lower by $14.2 million over the prior quarter due to lower depreciation and higher product inventory. Cash costs and AISC (each after by-product credits) for silver were $3.43 and $14.20 per silver ounce respectively. Cash costs increased by $4.57 per ounce over the prior quarter primarily due to lower by-product credits attributable to lower lead and zinc production as well as lower prices. AISC increased by $5.65 per silver ounce over the prior quarter due to the factors affecting cash costs.4,5
Total cost of sales for gold were $59.5 million and declined marginally over the prior quarter. Gold cash cost per ounce, after by-product credits, declined by $22 attributable to higher production. AISC increased by $97 per ounce due to higher sustaining capital and exploration spend partially offset by higher production.4,5
Labor and the current inflationary environment are challenging at all operations. Labor availability remains constrained in the market with a shortage of skilled miners and maintenance workers. Inflationary pressures have led to a 10-15% increase in costs since the beginning of the year. Labor and input costs for steel, reagents, fuel, and other consumables continue to remain elevated impacting all the operations.
In the first half of the year, by-product credits helped offset the inflationary pressures for the silver segment due to strong by-product production as well as prices. However, lower base metal production and prices in the third quarter reduced the by-product credits. The inflationary environment is expected to remain challenging for the fourth quarter and into 2023.
Loss applicable to common stockholders for the third quarter was $(23.7) million, or $(0.04) per share, compared to a loss of $(13.7) million, or $(0.03) per share, in the second quarter of 2022, impacted by the following factors:
Partially offset by:
Cash used in operating activities was $24.3 million, compared to cash provided by operating activities of $40.2 million in the prior quarter. However, cash provided before working capital changes increased over the prior quarter. Working capital changes in the third quarter were negative $36.7 million compared to $32.6 million in the prior quarter, and are primarily related to an increase in ending inventory from the deferral of silver concentrate shipments at Greens Creek and Lucky Friday to the fourth quarter and semi-annual interest payment on the outstanding debt.
Capital expenditures totaled $37.4 million, an increase of $3.1 million over the prior quarter as planned. Expenditures were at Greens Creek of $7.0 million, Lucky Friday of $16.1 million, Casa Berardi of $10.8 million, and Keno Hill of $3.6 million. Free cash flow for the quarter was negative $61.8 million, a decline of $67.6 million over the prior quarter due to the increase in working capital changes and higher capital spend.3
Forward Sales Contracts for Base Metals and Foreign Currency
The Company uses financially settled forward sales contracts to manage exposures to changes in prices of zinc and lead. At September 30, 2022, the Company had contracts covering approximately 39% of the forecasted payable zinc production (through 2025) at an average price of $1.32 per pound, and 38% of the forecasted payable lead production (through 2024) at an average price of $1.00 per pound. The fair value of the net metal derivative contracts on our forecasted hedges was an asset of $27.4 million, an increase of $11.3 million over the prior quarter.
The Company also manages CAD exposure through forward contracts. At September 30, 2022, the Company had hedged approximately 52% of forecasted CAD direct production costs for Casa Berardi through 2026 at an average CAD/USD rate of 1.31. The Company has also hedged approximately 32% of capital costs for Casa Berardi for 2022 at 1.33. At the Keno Hill, 66% of planned spend for the fourth quarter is hedged at an average CAD/USD rate of 1.34. The fair value of the net currency derivatives contracts is a liability of $10.8 million, an increase of $12.7 million over the prior quarter.
|
OPERATIONS OVERVIEW |
||||||||||||||||||||||||||||
|
Greens Creek Mine – Alaska |
||||||||||||||||||||||||||||
| Dollars are in thousands except cost per ton | Q3-2022 | Q2-2022 | Q1-2022 | Q4-2021 | Q3-2021 | YTD-2022 | YTD-2021 | |||||||||||||||||||||
| GREENS CREEK | ||||||||||||||||||||||||||||
| Tons of ore processed | 229,975 | 209,558 | 211,687 | 221,814 | 211,142 | 651,220 | 620,153 | |||||||||||||||||||||
| Total production cost per ton | $ | 185.34 | $ | 197.84 | $ | 192.16 | $ | 174.55 | $ | 181.60 | $ | 191.58 | $ | 178.29 | ||||||||||||||
| Ore grade milled – Silver (oz./ton) | 13.6 | 14.0 | 13.8 | 12.6 | 11.1 | 13.8 | 13.8 | |||||||||||||||||||||
| Ore grade milled – Gold (oz./ton) | 0.07 | 0.08 | 0.07 | 0.07 | 0.07 | 0.07 | 0.08 | |||||||||||||||||||||
| Ore grade milled – Lead (%) | 2.4 | 3.0 | 2.8 | 2.6 | 2.7 | 2.7 | 3.0 | |||||||||||||||||||||
| Ore grade milled – Zinc (%) | 6.3 | 7.2 | 6.6 | 6.3 | 7.1 | 6.7 | 7.4 | |||||||||||||||||||||
| Silver produced (oz.) | 2,468,280 | 2,410,598 | 2,429,782 | 2,262,635 | 1,837,270 | 7,308,660 | 6,980,587 | |||||||||||||||||||||
| Gold produced (oz.) | 11,412 | 12,413 | 11,402 | 10,229 | 9,734 | 35,227 | 35,859 | |||||||||||||||||||||
| Lead produced (tons) | 4,428 | 5,184 | 4,883 | 4,731 | 4,591 | 14,495 | 15,142 | |||||||||||||||||||||
| Zinc produced (tons) | 12,580 | 13,396 | 12,494 | 12,457 | 13,227 | 38,470 | 41,191 | |||||||||||||||||||||
| Sales | $ | 60,875 | $ | 92,723 | $ | 86,090 | $ | 87,865 | $ | 84,806 | $ | 239,688 | $ | 296,978 | ||||||||||||||
| Total cost of sales | $ | (52,502 | ) | $ | (60,506 | ) | $ | (49,636 | ) | $ | (49,251 | ) | $ | (55,193 | ) | $ | (162,644 | ) | $ | (163,861 | ) | |||||||
| Gross profit | $ | 8,373 | $ | 32,217 | $ | 36,453 | $ | 38,614 | $ | 29,613 | $ | 77,044 | $ | 133,117 | ||||||||||||||
| Cash flow from operations | $ | 7,749 | $ | 41,808 | $ | 56,295 | $ | 50,632 | $ | 40,626 | $ | 105,852 | $ | 157,387 | ||||||||||||||
| Exploration | $ | 3,776 | $ | 929 | $ | 165 | $ | 696 | $ | 2,472 | $ | 4,870 | $ | 3,895 | ||||||||||||||
| Capital additions | $ | (6,988 | ) | $ | (14,668 | ) | $ | (3,092 | ) | $ | (9,544 | ) | $ | (6,228 | ) | $ | (24,748 | ) | $ | (14,339 | ) | |||||||
| Free cash flow 3 | $ | 4,537 | $ | 28,069 | $ | 53,368 | $ | 41,784 | $ | 36,870 | $ | 85,974 | $ | 146,943 | ||||||||||||||
| Cash cost per ounce, after by-product credits4 | $ | 2.65 | $ | (3.29 | ) | $ | (0.90 | ) | $ | 0.50 | $ | 0.74 | $ | (0.49 | ) | $ | (1.03 | ) | ||||||||||
| AISC per ounce, after by-product credits5 | $ | 8.61 | $ | 3.48 | $ | 1.90 | $ | 5.66 | $ | 5.94 | $ | 4.69 | $ | 2.40 | ||||||||||||||
Greens Creek produced 2.5 million ounces of silver and the mill achieved record mill throughput of 2,500 tons per day. Lead and zinc production for the quarter declined 15% and 6% respectively due to lower grades which led to the deferral of a silver concentrate shipment into the fourth quarter to ensure adequate volumes for cost effective shipping. Costs associated with the shipment were included in inventory in the third quarter, and the approximate revenue and cash flow impact of this deferral in the fourth quarter is expected to be $18 million.
Cash cost per silver ounce increased by $5.94 over the prior quarter primarily due to lower by-product credits. AISC per silver ounce increased by $5.13 compared to the prior quarter due to the reasons impacting cash costs, and increased exploration which was partially offset by lower capital spending.4,5
Cash flow from operations for the quarter was $7.7 million, a decline of $34.1 million over the prior quarter; free cash flow for the quarter was $4.5 million, a decline of $23.5 million. For the first nine months of the year, Greens Creek has generated $105.8 million in cash flow from operations and $86.0 million in free cash flow respectively and remains on track to achieve its production and cost guidance for the year.
| Lucky Friday Mine – Idaho | ||||||||||||||||||||||||||||
| Dollars are in thousands except cost per ton | Q3-2022 | Q2-2022 | Q1-2022 | Q4-2021 | Q3-2021 | YTD-2022 | YTD-2021 | |||||||||||||||||||||
| LUCKY FRIDAY | ||||||||||||||||||||||||||||
| Tons of ore processed | 90,749 | 97,497 | 77,725 | 80,097 | 78,227 | 265,971 | 241,740 | |||||||||||||||||||||
| Total production cost per ton | $ | 207.10 | $ | 211.45 | $ | 247.17 | $ | 198.83 | $ | 190.66 | $ | 220.41 | $ | 189.06 | ||||||||||||||
| Ore grade milled – Silver (oz./ton) | 12.5 | 13.2 | 12.0 | 12.5 | 11.2 | 12.7 | 11.3 | |||||||||||||||||||||
| Ore grade milled – Lead (%) | 8.5 | 8.8 | 8.2 | 8.1 | 7.2 | 8.5 | 7.4 | |||||||||||||||||||||
| Ore grade milled – Zinc (%) | 4.2 | 3.9 | 3.6 | 3.3 | 3.3 | 3.9 | 3.5 | |||||||||||||||||||||
| Silver produced (oz.) | 1,074,230 | 1,226,477 | 887,858 | 955,401 | 831,532 | 3,188,565 | 2,608,727 | |||||||||||||||||||||
| Lead produced (tons) | 7,172 | 8,147 | 5,980 | 6,131 | 5,313 | 21,299 | 17,006 | |||||||||||||||||||||
| Zinc produced (tons) | 3,279 | 3,370 | 2,452 | 2,296 | 2,319 | 9,101 | 7,673 | |||||||||||||||||||||
| Sales | $ | 28,460 | $ | 35,880 | $ | 38,040 | $ | 32,938 | $ | 29,783 | 102,380 | 98,550 | ||||||||||||||||
| Total cost of sales | $ | (24,166 | ) | $ | (30,348 | ) | $ | (29,265 | ) | $ | (23,252 | ) | $ | (23,591 | ) | (83,779 | ) | $ | (74,287 | ) | ||||||||
| Gross profit | $ | 4,294 | $ | 5,532 | $ | 8,775 | $ | 9,686 | $ | 6,192 | $ | 18,601 | $ | 24,263 | ||||||||||||||
| Cash flow from operations | $ | 11,624 | $ | 21,861 | $ | 11,765 | $ | 16,953 | $ | 15,017 | $ | 45,250 | $ | 45,641 | ||||||||||||||
| Capital additions | $ | (16,125 | ) | $ | (11,501 | ) | $ | (9,652 | ) | $ | (9,109 | ) | $ | (9,133 | ) | $ | (37,278 | ) | (20,776 | ) | ||||||||
| Free cash flow 3 | $ | (4,501 | ) | $ | 10,360 | $ | 2,113 | $ | 7,844 | $ | 5,884 | $ | 7,972 | $ | 24,865 | |||||||||||||
| Cash cost per silver ounce, after by-product credits4 | $ | 5.23 | $ | 3.07 | $ | 6.57 | $ | 4.50 | $ | 6.35 | $ | 4.77 | $ | 7.37 | ||||||||||||||
| AISC per silver ounce, after by-product credits5 | $ | 15.98 | $ | 9.91 | $ | 13.15 | $ | 12.54 | $ | 16.79 | $ | 12.86 | $ | 15.00 | ||||||||||||||
Lucky Friday produced 1.1 million ounces of silver during the third quarter, a 12% decrease over the prior quarter due to lower mined tons and feed grades attributable to mine sequencing, commissioning of new equipment, and prioritization of projects for increasing future throughput and production. The third quarter also marked two consecutive quarters of throughput exceeding 90,000 tons and silver production exceeding 1 million ounces.
At the Lucky Friday, 2,000 dry metric tonnes of silver concentrate was inventoried to be shipped to a new customer in the fourth quarter. Costs associated with the deferral of this concentrate shipment were in inventory in the third quarter, and impact on revenues and cash flow for the fourth quarter is expected to be approximately $6.0 million. Total cost of sales was $24.2 million, a decrease of $6.2 million over the prior quarter due to lower depreciation expense, an increase in concentrate inventory, and lower ore volume mined and production. Cash cost and AISC per silver ounce (each after by-product credits) were $5.23 and $15.98, respectively, and higher compared to the prior quarter due to lower production, and lower by-product credits because of lower base metal production and prices.4,5
| Casa Berardi Mine – Quebec | ||||||||||||||||||||||||||||
| Dollars are in thousands except cost per ton | Q3-2022 | Q2-2022 | Q1-2022 | Q4-2021 | Q3-2021 | YTD-2022 | YTD-2021 | |||||||||||||||||||||
| CASA BERARDI | ||||||||||||||||||||||||||||
| Tons of ore processed – underground | 162,215 | 176,576 | 161,609 | 161,355 | 167,435 | 500,400 | 533,262 | |||||||||||||||||||||
| Tons of ore processed – surface pit | 227,726 | 225,042 | 224,541 | 225,662 | 230,708 | 677,309 | 607,967 | |||||||||||||||||||||
| Tons of ore processed – total | 389,941 | 401,618 | 386,150 | 387,017 | 398,143 | 1,177,709 | 1,141,229 | |||||||||||||||||||||
| Surface tons mined – ore and waste | 2,822,906 | 2,149,412 | 1,892,339 | 1,507,457 | 1,483,231 | 6,864,657 | 4,996,522 | |||||||||||||||||||||
| Total production cost per ton | $ | 114.52 | $ | 113.07 | $ | 117.96 | $ | 108.82 | $ | 86.95 | 115.15 | $ | 95.13 | |||||||||||||||
| Ore grade milled – Gold (oz./ton) – underground | 0.15 | 0.19 | 0.14 | 0.17 | 0.16 | 0.17 | 0.16 | |||||||||||||||||||||
| Ore grade milled – Gold (oz./ton) – surface pit | 0.06 | 0.05 | 0.05 | 0.07 | 0.04 | 0.06 | 0.06 | |||||||||||||||||||||
| Ore grade milled – Gold (oz./ton) – combined | 0.10 | 0.10 | 0.09 | 0.11 | 0.09 | 0.09 | 0.10 | |||||||||||||||||||||
| Gold produced (oz.) – underground | 22,181 | 22,866 | 19,374 | 22,910 | 24,170 | 64,421 | 75,180 | |||||||||||||||||||||
| Gold produced (oz.) – surface pit | 11,154 | 10,440 | 10,866 | 14,356 | 5,552 | 32,460 | 22,065 | |||||||||||||||||||||
| Gold produced (oz.) – total | 33,335 | 33,306 | 30,240 | 37,266 | 29,722 | 96,881 | 97,245 | |||||||||||||||||||||
| Silver produced (oz.) – total | 6,882 | 8,379 | 7,068 | 7,967 | 7,012 | 22,329 | 25,604 | |||||||||||||||||||||
| Sales | $ | 56,939 | $ | 62,639 | $ | 62,101 | $ | 60,054 | $ | 56,065 | $ | 181,679 | $ | 185,098 | ||||||||||||||
| Total cost of sales | $ | (59,532 | ) | $ | (61,870 | ) | $ | (62,168 | ) | $ | (57,069 | ) | $ | (58,164 | ) | $ | (183,570 | ) | $ | (172,760 | ) | |||||||
| Gross profit/(loss) | $ | (2,593 | ) | $ | 769 | $ | (67 | ) | $ | 2,985 | $ | (2,099 | ) | (1,891 | ) | $ | 12,338 | |||||||||||
| Cash flow from operations | $ | 8,721 | $ | 7,417 | $ | 8,089 | $ | 10,029 | $ | 17,058 | $ | 24,227 | $ | 71,164 | ||||||||||||||
| Exploration | $ | 2,624 | $ | 1,341 | $ | 2,635 | $ | 2,124 | $ | 4,382 | $ | 6,600 | $ | 3,551 | ||||||||||||||
| Capital additions | $ | (10,771 | ) | $ | (8,093 | ) | $ | (7,808 | ) | $ | (9,537 | ) | $ | (11,488 | ) | $ | (26,672 | ) | $ | (40,080 | ) | |||||||
| Free cash flow 3 | $ | 574 | $ | 665 | $ | 2,916 | $ | 2,616 | $ | 9,952 | $ | 4,155 | $ | 34,635 | ||||||||||||||
| Cash Cost per gold ounce, after by-product credits4 | $ | 1,349 | $ | 1,371 | $ | 1,516 | $ | 1,137 | $ | 1,175 | $ | 1,409 | $ | 1,127 | ||||||||||||||
| AISC per gold ounce, after by-product credits5 | $ | 1,738 | $ | 1,641 | $ | 1,810 | $ | 1,470 | $ | 1,476 | $ | 1,729 | $ | 1,387 | ||||||||||||||
Casa Berardi produced 33,335 ounces of gold compared to 33,306 ounces in the prior quarter. The mill continues to perform well and operated at an average quarterly throughput of 4,239 tons per day with a new record set in September as monthly production throughput reached 4,856 tpd, beating the last monthly record in May 2022 of 4,533 tpd.
Total cost of sales for the third quarter 2022 was $59.5 million, a reduction of $2.3 million from the $61.9 million in the prior quarter. Cash cost per gold ounce decreased by $22 over the prior quarter to $1,349 primarily due to higher production. AISC per gold ounce increased by $97 to $1,738 driven by higher exploration and capital spend partially offset by higher production.4,5
Keno Hill – Yukon Territory
At the Keno Hill mine, focus is on development and drilling of the Bermingham and Flame & Moth deposits to bring the mine into full and consistent production by the end of 2023. As of October 31, 2022, 30% of total planned pre-production development is complete, and we expect to complete approximately 50% of the development by the end of the fourth quarter.
Fourth quarter capital spending is forecast at $10-$12 million for development, infill drilling, and equipment purchases. Since the acquisition, Keno Hill is seeing its lowest turnover in the mine’s recent history and is expected to achieve the hiring rate for production. We are implementing Hecla’s Health and Safety Management System and Environmental Management System in the fourth quarter.
EXPLORATION AND PRE-DEVELOPMENT UPDATE
Exploration and pre-development expenditures were $15.1 million for the quarter with focus on exploration drilling at Keno Hill, exploration and definition drilling at Greens Creek, underground drilling at the West Mine in Casa Berardi, and exploration drilling at the large land packages at Aurora, Nevada and Republic, Washington.
Keno Hill, Yukon Territory
Exploration drilling on the underexplored Coral Wigwam target area has discovered high-grade silver mineralization. Assay results to date include 101.5 oz/ton silver over 7.3 feet estimated true width.
Greens Creek, Alaska
At Greens Creek, drilling has focused on resource expansion and conversion which have yielded positive results. Three underground core drills are focused on resource conversion in the 200 South and East ore zones and on exploration in the East, 5250, 200 South, and Gallagher Fault Block zones. Additionally, two helicopter supported core drills are focused on drilling extensions to the Upper Plate Zone near the mine and the Lil’Sore target area approximately 3 miles northwest of the mine. These positive results continue to confirm and expand mineral zones. Significant assay intercepts for different zones are:
Detailed complete drill assay highlights can be found in Table A at the end of the release.
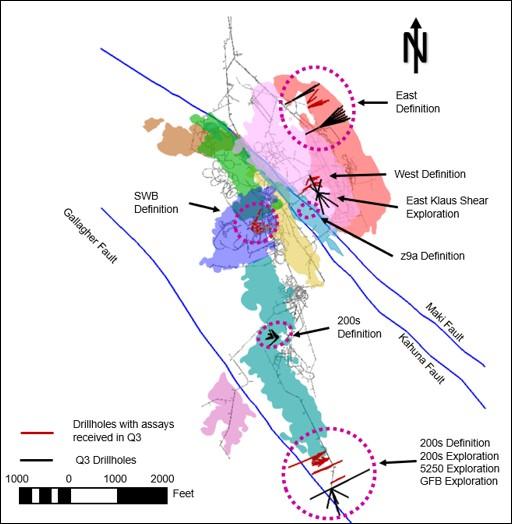
Figure 1: Plan view showing drilling locations and areas where assays have been received in relation to the multiple ore zones at Greens Creek
Casa Berardi, Quebec
At Casa Berardi, up to seven underground core drills and one surface core drill were focused on definition and exploration drilling in multiple zones and target areas and one surface core drill was focused on condemnation drilling.
Drilling targeted the 113, 118, 119 and Lower Inter zones. In the 113 Zone, two drill rigs are testing offsets and depth extensions of multiple 113 lenses. In the 118 Zone, drilling has been focused on defining continuity and expanding mineralization in the 118-14, and 118-15 lenses up and down plunge and to the east. Most of the 118 drilling has been showing good vertical continuity of mineralization. The drilling targeting the 119-02 lens show that the structure remains open at depth while closing to the east. Highlights include:
More complete drill assay highlights can be found in Table A at the end of the release.
Aurora, Nevada
Exploration drilling has confirmed wide and high-grade vein mineralization along the Martinez-Juniata-Chesco mineral trend. This mineralization continues to be open for expansion along strike and dip. Some significant intercepts are:
Republic, Washington
Exploration drilling identified high-grade vein mineralization at both the Lone Pine-Blacktail and Tom Thumb target areas. Wide zones of lower grade, potentially bulk mineable, material surround some of the high-grade vein intercepts at Lone Pine-Blacktail. Drilling also discovered an offset segment of the Tom Thumb Vein 850 feet across the Mud Lake Fault into the basin.
DIVIDENDS
Common Stock
The Board of Directors declared a quarterly cash dividend of $0.00375 per share of common stock for the minimum dividend component. The common stock dividend is payable on or about December 7, 2022, to stockholders of record on November 25, 2022. The realized silver price was $18.30 per ounce in the third quarter and did not satisfy the criterion for the silver-linked component under the Company’s common stock dividend policy.
Preferred Stock
The Board of Directors elected to declare a quarterly cash dividend of $0.875 per share of preferred stock, payable on or about January 3, 2023, to stockholders of record on December 15, 2022.
2022 GUIDANCE
The Company has reaffirmed its guidance for annual production, cost, and exploration and pre-development. The Company is maintaining its consolidated capital guidance with lower forecasted capital spend at the Lucky Friday and Casa Berardi due to timing of expenditures, offset by the inclusion of Keno Hill.
| (millions) | ||
| Previous | Current | |
| Capital expenditures | $150 – $160 | $150 – $160 |
| Greens Creek | $42 – $45 | $42 – $45 |
| Lucky Friday | $60 – $64 | $56 – $58 |
| Casa Berardi | $45 – $48 | $42 – $45 |
| Keno Hill | NA | $10 – $12 |
ABOUT HECLA
Founded in 1891, Hecla is the largest silver producer in the United States. In addition to operating mines in Alaska, Idaho, Quebec, Canada, the Company is developing a mine in the Yukon, Canada, and owns a number of exploration and pre-development projects in world-class silver and gold mining districts throughout North America.
Aura Minerals Inc. (NASDAQ: AUGO) (B3: AURA33) is pleased to anno... READ MORE
GR Silver Mining Ltd. (TSX-V: GRSL) (OTCQX: GRSLF) (FRANKF... READ MORE
Empress Royalty Corp. (TSX-V: EMPR | OTCQX: EMPYF) is pleased to ... READ MORE
JZR Gold Inc. (TSX-V: JZR) (OTCPK: JZRIF) is pleased to announce ... READ MORE
Colibri Resource Corporation (TSX-V: CBI) is pleased to announce ... READ MORE


