


G Mining Ventures Corp. (TSX: GMIN) (OTCQX: GMINF) is pleased to report its production and financial results1 for the quarter ended March 31, 2025. Unless otherwise stated, all dollar amounts in this news release are expressed in U.S. dollars.
“We are pleased to deliver a second consecutive quarter of free cash flow with perfect safety performance. While continuing to ramp up to nameplate capacity, we produced about 35,600 ounces at a leading all-in sustaining cost of $960 per ounce. With a further increase in production and decrease in costs expected in the second half of the year, we remain on track to achieve our full year production guidance.” said Louis-Pierre Gignac, President & Chief Executive Officer. “With $149 million in cash on hand, we are excited to advance early works at Oko West and proceed to a formal construction decision later this year. Our strategy remains focused on building long-term shareholder value through disciplined execution.”
First Quarter 2025 Operational and Financial Highlights
Year to Date Corporate Highlights
Operational Results1:
| Q1 2025 | Q4 2024 | ||
| In thousands of $, except as otherwise noted | |||
| Mining Activities | |||
| Ore Tonnes Mined | kt | 1,512 | 2,164 |
| Waste Tonnes Mined | kt | 2,195 | 2,105 |
| Total Tonnes Mined | kt | 3,707 | 4,269 |
| Strip Ratio | Waste/Ore | 1.45 | 0.97 |
| Processing Activities | |||
| Total Tonnes Processed | kt | 904 | 968 |
| Average Plant Throughput | tpd | 10,046 | 10,523 |
| Average Gold Recovery | % | 87.70 % | 89.2 % |
| Average Gold Processed | g/t Au | 1.40 | 1.45 |
| Gold Produced | oz | 35,578 | 40,147 |
| Gold Sold | oz | 35,435 | 39,938 |
| Per Ounce Metrics | |||
| Average Realized Gold Price2 | $/oz | 2,766 | 2,560 |
| Average Gold Price Received2 | $/oz | 2,555 | 2,380 |
| Total Cash Costs2 | $/oz | 689 | 577 |
| Site-Level AISC2 | $/oz | 834 | 765 |
| AISC2 | $/oz | 960 | 862 |
Financial Results1:
| Q1 2025 | Q4 2024 | ||
| In thousands of $, except as otherwise noted | |||
| Revenue | $ | 98,018 | 102,254 |
| Cost of Goods Sold | $ | (38,133) | (39,470) |
| Income from Mining Operations | $ | 59,885 | 62,784 |
| Net Income | $ | 24,429 | 15,238 |
| Per Share – Basic | $/share | 0.11 | 0.07 |
| Adjusted Net Income2 | $ | 35,392 | 36,926 |
| Per share – Basic | $/share | 0.16 | 0.17 |
| EBITDA2 | $ | 66,714 | 66,623 |
| Adjusted EBITDA2 | $ | 68,553 | 77,910 |
| Cash Flow from Operating Activities
before the Net Change in Working Capital Items |
$ | 39,435 | 73,181 |
| Cash Flow from Operating Activities | $ | 30,524 | 43,401 |
| Free Cash Flows2 | $ | 35,962 | 52,986 |
| Per share – Basic | $/share | 0.16 | 0.24 |
| Financial Position | Q1 2025 | Q4 2024 | |
| In thousands of $, except as otherwise noted | |||
| Cash and Cash Equivalents | $ | 148,970 | 141,215 |
First Quarter Highlights
After the first quarter of production, the Corporation remains on-track to deliver its 2025 production guidance of 175,000 to 200,000 ounces of gold at AISC2 of $1,025 to $1,125 per gold ounce sold.
Health and Safety
During the quarter, no Lost-Time or Recordable Incidents were reported over the 563,795 hours worked. Safety is fundamental to how we operate it reflects our deep commitment to protecting our people every step of the way.
Financial Highlights – Second Consecutive Quarter of Free Cash Flow
Gold sales totaled 35,435 ounces, generating $98 million in revenue at an average realized gold price2 of $2,766 per ounce. Despite higher gold prices, revenue decreased quarter-over-quarter due to lower sales volumes.
Cash costs2 were $689 per ounce, and AISC2 were $960 per ounce — below 2025 guidance, primarily due to deferred sustaining capital expenditures from Q1 to Q2.
Total operating costs2 were lower than expected, benefiting from lower general and administrative and processing expenses, though unit costs increased quarter-over-quarter due to reduced sales volume. Unit costs are expected to decline as production continues ramping up to nameplate capacity.
Cash flow from operations was $39 million before changes in net working capital, resulting in free cash flow2 of $36 million ($0.16 per share) and a cash balance of $149 million at quarter-end.
Adjusted EBITDA2 totaled $69 million, with adjusted net income2 of $35 million ($0.16 per share), reflecting strong operational performance during our second ramp-up quarter.
| Reconciliation of Cash Costs and AISC2 | Q1 2025 | Q4 2024 | |
| In thousands of $, except as otherwise noted | |||
| Operating Expenses | $ | 21,343 | 19,327 |
| Royalties | $ | 3,077 | 3,732 |
| Total Cash Costs | $ | 24,420 | 23,059 |
| Sustaining Capital and ARO* | $ | 5,159 | 7,517 |
| Site Level AISC2 | $ | 29,579 | 30,576 |
| General and Administrative Costs | $ | 4,454 | 3,865 |
| Total AISC2 | $ | 34,033 | 34,441 |
| Cash Costs2 | $/oz sold | 689 | 577 |
| Site Level AISC2 | $/oz sold | 834 | 765 |
| AISC2 | $/oz sold | 960 | 862 |
| *Comprised of Sustaining capital expenditures, capitalized stripping (sustaining) and accretion to rehabilitation provision (ARO). | |||
Tocantinzinho – Q1 2025 Operating Summary
TZ is a major employer of local workforce, with 83% of the ~1,150 employees and contractors coming from local communities (Pará State), and 99% Brazilians.
First-quarter gold production totaled 35,578 ounces, representing 19% of the midpoint of annual guidance, slightly below the planned 22%. Production in 2025 remains weighted to the second half of the year (56%), as higher-grade ore becomes accessible in deeper mine benches.
Mining volumes totaled 3.7 million tonnes, including 1.5 million tonnes of ore, resulting in a low strip ratio of 1.45x. Productivity was impacted by unusually heavy rainfall (1.3 meters—nearly double the historical average), reducing mined tonnage quarter-over-quarter. Ore stockpiles at quarter-end totaled 5.5 million tonnes at an average grade of 0.80 g/t Au.
Plant throughput averaged 10,046 tonnes per day, or 78% of nameplate capacity, primarily due to unscheduled downtime for SAG mill liner replacement. A new metallic liner system installed in April is expected to increase plant availability and throughput to nameplate levels with good performance demonstrated to date.
Gold recoveries remained strong at over 88%, in line with Feasibility Study expectations. Processed ore grade averaged 1.40 g/t Au during the quarter, with higher-grade ore (1.60 g/t Au) planned for processing in the second half of 2025.
Tocantinzinho – Q1 2025 Sustaining Capital Expenditure Update
Total 2025 sustaining capital expenditures2 at Tocantinzinho are forecasted at $60 to $70 million, including $23 million for capitalized waste stripping and $2 million for near-mine exploration.
Q1 sustaining capital expenditures totaled $5 million, including $2 million for capitalized waste stripping. Spending is expected to peak at approximately $40 million in Q2, reflecting the deferral of $25 million from Q1.
Key one-time investments in 2025 include $20 million for mining equipment, $10 million for major mobile fleet components, and $4.5 million for tailings facility upgrades.
Sustaining capital expenditures2 for the second half of 2025 are forecast to be up to $25 million, with approximately 70% allocated to capitalized waste stripping, supporting a reduced and normalized spending profile.
Oko West Development Update
In April 2025, GMIN published the results of a positive Feasibility Study for its Oko West Project in Guyana, confirming a long-life, low-cost, and high-margin gold operation. Average annual gold production is estimated at 350,000 ounces over a 12.3-year mine life, with an AISC of $1,123 per ounce. Initial capital is estimated at $972 million. The study outlines strong economics, including an after-tax NPV5% of $2.2 billion and IRR of 27% at a base case gold price of $2,500 per ounce. At a spot gold price of $3,200 per ounce, the after-tax NPV5% increases to $3.6 billion and the IRR to 38%.
Following receipt of the Interim Environmental Permit in January, early works construction began in March. GMIN has guided $200 to $240 million in 2025 development capital, with key infrastructure — including roads, airstrip, barge landing, and camp facilities — expected to be substantially completed by year-end.
In Q1, $17 million was directed toward early works construction activities and prepayments for equipment. Earthworks are advancing well, with concrete work set to begin shortly. To de-risk the schedule, GMIN has committed or negotiated approximately $150 million in long-lead items, including mobile and marine equipment, grinding mills, primary crusher, and the power plant. First deliveries of equipment are expected in Q2, allowing the Corporation to begin self-performing earthworks on site. Worker training programs began in January, and the headcount reached 200 by the end of March.
Final permitting remains on track for Q2. Public consultations concluded in February, and stakeholder feedback has been incorporated into the ESG programs. Final responses will be submitted to the EPA by mid-May, with final approval anticipated shortly thereafter.
Financing discussions are advancing in parallel, with a package expected this summer, ahead of a formal construction decision targeted for early in the second half of 2025.
Liquidity and Capital Resources
The Corporation ended Q1-25 with a cash and cash equivalents balance of $149 million.
The $8 million increase quarter over quarter is attributed to the following:
2025 Outlook
GMIN released 2025 guidance on January 21, 2025, including production, total cash costs, AISC, as well as sustaining and non-sustaining capital expenditures. The following table summarizes 2025 guidance:
| Operational & Cost Guidance | 2025 | |
| TZ Mine | ||
| Gold Production | k oz | 175 to 200 |
| Cash Costs | $/oz Au sold | $590 to $655 |
| AISC2 | $/oz Au sold | $995 to $1,125 |
| Sustaining Capital Expenditures | ||
| Sustaining | $M | $35 to $45 |
| Near-mine exploration | $M | $2 |
| Capitalized Waste Stripping | $M | $23 |
| Total Sustaining | $M | $60 to $70 |
| Non-Sustaining Capital Expenditures | ||
| TZ Regional Exploration | $M | $9 |
| Oko West Exploration | $M | $8 |
| Oko West Project | $M | $200 to $240 |
| Gurupi | $M | $2 to $4 |
| Total Non-Sustaining | $M | $219 to $261 |
Note: Guidance assumes a realized gold price of $2,350 and BRL/USD of 5.25.
2025 Catalysts
Over 2025, the Corporation will focus on the following activities:
Restatement and Disclosure
In accordance with IAS 8 – Accounting Policies, Changes in Accounting Estimates and Errors, and as announced in its press release dated May 12, 2025, GMIN has restated and filed its consolidated financial statements for the year ended December 31, 2024, along with a corresponding restated Management Discussion and Analysis, immediately prior to the filing of its First Quarter 2025 Results.
Qualified Person
Louis-Pierre Gignac, President & Chief Executive Officer of GMIN, a QP as defined in NI 43-101, has reviewed the press release on behalf of the Corporation and has approved the technical disclosure contained in this press release.
About G Mining Ventures Corp.
G Mining Ventures Corp. is a mining company engaged in the acquisition, exploration and development of precious metal projects to capitalize on the value uplift from successful mine development. GMIN is well-positioned to grow into the next mid-tier precious metals producer by leveraging strong access to capital and proven development expertise. GMIN is currently anchored by the Tocantinzinho Mine in Brazil, supported by the Gurupi Project in Brazil and the Oko West Project in Guyana — all with significant exploration upside and located in mining-friendly jurisdictions.
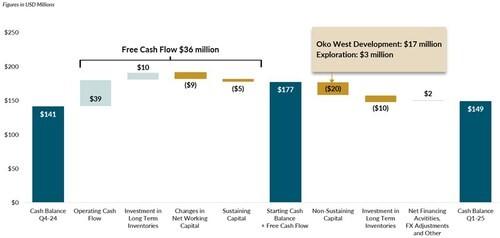
Figure 1: Cash Position Bridge for 3 months ended March 31, 2025 (CNW Group/G Mining Ventures Corp)
CPM Group’s 10-Year Copper Outlook are now available. ... READ MORE
Arizona Gold and Silver Inc. (TSX-V: AZS) (OTCQB: AZASF) is ple... READ MORE
Brixton Metals Corporation (TSX-V: BBB) (OTCQX: BBBXF) is pleased... READ MORE
Valkea Resources Corp. (TSX-V: OZ) is pleased to announce the clo... READ MORE
Tiger Gold Corp. (TSX-V: TIGR) (FSE: D150) (OTCQB: TGRGF) is plea... READ MORE


