


Frontier Lithium Inc. (TSX-V: FL) is pleased to release the strong results of a Pre-Feasibility Study for a proposed mine-to-lithium hydroxide chemical/hydromet plant facility in the Great Lakes Region of North America. The PFS assumes a hydromet plant that would convert spodumene concentrate feedstock sourced from a vertically integrated spodumene open-pit mining and milling facility at the Company’s PAK Lithium Project, located north of Red Lake, Ontario. The PFS demonstrates pre-tax NPV of US $2.59 billion discounted at 8%. The PFS confirms that the 100% owned Project could be the continent’s largest and lowest-cost producer of lithium hydroxide able to supply the rapidly growing electric vehicle industry in North America.
PFS Highlights:
“Surging global demand for unique premium low-iron spodumene concentrates and high-margin, low-cost lithium chemicals presents an opportunity for Frontier Lithium to establish itself as a leading producer. The outstanding PFS results further emphasize this, underscoring the project’s ability to meet the market’s needs. The project’s phased approach, highlighted in the study, ensures efficient resource utilization and minimizes upfront capital expenditure, positioning us for long-term success in the North American electric vehicle market.” comments Trevor Walker, President and CEO of Frontier Lithium. “Building upon the PFS results, we are committed to further optimizing the project through definitive feasibility level work. This crucial step allows us to unlock additional value and fine-tune our operational plan to maximize efficiency and profitability. We are confident that this milestone paves the way for strategic resource development and facilitates deeper discussions with potential offtake partners. We are dedicated to establishing mutually beneficial collaborations and supporting infrastructure upgrades in close cooperation with our First Nation community partners. This commitment to sustainable and inclusive development reflects our respect for the environment, local communities, and our shared goal of creating a prosperous future together.”
EXECUTIVE SUMMARY
Frontier’s Project is uniquely positioned to benefit from its highly favorable location in the Great Lakes Region of North America. Northern Ontario is endowed with exceptional infrastructure, a deep local talent pool, low-cost and low carbon energy, and proximity to an emerging local Electric Vehicle manufacturing market. The PFS reflects more conservative costing assumptions than prior studies, with recent inflationary pressures having a substantial impact on both capital expenditures and operating costs. These cost impacts are partially offset using lithium pricing assumptions based on the more positive outlook incorporated in the consensus estimates described herein. Summary results of the PFS are shown below.
The results of the PFS (see tables 1-5 below) include a pre-tax net present value at an 8 percent discount rate of US$2.59 billion with a pre-tax internal rate of return of 28.6 percent and a post-tax NPV at an 8 percent discount rate of $1.74 billion with a post-tax IRR of 24.1 percent.
The PFS is based on an updated mineral resource estimate completed by Todd McCracken, P.Geo, outlined in the National Instrument 43-101 technical report update as reported in Table 6.
Commodity Price Assumptions from the PFS are, base-case premium technical grade lithium concentrate of 7.2% Li2O (TG_SC7.2) price of US$3,000 per tonne, chemical grade lithium concentrate of 6.6% Li2O (CG_SC6.0) price of US$1,350 per tonne; lithium hydroxide price of US$22,000 per tonne; lithium carbonate US$20,500 per tonne and an exchange rate of $1.30 USD/CAD.
Table 1: Project Economics Summary
| ITEM | VALUE | UNITS |
| Physicals | ||
| Total Tonnes Mined | 103.4 | Mt |
| Total Mill Feed Processed | 22.1 | Mt |
| Average Mill Feed Grade | 1.55 | % Li2O |
| Technical Grade @ 7.2% Concentrate Tonnes | 765,000 | tonnes |
| BG Lithium Hydroxide Tonnes Produced | 313,000 | tonnes |
| BG Lithium Carbonate Tonnes Produced | 184,000 | tonnes |
| LCE | 459,000 | tonnes |
| Financial Analysis | ||
| Commodity Price Assumptions: | ||
| Technical Grade Concentrate (TG) 7.2% | 3,000 | US$/tonne |
| Chemical Grade Concentrate (CG) 6% | 1,350 | US$/tonne |
| Battery Grade Lithium Hydroxide | 22,000 | US$/tonne |
| Lithium Carbonate | 20,500 | US$/tonne |
| Exchange Rate | 1.3 | CAD$ : 1 US$ |
| Pre-Tax NPV 8% | 2,588 | US$M |
| Pre-Tax IRR | 28.6 % | % |
| Pre-Tax Payback, from start of mill production | 4.9 | years |
| Life of Mine | 24 | years |
| After-Tax NPV 8% | 1,739 | US$M |
| After-Tax IRR | 24.1 % | % |
| After-Tax Payback | 4.91 | years |
| Pre-Tax Unlevered Free Cash Flow | 8,078 | US$M |
| After-Tax Unlevered Free Cash Flow | 5,982 | US$M |
| LOM Direct Income and Mining Taxes | 2,560 | US$M |
| Capital Costs | ||
| Initial Capital, Direct Cost Estimate | 301 | US$M |
| Initial Capital Indirect Costs and Contingency | 167 | US$M |
| Total Initial Capital Costs | 468 | US$M |
| Expansion Capital, Direct Cost Estimate | 363 | US$M |
| Expansion Capital Indirect Costs and Contingency | 214 | US$M |
| Total Expansion Capital Costs | 576 | US$M |
| LOM Sustaining Capital | 73 | US$M |
| LOM Sustaining Capital, Indirect Costs and Contingency | 17 | US$M |
| Total LOM Sustaining Capital | 90 | US$M |
| Reclamation and Closure Costs (included Salvage Value) | 16 | US$M |
| LOM Total Capital | 1,151 | US$M |
| Operating Costs | ||
| LOM Operating Costs | 3,392 | US$M |
| Open Pit Mining | 5.60 | US$/t mined |
| Site Processing | 21.29 | US$/t milled |
| Site Support Costs | 20.17 | US$/t milled |
| Chemical Plant Processing | 85.99 | US$/t milled |
| Subtotal Operating Cost | 153.71 | US$/t milled |
| Concentrate Transport & Losses | 15.03 | US$/t milled |
| Total Operating Cost | 168.74 | US$/t milled |
PFS Overview
Table 2 – Economic Assumptions and Parameters
| Parameters | Unit | Value |
| Physicals | ||
| Convert to wet conc. | % | 1.09 |
| Li Hydroxide Conc. Yield from SC 6% | % | 60 % |
| Li Carbonate Conc. Yield from SC 6% | % | 40 % |
| Exchange Rate | ||
| Exchange | US$/CA$ | 0.77 |
| Exchange | CA$/ US$ | 1.30 |
| Discount Rate | ||
| Discount Rate | 8 % | |
| Commodity Prices | ||
| Technical Grade (TG) 7.2% | US$/tonne | 3,000 |
| Chemical Grade (CG) 6% | US$/tonne | 1,350 |
| BG LiOH | US$/tonne | 22,000 |
| BG Li2CO3 | US$/tonne | 20,500 |
| Recovery | ||
| TG Plant recovery | % | 76 % |
| CG Plant recovery | % | 78 % |
| Factor for Chem Conc to Li Hydroxide | % | 16.86 % |
| Lithium Hydroxide Recovery | % | 88 % |
| Factor for Chem Conc to Li Carbonate | % | 14.84 % |
| Lithium Carbonate Recovery | % | 88 % |
| Operating Costs | ||
| TG Concentrate transport | US$/t conc | 69 |
| CG Concentrate transport | US$/t conc | 69 |
| Chemical Plant Processing Costs | US$/t conc | 539 |
Table 3 – Project Economics
| Pre-Tax NPV | ||
| Discount Rate | CA$M | US$M |
| 0 % | 10,501 | 8,078 |
| 5 % | 5,057 | 3,890 |
| 8 % | 3,365 | 2,588 |
| 10 % | 2,582 | 1,986 |
| 15 % | 1,326 | 1,020 |
| PRE-TAX IRR | 28.6 % | |
| Payback Period (yrs.) | 4.9 | |
| Post-Tax NPV | ||
| Discount Rate | CA$M | US$M |
| 0 % | 7,776 | 5,982 |
| 5 % | 3,438 | 2,645 |
| 8 % | 2,261 | 1,739 |
| 10 % | 1,712 | 1,317 |
| 15 % | 821 | 632 |
| POST-TAX IRR | 24.1 % | |
| Payback Period (yrs.) | 4.9 |
Table 4 – Capital Requirement Summary
| Capital Costs | CA$M | US$M |
| Initial Capital, Direct Cost Estimate | 392 | 301 |
| Initial Capital Indirect Costs and Contingency | 217 | 167 |
| Total Initial Capital Costs | 608 | 468 |
| Expansion Capital, Direct Cost Estimate | 472 | 363 |
| Expansion Capital Indirect Costs and Contingency | 278 | 214 |
| Total Expansion Capital Costs | 749 | 576 |
| LOM Sustaining Capital | 95 | 73 |
| LOM Sustaining Capital, Indirect Costs and Contingency | 23 | 17 |
| Total LOM Sustaining Capital | 117 | 90 |
| Reclamation and Closure Costs | 21 | 16 |
| LOM Total Capital | 1,496 | 1,151 |
| Capital Requirements | Initial Capital (CA$M) |
Expansion Capital (CA$M) |
Initial Capital (US$M) |
Expansion Capital (US$M) |
| PAK – Infrastructure | 0.38 | – | 0.29 | – |
| PAK – Mobile Fleet | 18.58 | – | 14.29 | – |
| Spark – Infrastructure | – | 0.34 | – | 0.26 |
| SC 7.2 Concentrator | 157.92 | – | 121.48 | – |
| SC 6.0 Concentrator | – | 74.27 | – | 57.13 |
| Tailings Material Handling Pipeline | 1.20 | – | 0.92 | – |
| Tailings Management Facility | 21.97 | – | 16.90 | – |
| Site Preparation – Civil Work Mine & Mill | 34.90 | – | 26.85 | – |
| Site Roads and Permanent Access Road | 33.83 | – | 26.02 | – |
| Water Treatment Plant | 21.52 | – | 16.56 | – |
| Utilities | 22.47 | – | 17.29 | – |
| Electrical Power – Substation & Distribution | 22.22 | – | 17.09 | – |
| Building Facilities | 48.24 | 17.82 | 37.10 | 13.71 |
| Airstrip | 0.28 | – | 0.22 | – |
| Site – Mobile Fleet | 0.61 | – | 0.47 | – |
| Industrial Control Systems | 2.13 | – | 1.64 | – |
| Insurance | 5.45 | – | 4.19 | – |
| Chemical Plant/Erection/Commissioning | – | 379.23 | – | 291.72 |
| Mine and Site Indirect Costs | – | – | – | – |
| Owners Costs | 18.27 | – | 14.05 | – |
| EPCM | 27.40 | – | 21.08 | – |
| Other associated indirect costs | 17.22 | – | 13.24 | – |
| Mill Indirect Costs | – | – | ||
| SC 7.2 Concentrator | 53.17 | – | 40.90 | – |
| SC 6.0 Concentrator | – | 30.38 | – | 23.37 |
| Chemical Plant | – | 125.37 | – | 96.44 |
| SUB-TOTAL CAPITAL COSTS | 507.74 | 627.42 | 390.57 | 482.63 |
| Contingency | – | – | – | – |
| Mine and Site | 58.24 | – | 44.80 | – |
| SC 7.2 Concentrator | 42.22 | – | 32.48 | – |
| SC 6.0 Concentrator | – | 20.93 | – | 16.10 |
| Chemical Plant | – | 100.92 | – | 77.63 |
| TOTAL CAPITAL COSTS | 608.20 | 749.27 | 467.85 | 576.36 |
Table 5 –Operating Costs/Tonne LCE
| Operating Costs | CA$/LCE | US$/LCE |
| Total Chemical Operating Cost | 9,663 | 7,433 |
Table 6 – 2023 PAK Mineral Resource Statement (Open Pit)
| Cut- off | Resource Category | Commodity | Geologic Zone | Tonnes (t) | Li2O (%) | Ta2O5 (ppm) | Cs2O (%) | Rb2O (%) |
| 0.6% Li2O | Measured | Lithium | Upper Intermediate Zone (UIZ) | 325,200 | 3.43 | 59 | 0.03 | 0.14 |
| Lithium | Lower Intermediate Zone (LIZ) | 1,019,400 | 1.73 | 105 | 0.04 | 0.29 | ||
| Lithium | Total Lithium Zone | 1,344,600 | 2.14 | 94 | 0.04 | 0.25 | ||
| Lithium / Tantalum / Rubidium | Bulk Pegmatite | 1,344,600 | 2.14 | 94 | 0.04 | 0.25 | ||
| 0.6% Li2O | Indicated | Lithium | Upper Intermediate Zone (UIZ) | 255,400 | 2.91 | 75 | 0.04 | 0.21 |
| Lithium | Lower Intermediate Zone (LIZ) | 3,819,900 | 1.88 | 99 | 0.04 | 0.30 | ||
| Lithium | Total Lithium Zone | 4,075,300 | 1.94 | 97 | 0.04 | 0.29 | ||
| Tantalum / Rubidium | Central Intermediate Zone (CIZ) | 544,100 | 1.11 | 113 | 0.08 | 0.63 | ||
| Lithium / Tantalum / Rubidium | Bulk Pegmatite | 4,619,400 | 1.72 | 99 | 0.04 | 0.33 | ||
| 0.6% Li2O | Measured + Indicated | Lithium | Upper Intermediate Zone (UIZ) | 580,600 | 3.20 | 65 | 0.03 | 0.17 |
| Lithium | Lower Intermediate Zone (LIZ) | 4,839,300 | 1.85 | 100 | 0.04 | 0.30 | ||
| Lithium | Total Lithium Zone | 5,419,900 | 1.99 | 96 | 0.04 | 0.29 | ||
| Tantalum / Rubidium | Central Intermediate Zone (CIZ) | 544,100 | 1.11 | 113 | 0.08 | 0.63 | ||
| Lithium / Tantalum / Rubidium | Bulk Pegmatite | 5,964,000 | 1.81 | 98 | 0.04 | 0.32 | ||
| 0.6% Li2O | Inferred | Lithium | Upper Intermediate Zone (UIZ) | 74,200 | 2.77 | 96 | 0.04 | 0.25 |
| Lithium | Lower Intermediate Zone (LIZ) | 528,900 | 1.86 | 79 | 0.02 | 0.23 | ||
| Lithium | Total Lithium Zone | 603,100 | 1.97 | 81 | 0.02 | 0.23 | ||
| Tantalum /Rubidium | Central Intermediate Zone (CIZ) | 77,400 | 1.21 | 153 | 0.08 | 0.51 | ||
| Lithium / Tantalum / Rubidium | Bulk Pegmatite | 680,500 | 1.75 | 89 | 0.03 | 0.26 |
Table 7 – 2023 Spark Mineral Resource Statement (Open Pit)
| Cut-Off | Resource | Tonnes (t) | Li2O (%) |
Ta2O5 (ppm) |
Cs2O (%) |
Rb2O (%) |
Nb2O5 (ppm) |
SnO2 (ppm) |
| Classification | ||||||||
| 0.65% Li2O |
Indicated | 18,828,000 | 1.52 | 112 | 0.02 | 0.26 | 84 | 61 |
| Inferred | 29,746,000 | 1.34 | 116 | 0.03 | 0.26 | 77 | 74 | |
| Mineral Resource Estimate Notes | ||||||||
| 1. | Mineral Resources were prepared in accordance with NI 43-101 and the CIM Definition Standards (2014). Mineral resources that are not mineral reserves do not have demonstrated economic viability. This estimate of mineral resources may be materially affected by environmental, permitting, legal, title, taxation, sociopolitical, marketing, or other relevant issues. | |||||||
| 2. | Mineral Resources are reported at various cut-off grades based on mining method and a 6.0% spodumene concentrate prices of US$1,350 /tonne and an exchange rate of 1.3. | |||||||
| 3. | Appropriate mining costs, processing costs, metal recoveries, and inter ramp pit slope angles were used by BBA to generate the pit shell. | |||||||
| 4. | Rounding may result in apparent summation differences between tonnes, grade, and contained metal content. | |||||||
| 5. | Tonnage and grade measurements are in metric units. | |||||||
| 6. | A bulk density factor of 2.74 was applied to the pegmatite and 2.70 was applied to the aplite. | |||||||
Table 8 – Mineral Reserve Summary
| Category | Area | Li2O Cut-off Grade % |
Diluted Tonnage (t) |
Diluted Li2O Grade % |
| Probable Mineral Reserve | PAK | 0.65 | 4,041,000 | 1.79 |
| Probable Mineral Reserve | Spark | 0.65 | 18,028,000 | 1.50 |
| Probable Mineral Reserve | Overall Total | 0.65 | 22,069,000 | 1.55 |
Conclusions and Next Steps
The PFS results demonstrate the potential for Frontier Lithium to become a major North American lithium chemicals producer on a fully integrated spodumene mine to lithium hydroxide and carbonate chemical plant basis. The Company will now concentrate on the following initiatives to drive the Project forward:
Due Diligence
All scientific and technical information in this release has been reviewed and approved by Todd McCracken , P.Geo., Director – Mining & Geology – Central Canada , BBA E&C Inc., the qualified person (QP) and Garth Drever , P.Geo., VP Exploration for Frontier Lithium Inc. the qualified person (QP) under the definitions established by National Instrument 43-101. Under Frontier’s QA/QC procedures, all drilling was completed by Chenier Drilling Ltd. of Val Caron, ON using thin-walled BTW drill rods (4.2 cm core diameter) and a Reflex ACT III oriented core system. Using the Reflex system, the drill core was oriented and marked as it was retrieved at the drill. The core was boxed and delivered to the Frontier core shack where it was examined, geologically logged and marked for sampling. The core was photographed prior to sampling. Using a rock saw, the marked sample intervals were halved with one halve bagged for analysis. Sample blanks along with lithium, rubidium and cesium certified reference material was routinely inserted into the sample stream in accordance with industry recommended practices. Field duplicate samples were also taken in accordance with industry recommended practices. The samples were placed in poly sample bags and transported to Red Lake by Frontier employees and then shipped to AGAT Laboratories Ltd. (AGAT) in Mississauga, ON for quantitative multi-element analysis. AGAT is an ISO accredited laboratory. The core is stored on site at the Pakeagama Lake exploration camp.
Qualified Persons and 43-101 Disclosure
The following Qualified Persons as defined by NI 43-101 have been involved in the preparation of the study and have approved this press release:
Garth Drever, Graeme Goodall for Frontier Lithium Inc.
Todd McCracken, P. Geo., Shane Ghouralal, P. Eng., Joanne Robinson, P. Eng., David Willock, P. Eng., and Bahareh Asi, P. Eng. for BBA E&C
Andy Holloway, P. Eng. for Halyard Engineering Inc.,
Ian Ward, P. Eng. for Ian Ward consulting Services Inc.,
Ron DeGagne, P. Geo. for Environmental Application Group.,
Darlene Nelson, P. Eng. for WSP Canada Inc.
About Frontier Lithium Inc.
Frontier Lithium is a preproduction business with an objective to become a strategic domestic supplier of spodumene concentrates for industrial users as well as battery-grade lithium hydroxide and other chemicals to the growing electric vehicle and energy storage markets in North America. The Company maintains the largest land position and resource in a premium lithium mineral district located in Ontario’s Great Lakes region.
About PAK Lithium Project
The PAK lithium project contains North America’s highest-grade lithium resource and is the second largest in North America by size. The project encompasses close to 27,000 hectares and remains largely unexplored; however, since 2013, the company has delineated two premium spodumene-bearing lithium deposits (PAK and Spark), located 2.3 kilometres apart. Exploration is continuing on the project through two other spodumene- bearing discoveries: the Bolt pegmatite (located between the PAK and Spark deposits), as well as the Pennock pegmatite (25 kilometres northwest of PAK deposit within the project claims). A 2023 Mineral Resource Estimate titled “National Instrument 43-101 Technical Report for the PAK Lithium Project” by BBA E&C Inc., with an effective date of February 28, 2023, was filed on Sedar.com.
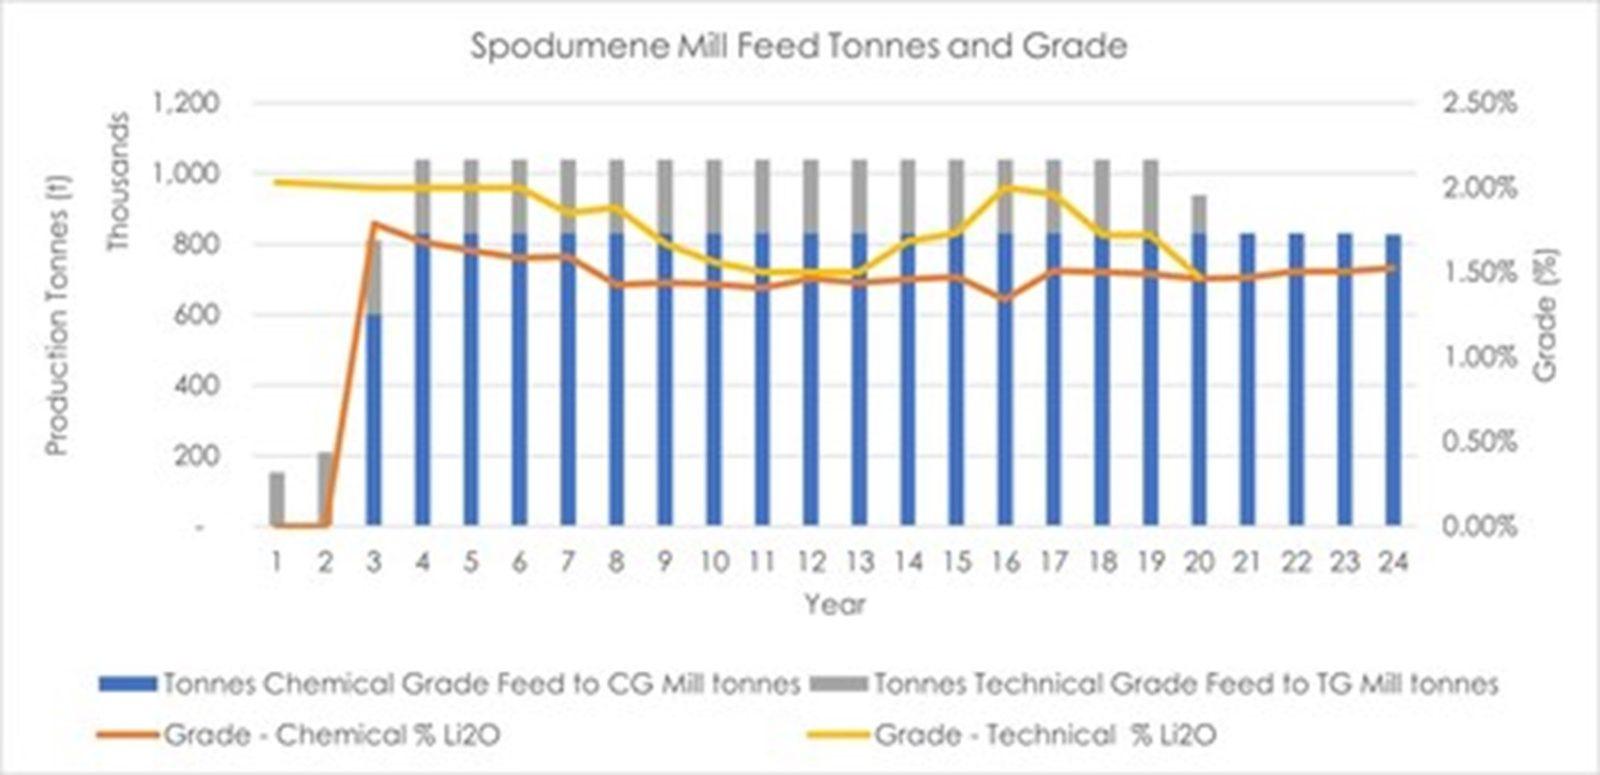
Figure 1 – Mill Feed and grade (CNW Group/Frontier Lithium Inc.)
F4 Uranium Crop. (TSX-V: FFU) is pleased to announce the closing ... READ MORE
Peruvian Metals Corp. (TSX-V: PER) (OTC Pink: DUVNF) is pleased t... READ MORE
Lion One Metals Limited (TSX-V: LIO) (OTCQX: LOMLF) is pleased to... READ MORE
GoGold Resources Inc. (TSX: GGD) (OTCQX: GLGDF) is pleased to rep... READ MORE
Emerita Resources Corp. (TSX-V: EMO) (OTCQB: EMOTF) (FSE: LLJA) r... READ MORE


