


Freeman Gold Corp. (TSX-V: FMAN) (OTCQB: FMANF) (FSE: 3WU) is pleased to announce the results of its updated price sensitivity analysis using current market prices completed by Ausenco Engineering Canada ULC and Moose Mountain Technical Services. Updating the pricing used in the October 16, 2023 initial Preliminary Economic Assessment at a base case of US$2,200/oz gold price, based on current long-term consensus forecasts, results in a post-tax Net Present Value5% of US$329 million, a post-tax internal rate of return of 28.2% and a payback of 2.9 years. This analysis quantifies the strong leverage to gold and is a marked improvement over the original base case of US$1,750/oz gold price resulting in a post-tax NPV5% of US$212 million, a post-tax IRR of 22.8% and a payback of 3.6 years. The updated price analysis demonstrates that the Lemhi Gold Project’s economics remain strong with significant leverage to the current spot price of US$2,900/oz which results in a post-tax NPV5% of US$648 million, post-tax IRR of 45.9% and a payback of 2.1 years. Figure 1 summarizes the various post-tax NPV5% for gold prices ranging from US$1,750/oz to US$3,400/oz.
“Significant changes in gold prices over the last 18 months motivated Freeman’s reassessment of its initial PEA model over a more fulsome range of scenarios. Using the current spot gold price, the Lemhi Gold Project will have an approximate US$1,871/oz cash margin using the updated all in sustaining cost of US$1,105/oz with significant additional upside at higher prices. The Lemhi Gold Project remains a low capital expenditure, low-cost project that is profitable across a range of prices and development options,” commented Bassam Moubarak, the Company’s Chief Executive Officer. “Furthermore, this updated economic analysis using a US$2,200/oz gold base case further solidifies the after-tax NPV (5%) at US$329 million, a post-tax IRR of 28.2% and reduces the payback to 2.9 years.”
Updated Economic Analysis
The updated Economic Analysis is based on the production and mining profile used in the 2023 PEA. Table 1 provides a summary of the production profile along with the updated project price economics.
Table 1: Updated Economic Analysis Summary
| General | Unit | Life-of-Mine (“LOM”) Total/Avg. |
| Gold Price | US$/oz | 2,200 |
| Mine Life | years | 11.2 |
| Total Waste Tonnes Mined | kt | 121,903 |
| Total Mill Feed Tonnes | kt | 31,128 |
| Production | Unit | LOM Total/Avg. |
| Strip Ratio | waste: mineralized rock | 3.9 |
| Mill Head Grade | g/t | 0.88 |
| Mill Recovery Rate | % | 96.7 |
| Total Payable Mill Ounces Recovered | koz | 851.9 |
| Total Average Annual Payable Production | koz | 75.9 |
| Operating Costs | Unit | LOM Total/Avg. |
| Mining Cost (incl. rehandle) | US$/t mined | 2.96 |
| Mining Cost (incl. rehandle) | US$/t milled | 13.49 |
| Processing Cost | US$/t milled | 10.91 |
| General & Administrative Cost | US$/t milled | 1.14 |
| Total Operating Costs | US$/t milled | 25.54 |
| Treatment & Refining Cost | US$/oz | 4.3 |
| Net Smelter Royalty | % | 1 |
| Cash Costs1 | US$/oz Au | 925 |
| All-In Sustaining Costs2 | US$/oz Au | 1,105 |
| Capital Costs | Unit | LOM Total/Avg. |
| Initial Capital | US$M | 215 |
| Expansion Capital3 | US$M | 6.5 |
| Sustaining Capital | US$M | 105 |
| Closure Costs | US$M | 33 |
| Salvage Value | US$M | 14 |
| Financials – Pre-Tax | Unit | LOM Total/Avg. |
| Net Present Value (5%) | US$M | 453 |
| Internal Rate of Return | % | 33.2 |
| Payback | years | 2.7 |
| Financials – Post-Tax | Unit | LOM Total/Avg. |
| Net Present Value (5%) | US$M | 329 |
| Internal Rate of Return | % | 28.2 |
| Payback | years | 2.9 |
|
Notes: |
||
| 1. Cash costs consist of mining costs, processing costs, mine-level G&A and treatment and refining charges. | ||
| 2. All-in sustaining costs include cash costs plus royalties, sustaining capital and closure costs. | ||
| 3. Expansion of mill from 2.5 million tonnes per annum to 3 Mtpa in year 5 of operation |
Capital & Operating Costs
The updated capital cost estimate conforms to Class 5 guidelines for a PEA-level estimate accuracy according to the Association for the Advancement of Cost Engineering International. The capital cost estimate was developed in Q1 2025 United States dollars based on Ausenco’s in-house database of projects and studies, as well as experience from similar operations and escalation of costs from 2023 PEA.
The updated estimate includes open pit mining, processing, on-site infrastructure, tailings and waste rock facilities, off-site infrastructure, project indirect costs, project delivery, owner’s costs, and contingency. The updated capital cost summary is presented in Table 2. The updated total initial capital cost for the Lemhi Project is US$214.9 million; and life-of-mine sustaining costs are US$104.8 million. The updated cost of expansion in the fifth year of production is estimated at US$6.5 million. Updated Closure costs are estimated at US$32.6 million, with salvage credits of US$13.9 million.
Table 2: Updated Summary of Capital Cost
| Work Breakdown Structure |
WBS Description | Initial Capital Cost (US$M) |
Sustaining Capital Cost LOM (US$M) |
Expansion Cost (US$M) |
Total Capital Cost LOM (US$M) |
| 1000 | Mine | 52.0 | 63.0 | 2.2 | 117.2 |
| 3000 | Process Plant | 73.5 | 1.7 | 2.7 | 77.9 |
| 4000 | Tailings | 10.7 | 39.9 | – | 50.6 |
| 5000 | On-Site Infrastructure | 20.2 | 0.2 | – | 20.4 |
| 6000 | Off-Site Infrastructure | 2.5 | – | – | 2.5 |
| Total Directs | 158.9 | 104.8 | 4.9 | 268.6 | |
| 7100 | Field Indirects | 6.9 | – | 0.2 | 7.1 |
| 7200 | Project Delivery | 12.8 | – | 0.3 | 13.1 |
| 7500 | Spares + First Fills | 3.2 | – | 0.2 | 3.4 |
| 8000 | Owner’s Cost | 4.2 | – | – | 4.2 |
| Total Indirects | 27.1 | – | 0.7 | 27.8 | |
| 9000 | Contingency | 28.9 | – | 0.9 | 29.8 |
| Project Total | 214.9 | 104.8 | 6.5 | 326.2 |
Sensitivity Analysis
A sensitivity analysis was conducted on the base case post-tax NPV5% and IRR of the project using the following variables: gold price, operating costs, and initial capital costs. Table 3 summarizes the post-tax sensitivity analysis results.
Table 3: Post-Tax Sensitivity Analysis
| Post-Tax NPV5% Sensitivity To Opex | Post-Tax IRR Sensitivity To Opex | |||||||||||
| Gold Price (US$/oz) | Gold Price (US$/oz) | |||||||||||
| #VALUE! | $1,600 | $1,750 | $2,200 | $2,600 | $3,400 | Opex | #VALUE! | $1,600 | $1,750 | $2,200 | $2,600 | $3,400 |
| (20.0 %) | 141 | 210 | 415 | 597 | 962 | (20.0 %) | 16.0 % | 20.7 % | 33.3 % | 43.3 % | 61.7 % | |
| (10.0 %) | 97 | 166 | 372 | 554 | 919 | (10.0 %) | 12.8 % | 17.8 % | 30.8 % | 40.9 % | 59.6 % | |
| — | 53 | 123 | 329 | 511 | 876 | — | 9.4 % | 14.7 % | 28.2 % | 38.6 % | 57.4 % | |
| 10.0 % | 9 | 79 | 286 | 468 | 833 | 10.0 % | 5.7 % | 11.4 % | 25.5 % | 36.2 % | 55.3 % | |
| 20.0 % | -36 | 35 | 242 | 425 | 790 | 20.0 % | 1.9 % | 7.9 % | 22.7 % | 33.7 % | 53.1 % | |
|
Post-Tax NPV Sensitivity To Initial Capex |
Post-Tax IRR Sensitivity To Initial Capex | |||||||||||
| Gold Price (US$/oz) | Gold Price (US$/oz) | |||||||||||
| #VALUE! | $1,600 | $1,750 | $2,200 | $2,600 | $3,400 | Initial Capex | #VALUE! | $1,600 | $1,750 | $2,200 | $2,600 | $3,400 |
| (20.0 %) | 97 | 166 | 373 | 555 | 919 | (20.0 %) | 14.2 % | 20.3 % | 36.1 % | 48.3 % | 70.9 % | |
| (10.0 %) | 75 | 145 | 351 | 533 | 898 | (10.0 %) | 11.6 % | 17.3 % | 31.8 % | 43.0 % | 63.5 % | |
| — | 53 | 123 | 329 | 511 | 876 | — | 9.4 % | 14.7 % | 28.2 % | 38.6 % | 57.4 % | |
| 10.0 % | 31 | 101 | 307 | 490 | 854 | 10.0 % | 7.4 % | 12.5 % | 25.2 % | 34.9 % | 52.4 % | |
| 20.0 % | 10 | 79 | 285 | 468 | 832 | 20.0 % | 5.7 % | 10.5 % | 22.6 % | 31.7 % | 48.2 % | |
Qualified Persons and Technical Disclosure
A team of Independent Qualified Persons (as such term is defined under National Instrument 43-101) at Ausenco and MMTS led the price sensitivity analysis and has reviewed and verified the technical disclosure in this press release. The team of Independent Qualified Persons, includes:
The scientific and technical information in this news release has been reviewed and verified by Dean Besserer, P.Geo., Vice-President of Exploration of the Company and Qualified Person as defined in NI 43-101.
The updated sensitivity analysis in respect of the PEA is preliminary in nature, it includes inferred mineral resources considered too speculative geologically to have the economic considerations applied to them that would enable them to be categorized as mineral reserves, and there is no certainty that the PEA will be realized. For a discussion on the basis and the qualifications and assumptions of the sensitivity analysis, please see the PEA entitled “Lemhi Gold Project, NI 43-101 Technical Report and Preliminary Economic Assessment” dated with an effective date of October 13, 2023, and available on SEDAR+ (www.sedarplus.ca) and the Company’s website (www.freemangoldcorp.com).
About the Company and Project
Freeman Gold Corp. is a mineral exploration company focused on the development of its 100% owned Lemhi Gold property. The Lemhi Gold Project comprises 30 square kilometres of highly prospective land, hosting a near-surface oxide gold resource. The pit constrained NI 43-101 compliant mineral resource estimate is comprised of 988,100 ounces gold at 1.0 gram per tonne in 30.02 million tonnes (Measured & Indicated) and 256,000 oz Au at 1.04 g/t Au in 7.63 million tonnes (Inferred). The Company is focused on growing and advancing the Lemhi Gold Project towards a production decision. To date, 525 drill holes and 92,696 m of drilling has historically been completed.
The recently updated price sensitivity analysis shows a PEA with an after-tax net present value (5%) of US$329 million and an internal rate of return of 28.2% using a base case gold price of US$2,200/oz; Average annual gold production of 75,900 oz Au for a total life-of-mine of 11.2 years payable output of 851,900 oz Au; life-of-mine cash costs of US$925/oz Au; and, all-in sustaining costs of US$1,105/oz Au using an initial capital expenditure of US$215 million.
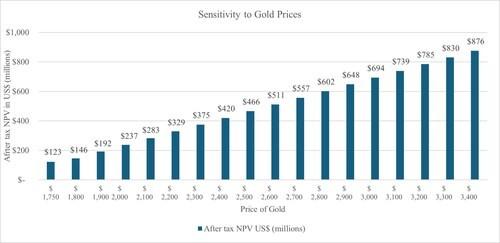
Figure 1: Post-Tax NPV5% at Various Gold Prices (CNW Group/Freeman Gold Corp.)
Coppernico Metals Inc. (TSX: COPR) (OTCQB: CPPMF) (FSE: 9I3) is pleased to announce the successful c... READ MORE
Independence Gold Corp. (TSX-V: IGO) (OTCQB: IEGCF) (FSE: 625) is pleased to announce the discovery... READ MORE
Nova Minerals Corp (NYSE: NVA) (ASX: NVA) is pleased to report results from bench-scale rougher flot... READ MORE
Bunker Hill Mining Corp. (TSX: BNKR) (OTCQB: BHLL) is pleased to announce the production of concentr... READ MORE
Koryx Copper S.A. (TSX: KRY.V) (NSX: KYX) (OTCQB: KRYXF) is pleased to announce assay results from 1... READ MORE


