


Fortuna Mining Corp. (NYSE: FSM) (TSX: FVI) announces positive results from the feasibility study for its Diamba Sud Gold Project in Senegal, confirming an economically robust open-pit conventional carbon-in-leach gold mine and advancing one of Fortuna’s key growth opportunities.
Jorge A. Ganoza, President and CEO of Fortuna, commented, “Diamba Sud is a standout growth project with high returns, fast payback, and is expected to be our lowest-cost mine. Together with our Séguéla mine expansion, Diamba Sud supports our plan to grow our annual gold production rate by approximately 60% to more than 500,000 ounces in 2028.” Mr. Ganoza concluded, “With the recent receipt of the environmental decree from the Senegalese government and the feasibility study complete, we are ready to move Diamba Sud toward a final investment decision upon completion of the mining permit process.”
Feasibility Study Highlights
Financial
Production and Cost
CAPEX and Funding
Early Works
Notes:
Diamba Sud Feasibility Study Overview
The Feasibility Study was prepared by Fortuna and supported by a team of independent industry experts, including Lycopodium, Knight Piesold, Kenmore Mine Consulting, SOJUFISC, Infinity Corporate Finance, Piteau Associates, Entech, and Earth Systems.
The Diamba Sud Gold Project is located in the Kédougou Region of southeastern Senegal, approximately 665 kilometers southeast of Dakar, 83 kilometers northeast of Kédougou, and 50 kilometers north of the Senegal-Guinea border. The Project comprises the contiguous DS1 and DS2 permit blocks, situated approximately 7 kilometers west of the Falémé River near the Senegal-Mali border.
Diamba Sud is operated by Boya S.A., a wholly owned indirect subsidiary of Fortuna. Boya holds full and unrestricted surface rights over the land covered by the exploration permit, subject to applicable mining regulations. Upon the granting of an exploitation permit, the State of Senegal will assume a 10% free-carried ownership interest in the Project.
Table 1 summarizes the key assumptions, operational parameters, economic results, and AISC values from the FS.
Table 1: Feasibility Study Summary
| Metrics | Units | Results | ||
| Gold price | $/oz | 3,500 | ||
| Life of mine | year | 9.4 | ||
| Total ore mined1 | Mt | 20.5 | ||
| Contained gold in ore mined1 | koz | 1,151 | ||
| Strip ratio | w:o | 6.3:1 | ||
| Throughput (oxide) | Mtpa | 2.5 | ||
| Throughput (fresh) | Mtpa | 2.0 | ||
| Head grade | g/t Au | 1.75 | ||
| Recovery | % | 91% | ||
| Gold production | ||||
| Total production over LOM | koz | 1,053 | ||
| Average annual production, LOM | koz | 116 | ||
| Average annual production, first 4 years | koz | 158 | ||
Per unit costs over LOM |
||||
| Total mining costs | $/t, mined | $4.8 | ||
| Processing | $/t, processed | $16.1 | ||
| G&A | $/t, processed | $8.6 | ||
| Cash costs 2 | ||||
| Average operating cash costs2, LOM | $/oz | $1,146 | ||
| Average operating cash costs2, first 4 years | $/oz | $856 | ||
| AISC2 | ||||
| Average AISC2, LOM | $/oz | $1,332 | ||
| Average AISC2, first 4 years | $/oz | $1,056 | ||
| Capital costs | ||||
| Initial capital expenditure | $ M | $398 | ||
| Sustaining capital, operations + Infrastructure (includesclosure costs) | $ M | $79 | ||
| NPV5%, pre-tax (100% project basis) | $ M | $1,379 | ||
| Pre-tax IRR | % | 70% | ||
| NPV5%, after-tax (100% project basis) | $ M | $1,009 | ||
| After-tax IRR | % | 60% | ||
| Payback period | years | 1 | ||
| Annual EBITDA 2 | ||||
| Average EBITDA2 over LOM | $ M | $258 | ||
| Average EBITDA2 over first 4 years | $ M | $398 | ||
Notes:
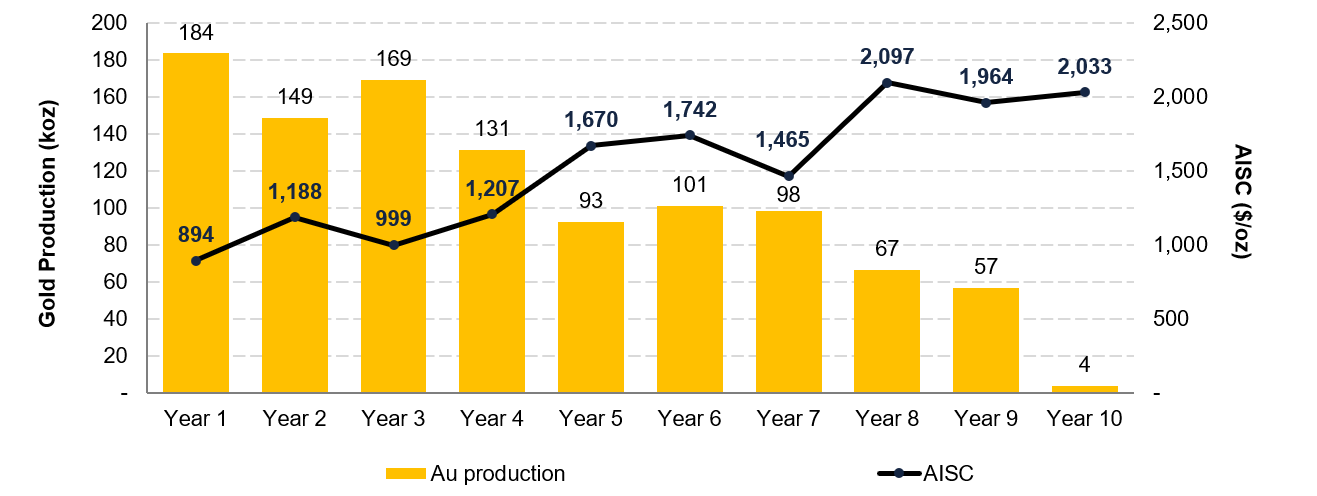
Figure 1 illustrates the Diamba Sud FS LOM production and cost profile and highlights average production of 158,000 ounces per year over the initial four years at an AISC of $1,056/oz.
Figure 1: Diamba Sud FS LOM Production and Cost Profile
Key Improvements from the 2025 PEA
The 2026 Diamba Sud FS supersedes the Preliminary Economic Assessment dated October 15, 2025, and reflects a more advanced, higher-confidence project with stronger production, a longer mine life, improved technical definition, and reduced execution risk. Key optimizations to the Project include:
Exploration Upside: Resource Growth and Continued Expansion Potential
The initial Mineral Reserve estimate for Diamba Sud (see Table 2 below) represents a major milestone and provides the foundation for a long-life, low-cost open pit operation with strong production and cash flow potential. The Probable Mineral Reserves total 20.5 million tonnes averaging 1.75 g/t Au, containing 1.15 million ounces of gold. Importantly, Diamba Sud remains open for further growth. The FS mine plan is based on the current Mineral Reserve, while additional opportunities remain to convert Mineral Resources into Mineral Reserves and to expand the resource base through continued drilling. This provides Fortuna with a clear pathway to potentially extend mine life, enhance future production, and increase the overall value of the Project.
The Mineral Reserve estimate is supported by FS-level technical work, including metallurgical, geotechnical, hydrogeological, environmental, mine planning, processing, infrastructure, and cost studies. Mineral Reserves are reported at the point of delivery to the process plant using the 2014 CIM Definition Standards, on a 100% basis, and are classified as Probable Mineral Reserves. Mineral Reserves are estimated and reported as at April 10, 2026, and are summarized in Table 2. Mineral Resources, reported exclusive of Mineral Reserves, are summarized in Table 3.
Table 2: Mineral Reserve Estimate
| Classification | Deposit | Tonnes (kt) | Au (g/t) | Au (koz) |
| Probable Mineral Reserves | Area A | 4,136 | 1.59 | 211 |
| Area D | 5,103 | 1.70 | 279 | |
| Karakara | 2,859 | 1.87 | 172 | |
| Kassasoko | 1,164 | 0.96 | 36 | |
| Moungoundi | 1,069 | 1.10 | 38 | |
| Southern Arc | 4,464 | 2.31 | 332 | |
| Western Splay | 1,706 | 1.51 | 83 | |
| Total | 20,500 | 1.75 | 1,151 |
Table 3: Mineral Resource Estimate, exclusive of Mineral Reserves
| Classification | Deposit | Tonnes (kt) | Au (g/t) | Au (koz) |
| Indicated Mineral Resources | Area A | 288 | 0.50 | 5 |
| Area D | 436 | 0.53 | 8 | |
| Karakara | 221 | 0.61 | 4 | |
| Kassasoko | 206 | 0.49 | 3 | |
| Moungoundi | 279 | 0.75 | 7 | |
| Southern Arc | 1,701 | 1.62 | 89 | |
| Western Splay | 233 | 0.74 | 6 | |
| Total | 3,364 | 1.12 | 121 | |
| Inferred | Area A | 152 | 1.45 | 7 |
| Area D | 264 | 0.95 | 8 | |
| Karakara | 26 | 1.47 | 1 | |
| Kassasoko | 138 | 0.86 | 4 | |
| Moungoundi | 107 | 1.09 | 4 | |
| Southern Arc | 734 | 1.42 | 33 | |
| Western Splay | 211 | 1.64 | 11 | |
| Total | 1,632 | 1.30 | 68 |
Notes:
Since 2023, Fortuna has invested meaningfully in mineral exploration at Diamba Sud, with the growth reflected in the maiden Mineral Reserve estimate summarized in Table 2. This work has increased both the scale and confidence of the resource base and supports the feasibility study mine plan. The Project retains further upside, particularly at Southern Arc, where recent drilling indicates the potential to extend mineralization.
Ongoing drilling is expected to test open extensions, improve geological confidence in areas currently classified as Inferred Resources, and identify additional mineralization beyond the current feasibility study mine plan. This work provides a clear pathway to further expand and upgrade the resource base, with the potential to support future mine life extensions and additional value creation.
Mining and Processing
The FS outlines a conventional open pit gold mining operation feeding a central processing facility over a 9.4-year project life. The mine plan incorporates the Area A, Area D, Karakara, Kassassoko, Moungoudi, Southern Arc, and Western Splay deposits, with mining sequenced to support a consistent production profile over the LOM. The proposed general arrangement of the site infrastructure is shown in Figure 2.
The pit optimization shells used to constrain the Mineral Reserve were generated using a gold price of $2,900/oz and a revenue factor of 1.0. Optimization parameters included government royalties, refining, mining, processing, and general and administrative costs to support realistic pit designs and economic assumptions.
Based on the Mineral Reserve estimate, the mine plan includes the mining of 20.5 million tonnes of ore at an average gold grade of 1.75 g/t, containing 1.15 million ounces of gold. A total of 130 million tonnes of waste will be mined, resulting in a LOM strip ratio of 6.3:1.
Mining will use conventional open pit methods, including drilling and blasting for both oxide and fresh ore, followed by truck-and-shovel mining operations. Ore from the open pits will be processed through a conventional CIL plant designed to produce gold doré, incorporating crushing, milling, gravity recovery, CIL processing, carbon elution, and gold recovery.
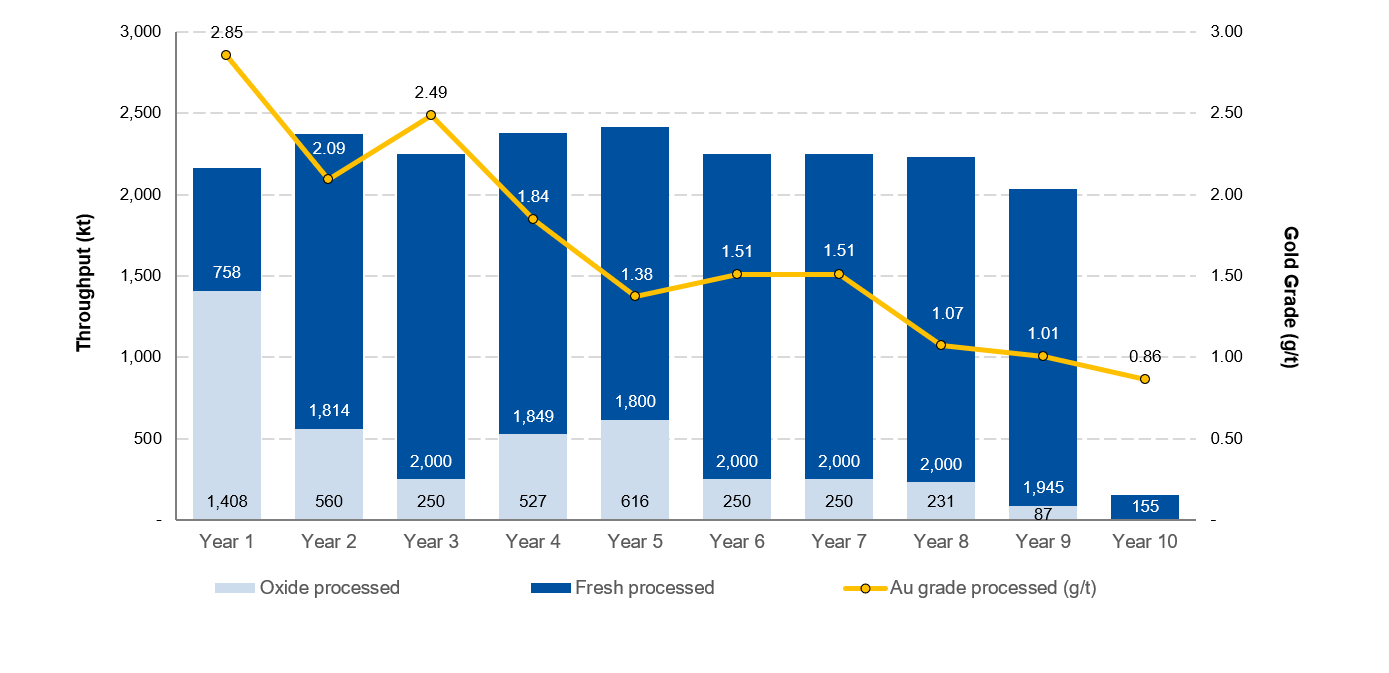
The process plant is designed to treat the ore at an average annual processing rate of approximately 2.26 million tonnes, as shown in Figure 3, producing 1.05 million ounces of gold at a LOM metallurgical recovery of 91%.
Figure 2: Diamba Sud Mine General Site Infrastructure General Arrangement
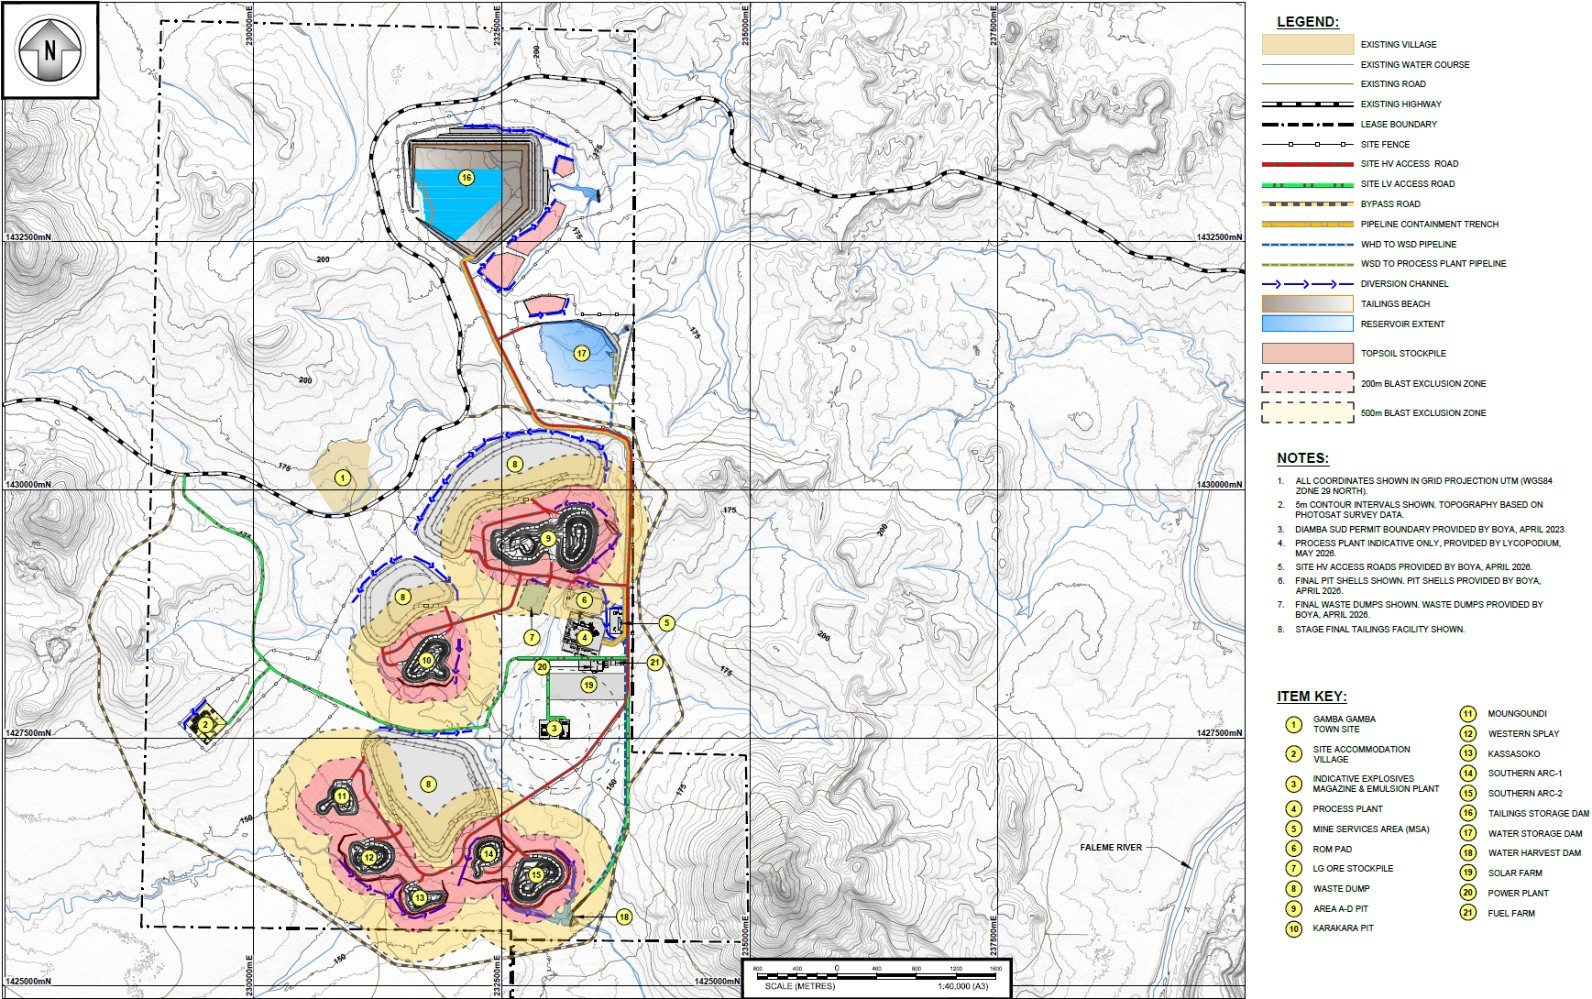
Figure 3: Diamba Sud FS LOM processing schedule
A summary of the key operating and production statistics from the FS is presented in Table 4. The Area A and D deposits are combined for planning purposes as they are to be mined from a single contiguous pit.
Table 4: Diamba Sud LOM Mining and Processing Plan Metrics
| Y0 | Y1 | Y2 | Y3 | Y4 | Y5 | Y6 | Y7 | Y8 | Y9 | Y10 | LOM | |
| Area AD | ||||||||||||
| Ore mined (kt) | 81 | 1,825 | 284 | 16 | 1,034 | 2,393 | 1,515 | 2,090 | – | – | – | 9,239 |
| Au grade (g/t) | 0.84 | 2.39 | 2.31 | 1.14 | 1.25 | 1.32 | 1.93 | 1.32 | – | – | – | 1.65 |
| Karakara | ||||||||||||
| Ore mined (kt) | – | – | 30 | 819 | 1,972 | 37 | – | – | – | – | – | 2,859 |
| Au grade (g/t) | – | – | 1.24 | 2.04 | 1.79 | 2.85 | – | – | – | – | – | 1.87 |
| Kassasoko | ||||||||||||
| Ore mined (kt) | – | – | – | – | – | – | 25 | 82 | 136 | 922 | – | 1,164 |
| Au grade (g/t) | – | – | – | – | – | – | 0.99 | 0.70 | 0.87 | 0.99 | – | 0.96 |
| Moungoudi | ||||||||||||
| Ore mined (kt) | – | – | – | – | – | – | – | – | 97 | 923 | 49 | 1,069 |
| Au grade (g/t) | – | – | – | – | – | – | – | – | 0.95 | 1.10 | 1.49 | 1.10 |
| South Arc | ||||||||||||
| Ore mined (kt) | 234 | 1,348 | 1,321 | 1,561 | – | – | – | – | – | – | – | 4,464 |
| Au grade (g/t) | 1.72 | 1.95 | 2.50 | 2.56 | – | – | – | – | – | – | – | 2.32 |
| Western Splay | ||||||||||||
| Ore mined (kt) | – | – | – | – | – | – | 59 | 767 | 879 | – | – | 1,706 |
| Au grade (g/t) | – | – | – | – | – | – | 1.08 | 1.29 | 1.73 | – | – | 1.51 |
| Total | ||||||||||||
| Ore mined (kt) | 315 | 3,173 | 1,635 | 2,396 | 3,006 | 2,430 | 1,599 | 2,939 | 1,112 | 1,845 | 49 | 20,500 |
| Au grade (g/t) | 1.50 | 2.21 | 2.45 | 2.37 | 1.61 | 1.34 | 1.88 | 1.30 | 1.56 | 1.04 | 1.49 | 1.75 |
| Contained gold (koz) | 15 | 225 | 129 | 183 | 155 | 105 | 97 | 123 | 56 | 62 | 2 | 1,151 |
| Waste mined (kt) | 3,644 | 15,439 | 16,606 | 16,259 | 16,020 | 16,612 | 17,438 | 12,664 | 8,114 | 6,768 | 53 | 129,618 |
| Total mined (kt) | 3,959 | 18,612 | 18,242 | 18,656 | 19,027 | 19,042 | 19,037 | 15,603 | 9,226 | 8,613 | 102 | 150,118 |
| Stockpile | ||||||||||||
| End of period (kt) | 315 | 1,322 | 584 | 730 | 1,360 | 1,373 | 722 | 1,412 | 292 | 106 | – | n/a |
| Grade (g/t) | 1.5 | 0.98 | 0.57 | 0.57 | 0.64 | 0.58 | 0.58 | 0.59 | 0.60 | 0.57 | – | n/a |
| Processing | ||||||||||||
| Material milled (kt) | – | 2,166 | 2,374 | 2,250 | 2,376 | 2,416 | 2,250 | 2,250 | 2,231 | 2,031 | 155 | 20,500 |
| Head grade (g/t) | – | 2.85 | 2.09 | 2.49 | 1.84 | 1.38 | 1.51 | 1.51 | 1.07 | 1.01 | 0.86 | 1.75 |
| Contained gold (koz) | – | 199 | 160 | 180 | 141 | 107 | 109 | 109 | 77 | 66 | 4 | 1,151 |
| Recovery (%) | – | 93 | 93 | 94 | 93 | 87 | 93 | 90 | 86 | 87 | 86 | 91 |
| Gold production (koz) | – | 184 | 149 | 169 | 131 | 93 | 101 | 98 | 67 | 57 | 4 | 1,053 |
Totals may not add due to rounding
Tailings, Water, and Power
The FS incorporates a fully geomembrane-lined tailings storage facility designed in accordance with industry best practices and the Global Industry Standard on Tailings Management. The tailings management system will include a tailings pipeline and a water return pipeline housed within a geomembrane-lined trench, together with associated tailings pumps. The TSF will be developed as a side-valley facility formed by robust, multi-zoned earth-fill embankments and constructed using the downstream methodology. It is designed to accommodate 20.5 million tonnes over the LOM.
Water management has been designed to maximize recycling and minimize environmental impacts on surrounding communities. A water storage dam will serve as the main collection and storage facility for clean, raw, and process water. Raw water will be supplied by pipeline from the water harvesting dam and supplemented by pit dewatering activities. Process water from the tailings storage facility will be recycled back to the process plant, with site operations designed as a closed-circuit system to maximize water reuse.
Power will be supplied through an integrated hybrid power solution comprising HFO, solar photovoltaic, and battery energy storage system components. The HFO power generation component has been agreed with African Power Services with solar integration targeted during the first year of operations.
Capital Costs Summary
The FS estimates total initial capital required to develop Diamba Sud at $397.5 million, including $72.1 million in pre-production costs and $33.7 million in contingency. Sustaining capital is estimated at $64.0 million over the 9.4-year LOM, with closure costs estimated at an additional $14.5 million.
Pre-production mining capital includes all mining activities required prior to commissioning of the processing facility. This includes the mining of 3.6 million tonnes of waste and 315,000 tonnes of ore to establish an ore stockpile ahead of processing operations, as well as contractor mobilization and setup costs.
The processing plant capital estimate is based on a facility with a nameplate fresh ore throughput of 2.0 million tonnes per annum, designed to accommodate up to 2.5 Mtpa with an oxide blend. The capital cost estimate assumes an Engineering, Procurement, Construction, and Management implementation approach.
A summary of estimated capital costs is presented in Table 5 and estimated annual sustaining capital costs are presented in Table 6.
Table 5: Summary of Initial Development Capital Costs
| Capital Costs | Value ($ M) |
| Construction costs | 284.6 |
| Pre-production costs (excluding mining) | 37.7 |
| Mining pre-stripping | 34.4 |
| Contingency | 33.7 |
| Withholding taxes, duties, levies | 7.0 |
| Total | 397.5 |
Totals may not add due to rounding
Table 6: Estimated Annual Sustaining Capital Costs
| Project | Y1 | Y2 | Y3 | Y4 | Y5 | Y6 | Y7 | Y8 | Y9 | Y10 | Total |
| TSF lifts ($ M) | 10.7 | – | 8.1 | – | 8.8 | – | 3.8 | – | – | – | 31.5 |
| Aerodrome ($ M) | 5.0 | – | – | – | – | – | – | – | – | – | 5.0 |
| Roads ($ M) | – | 1.7 | 0.5 | – | 0.7 | – | 0.4 | – | – | – | 3.3 |
| Surface water management ($ M) | – | 0.4 | 0.8 | – | 0.9 | – | – | – | – | – | 2.1 |
| PV + BESS ($ M) | 16.4 | – | – | – | – | – | – | – | – | – | 16.4 |
| Fuel farm ($ M) | 0.8 | 0.8 | 0.8 | 0.8 | 0.8 | 0.8 | 0.8 | – | – | – | 5.8 |
| Total ($ M) | 32.9 | 2.9 | 10.2 | 0.8 | 11.2 | 0.8 | 5.1 | – | – | – | 64.0 |
Totals may not add due to rounding
The FS capital estimate reflects a materially more advanced basis of estimate compared to the PEA, supported by a higher level of engineering definition. Key quantities and bills of quantities for major scopes, including steelwork, concrete, and overland piping, are now derived from 3D models, while major mechanical equipment pricing is supported by quotation-based inputs.
The increase in capital costs compared to the PEA reflects several factors, including the incorporation of local content requirements and Senegalese regulations as well as higher material quantities derived from the more advanced engineering and additional ground improvement requirements. The increase also reflects scope growth associated with the expanded resource base, including increased tailings storage and infrastructure requirements, additional pre-stripping, haulage roads, and water management related to bringing Southern Arc forward in the mine plan.
Operating Cost Estimates Summary
The FS estimates direct operating costs of $58.86/t of material milled, or $1,146/oz of gold produced, and LOM AISC1 of $1,332/oz, as summarized in Table 7.
Table 7: LOM AISC1 Estimate
| $ M | $/t milled | $/payable oz | |
| Operating cost | |||
| Mining | 699 | 34.703 | 664 |
| Processing | 330 | 16.09 | 313 |
| G&A | 177 | 8.65 | 168 |
| Subtotal, direct operating costs | 1,207 | 58.86 | 1,146 |
| Refining | 3 | 0.15 | 3 |
| Royalties2 | 111 | 5.39 | 105 |
| Social development fund2 | 18 | 0.90 | 18 |
| Total operating costs | 1,339 | 65.30 | 1,272 |
| Sustaining capital and reclamation | |||
| Sustaining Capital | 64 | 3.12 | 61 |
| All-in Sustaining Cost1 | 1,403 | 68.42 | 1,332 |
Notes:
Financial Analysis
Diamba Sud has been evaluated using a discounted cash flow analysis. The base case, using a gold price of $3,500/oz, generates an after-tax NPV5% of $1.0 billion, an IRR of 60%, and a payback period of approximately 12 months.
Table 8 illustrates the estimated LOM cash flow profile for Diamba Sud reported by calendar year based on first gold pour in June 2028 on both a pre-tax and post-tax basis. Pre-tax cash flows include royalties, duties, and levies, while post-tax cash flows are net of corporate income taxes.
Table 8: Diamba Sud LOM Cash Flow Profile, Pre-Tax and Post-Tax
| 2026 | 2027 | 2028 | 2029 | 2030 | 2031 | 2032 | 2033 | 2034 | 2035 | 2036 | 2037 | LOM | ||
| Net Au recovered | koz | – | – | 88 | 179 | 177 | 125 | 125 | 73 | 123 | 66 | 68 | 29 | |
| Revenue & OPEX by department | ||||||||||||||
| Gold sales | $ M | – | – | 308 | 627 | 620 | 438 | 438 | 256 | 431 | 228 | 238 | 104 | 3,684 |
| Mining costs | $ M | – | – | -54 | -85 | -90 | -86 | -92 | -81 | -94 | -51 | -47 | -19 | -699 |
| Processing costs | $ M | – | – | -20 | -37 | -36 | -36 | -37 | -37 | -37 | -37 | -36 | -17 | -330 |
| General & administration costs | $ M | – | – | -12 | -20 | -20 | -20 | -20 | -20 | -20 | -20 | -17 | -7 | -177 |
| Transport, insurance and refining costs | $ M | – | – | -0 | -1 | -1 | -0 | -0 | – | – | – | – | – | -3 |
| Royalties & statutory costs | $ M | – | – | -11 | -22 | -22 | -15 | -15 | -9 | -15 | -8 | -8 | -4 | -129 |
| Unit Costs – Per Oz Au | ||||||||||||||
| AISC | $/oz Au | – | – | 980 | 1,001 | 984 | 1,330 | 1,233 | 2,297 | 1,292 | 2,062 | 1,948 | 1,683 | 1,332 |
| Profitability | ||||||||||||||
| Net revenue | $ M | – | – | 297 | 605 | 598 | 422 | 422 | 247 | 415 | 220 | 230 | 100 | 3,555 |
| Total site operating expenses | $ M | – | – | -57 | -142 | -145 | -146 | -132 | -153 | -141 | -126 | -124 | -45 | -1,210 |
| EBITDA | $ M | – | – | 240 | 463 | 452 | 276 | 291 | 94 | 275 | 94 | 106 | 55 | 2,346 |
| Project Cashflows (Post tax, Pre- finance) | ||||||||||||||
| Net revenue | $ M | – | – | 297 | 605 | 598 | 422 | 422 | 247 | 415 | 220 | 230 | 100 | 3,555 |
| OPEX | $ M | – | – | -86 | -142 | -147 | -142 | -149 | -138 | -152 | -108 | -100 | -44 | 1,210 |
| Tax paid | $ M | – | – | – | -32 | -104 | -120 | -68 | -68 | -12 | -64 | -10 | -14 | -491 |
| CAPEX | $ M | -95 | -189 | -113 | – | – | – | – | – | – | – | – | – | -398 |
| Sustaining & closure capital | $ M | – | – | -28 | -16 | -8 | -5 | -8 | -6 | -4 | -3 | -1 | 0 | -79 |
| Cash Flow | ||||||||||||||
| Pre-tax (project) | $ M | -95 | -189 | 70 | 446 | 442 | 274 | 265 | 102 | 260 | 108 | 129 | 56 | 1,870 |
| After-tax (project) | $ M | -95 | -189 | 70 | 414 | 339 | 155 | 198 | 34 | 248 | 44 | 120 | 43 | 1,379 |
| Cumulative after-tax | $ M | -95 | -284 | -215 | 200 | 538 | 693 | 891 | 925 | 1,173 | 1,216 | 1,336 | 1,379 | 1,379 |
Totals may not add due to rounding
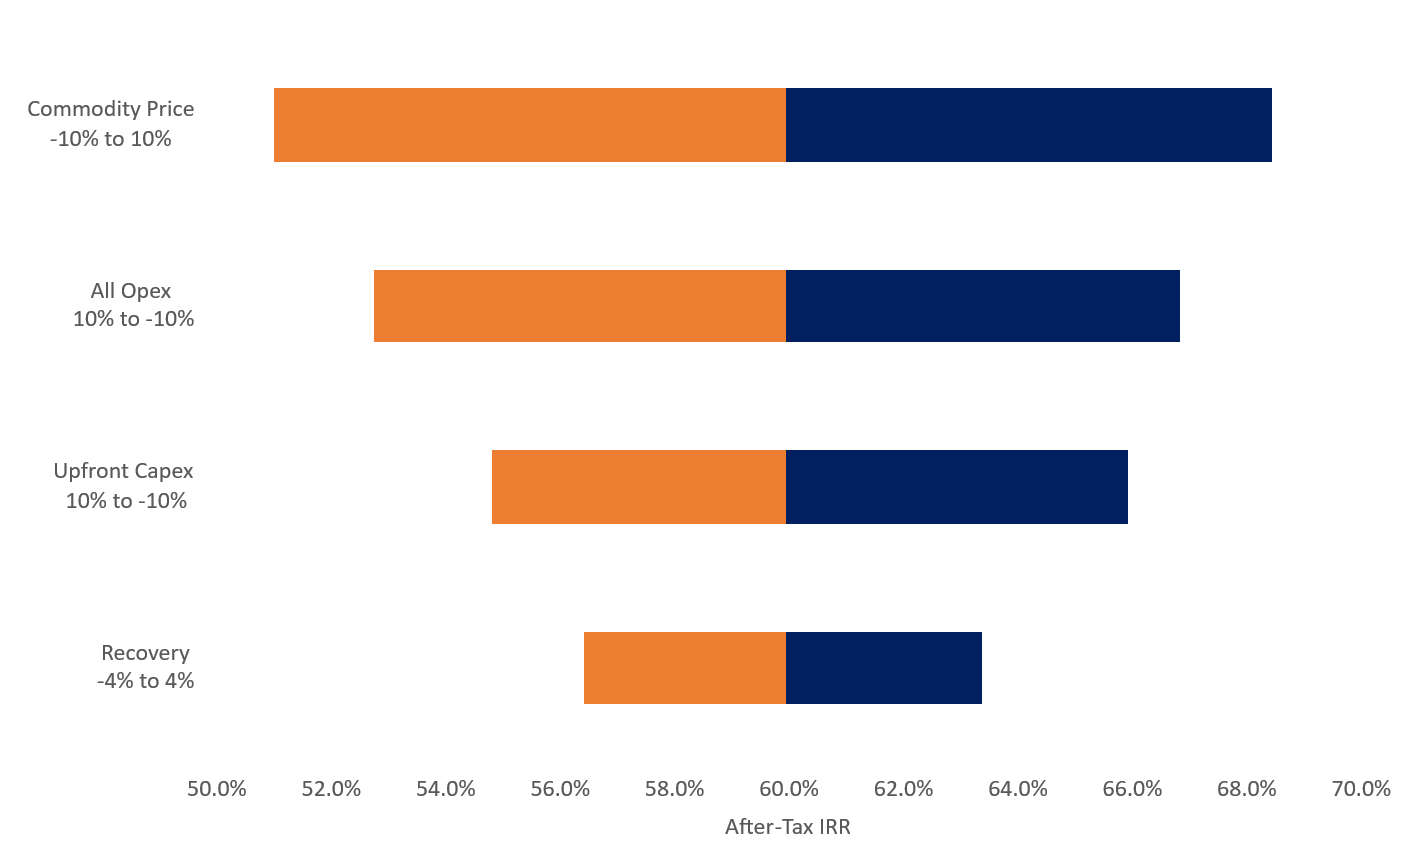
Sensitivity Analysis: Strong Economic Performance Across a Range of KeyVariables
A sensitivity analysis was completed to evaluate the impact of changes in key operating and economic variables, including gold price, head grade, metallurgical recovery, capital costs, and operating costs.
The analysis shows that Diamba Sud’s net present value and internal rate of return are most sensitive to revenue-related variables, including gold price, head grade, and process plant recovery. The Project is also more sensitive to changes in operating costs than capital costs.
Estimated NPV sensitivities for key operating and economic variables are presented in Figure 6.
Figure 6: After-Tax NPV5% Sensitivities
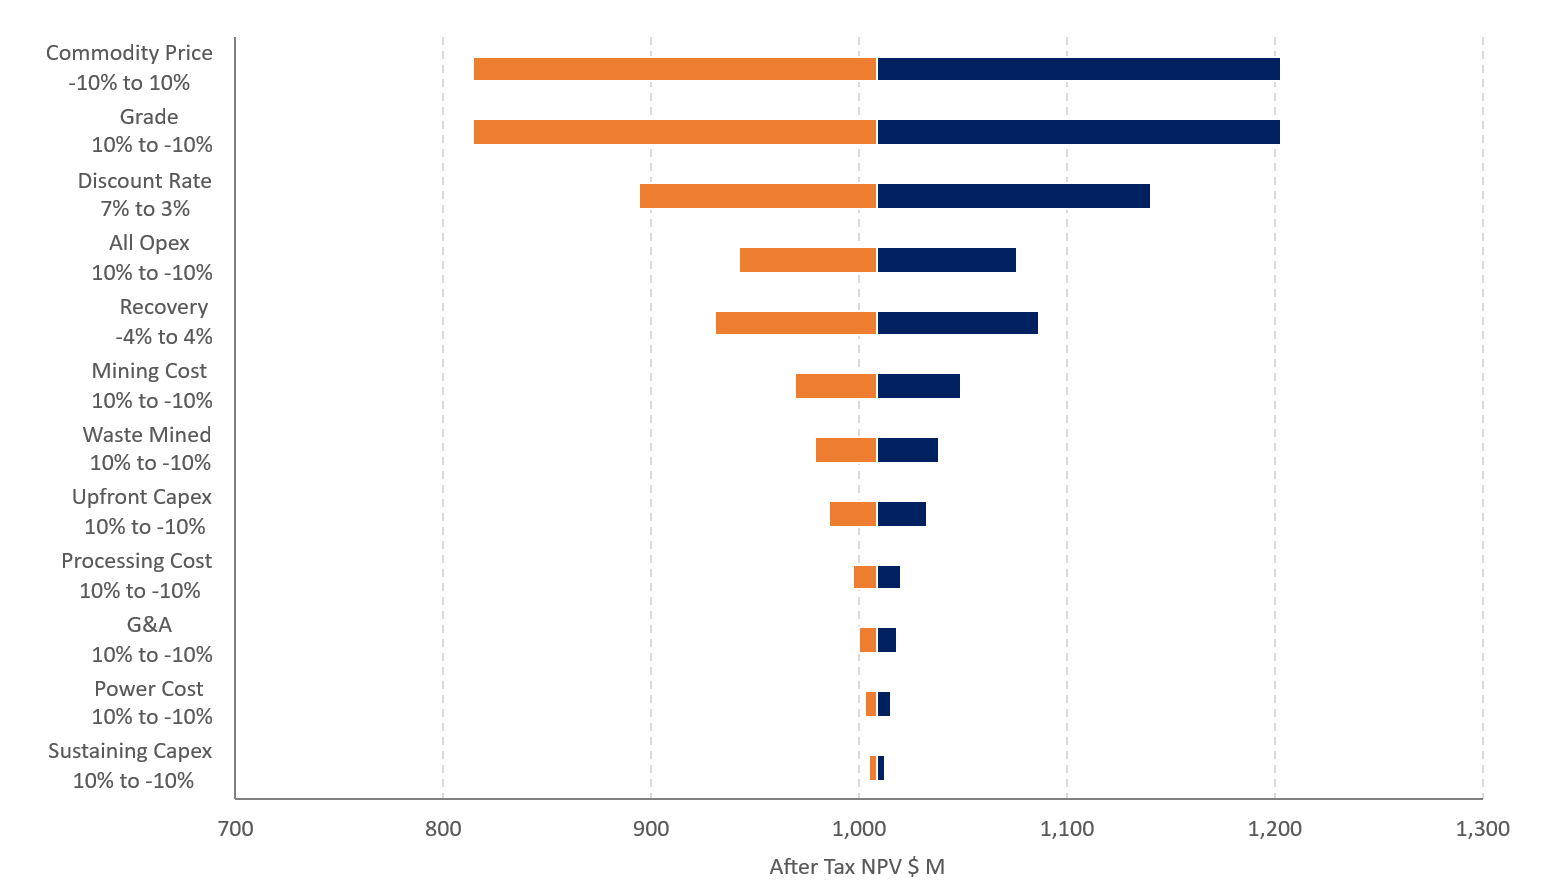
Table 9 presents the sensitivity of NPV and IRR to changes in gold price, with the base case highlighted.
Table 9: After-Tax NPV5% and IRR Sensitivities to Gold Price
| Gold Price ($/oz) | |||||||||||||||||||
| $2,500 | $2,750 | $3,000 | $3,250 | $3,500 | $3,750 | $4,000 | $4,250 | $4,500 | |||||||||||
| Sensitivity | NPV5% ($ M) |
$442 | $587 | $731 | $870 | $1,009 | $1,148 | $1,287 | $1,426 | $1,565 | |||||||||
| IRR (%) |
33 | 40 | 47 | 54 | 60 | 66 | 72 | 78 | 83 | ||||||||||
Figure 7 presents IRR sensitivity to changes in the key operating parameters.
Figure 7: Diamba Sud After-Tax IRR Sensitivities, Base Case of 60%
Environmental and Permitting
Fortuna continues to advance the permitting process for Diamba Sud in Senegal. On October 7, 2025, the Company filed the Environmental and Social Impact Assessment with the Direction de la Réglementation Environnementale et du Contrôle, a division of Senegal’s Ministry of the Environment and Sustainable Development.
On February 4, 2026, Fortuna submitted an application for an exploitation permit for Diamba Sud to Senegal’s Ministry of Energy, Petroleum, and Mines. The Certificate of Conformity for the ESIA was received on June 11, 2026, representing a key milestone in the permitting process and further advancing Diamba Sud toward a potential final investment decision in mid-year 2026.
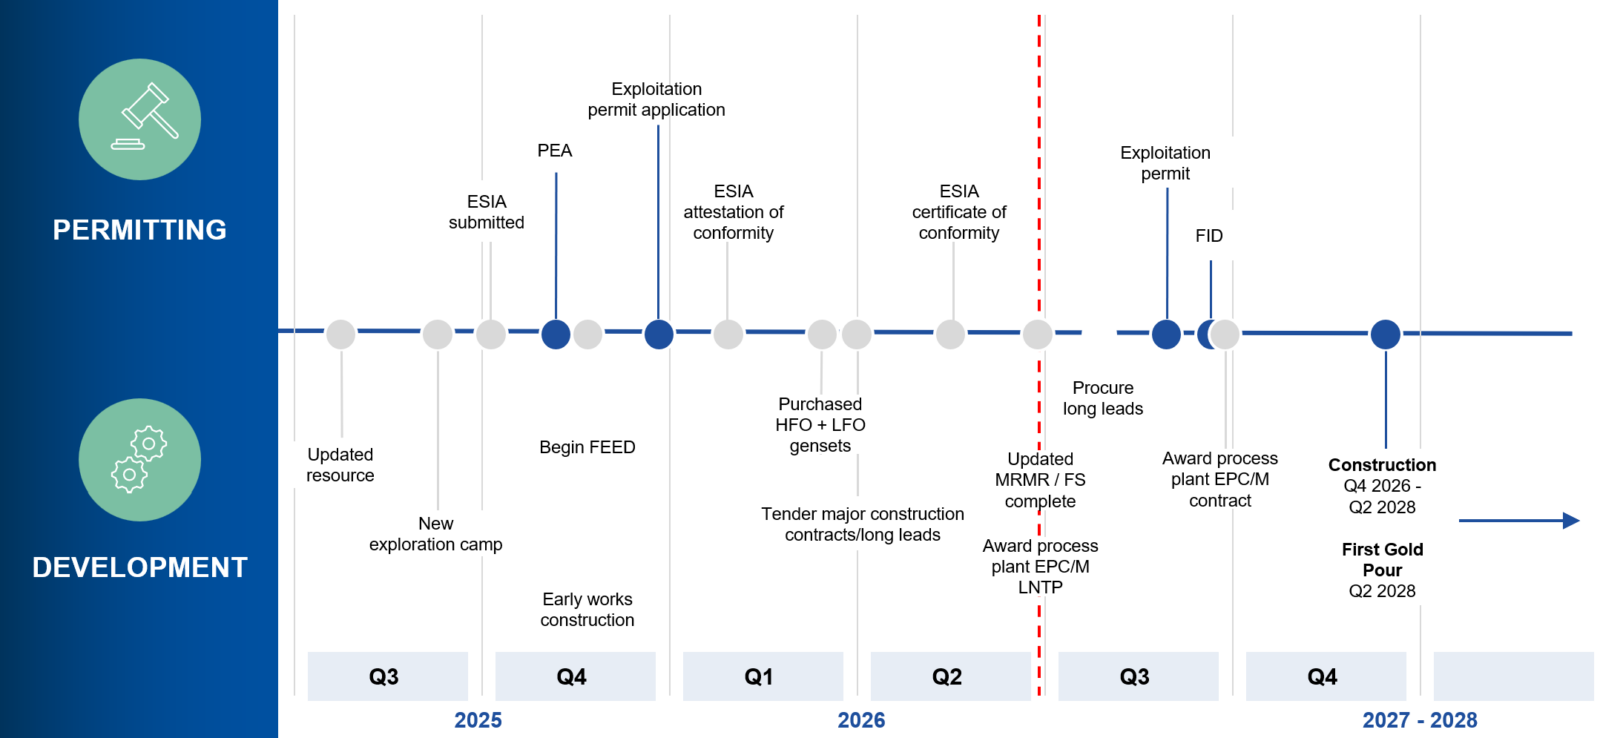
Next Steps: Early Works, Permitting, and Final Investment Decision
Fortuna has approved an early works budget of $73 million to de-risk Diamba Sud’s development schedule and advance site readiness alongside permitting and preparation for a final investment decision. Early works are progressing, including the site access road and camp expansion, while tenders for key infrastructure packages, including the TSF, are also advancing.
Front-end engineering and design and other detailed design studies are well advanced in support of project execution planning. This work is focused on long-lead items and critical-path activities, allowing selected orders to be placed as early as the third quarter of 2026. The power plant HFO and LFO generators have already been secured, with site delivery expected mid-2027. Of the approved $73 million early works budget, approximately $18 million has been spent to date.
With the FS now complete, Fortuna is well positioned to advance Diamba Sud toward a final investment decision, subject to the receipt of the required permitting approvals. The tender process for the processing plant contract is under evaluation, with a notice of award expected later this month. A positive final investment decision would position Diamba Sud to begin full construction in the fourth quarter of 2026, following the wet season, with first gold pour targeted before the end of the second quarter of 2028.
Beyond the FS base case, Diamba Sud retains meaningful upside through continued exploration, resource conversion, and project optimization. Ongoing drilling is expected to test extensions to known deposits, upgrade Inferred Mineral Resources, and evaluate opportunities to convert additional resources into Mineral Reserves. Further optimization opportunities may also be assessed through detailed engineering, mine sequencing, procurement, and operating cost refinement as the Project advances toward a final investment decision and construction.
The projected development timeline and key milestones are illustrated in Figure 8.
Figure 8: Diamba Sud Projected Development Timeline and Key Milestones
Technical Report
A technical report supporting the results of the FS will be prepared in accordance with National Instrument 43-101, Standards of Disclosure for Mineral Projects and filed on SEDAR+ at www.sedarplus.com and on EDGAR at www.sec.gov/edgar under Fortuna Mining Corp.’s profile within 45 days of the date of this news release. The technical report will also be available on the Company’s website at www.fortunamining.com.
Qualified Person
Raul Espinoza, Director of Technical Services for Fortuna Mining Corp., is a Fellow and Chartered Professional of the Australasian Institute of Mining and Metallurgy (FAusIMM CP) and a Qualified Person as defined by National Instrument 43-101, Standards of Disclosure for Mineral Projects. Mr. Espinoza has reviewed and approved the scientific and technical information pertaining to the Project contained in this news release and has verified the underlying data.
About Fortuna Mining Corp.
Fortuna Mining Corp. is a Canadian precious metals mining company with three operating mines and a portfolio of exploration projects in Argentina, Côte d’Ivoire, Guinea, Guyana, and Peru, as well as the Diamba Sud Gold Project in Senegal. Sustainability is at the core of our operations and stakeholder relationships. We produce gold and silver while creating long-term shared value through efficient production, environmental stewardship, and social responsibility. For more information, please visit our website at www.fortunamining.com
ON BEHALF OF THE BOARD
Jorge A. Ganoza
President, CEO, and Director
Fortuna Mining Corp.
Investor Relations:
Carlos Baca | info@fmcmail.com | fortunamining.com | X | LinkedIn | YouTube | Instagram | TikTok
Imperial Metals Corporation (TSX:III) reports copper and gold p... READ MORE
Aldebaran Resources Inc. (TSX-V: ALDE) (OTCQX: ADBRF) and its maj... READ MORE
Nevada Sunrise Metals Corporation (TSX-V: NEV) (OTC Pink: NVSGF)... READ MORE
Newmont Corporation (NYSE: NEM) (ASX: NEM) (PNGX: NEM) announced ... READ MORE
Scorpio Gold Corporation (TSX-V: SGN) (OTCQB: SRCRF) (FSE: RY9) i... READ MORE


