







The PEA establishes Aurora as a Large-Scale, Long-Life Copper-Molybdenum Asset; Deliberate Phased Development Approach Designed to Maximize Returns on Initial Capital and Preserve Potential Multi-Phase Underground Expansion
Highlights
DLP Resources Inc. (TSX-V: DLP) (OTCQB: DLPRF) (FSE: J8C) is pleased to announce the results of a Preliminary Economic Assessment for its 100%-owned Aurora Copper-Molybdenum-Silver Project, located 60 km northeast of Cusco, Peru. The PEA was prepared in accordance with National Instrument 43-101 by Global Resource Engineering Ltd. Ausenco Engineering Canada ULC and SRK Consulting (Canada) Inc. and incorporates an updated Mineral Resource Estimate. The Company will also be hosting a live webcast regarding the PEA, featuring DLP’s CEO Ian Gendall and the Technical Committee on September 1, 2026 at 1:00 pm (Toronto time). Participants can register to attend at the following link:
https://zoom.us/webinar/register/WN_G1PhTuayTEeIomxTV5irOg
“The results of the Aurora PEA confirm what our geological and technical work has long suggested: this is a copper-molybdenum-silver deposit with the scale, grade and production profile to support compelling development pathway. The PEA demonstrates robust cashflows, competitive operating costs, reasonable capital costs and robust financial returns, including an after-tax NPV8% of $2,703 million and an 18.5% IRR with substantial upside leverage to rising copper and molybdenum prices. Importantly, this PEA represents only the first chapter of the Aurora story, reflecting 402.9 million tonnes of mineralized material, or approximately 30% of the MRE, which shows an Indicated resource of 614.84 million tonnes at 0.19% Cu, 0.06% Mo and 2.09 g/t Ag and an Inferred resource of 1,118.80 million tonnes at 0.18% Cu, 0.07% Mo and 1.95 g/t Ag. As such, a significant portion of the MRE has not been included in the PEA, preserving future underground expansion optionality beyond what is contemplated within this initial 17.5-year mine plan. We intend to advance Aurora towards pre-feasibility while simultaneously scoping the underground expansion optionality and look forward to engaging with strategic partners on this multi-phase development program,” commented Ian Gendall, CEO of DLP.
Project Overview
The 100%-owned Aurora spans 12,500 hectares in Peru’s Cusco province, with easy road access and power infrastructure nearby. On June 22, 2026, DLP announced that the local Parobamba Community, where Aurora is located, approved a six-year extension of the land use and exploration agreement, demonstrating the strong, collaborative relationship DLP has built with the local community and providing the Company with the long-term access and social license to advance the project through its next stages of development.
The PEA represents an initial development case for Aurora, deliberately designed to maximize after-tax returns and capital efficiency on initial invested capital. The PEA mine plan encompasses 402.9 million tonnes of mineralized material, representing approximately 30% of Aurora’s MRE, concentrating the initial 17.5-year mine plan on the highest-confidence, highest-value portions of the deposit accessible by open pit and underground mining methods. The resources outside of the mine plan define a clear expansion opportunity. As such, the Company intends to advance an infill and extensional drill program at Aurora to advance resource classification and support incorporation of material outside of the mine plan into subsequent Prefeasibility or Feasibility studies. Management views this PEA as an initial Phase 1, providing a foundation for a long-term, multi-decade mining district, with today’s mine plan representing the first of several possible development phases. The PEA establishes Aurora as one of Peru’s emerging copper-molybdenum-silver development assets, with a project profile characterized by a long-life, high-value molybdenum production base alongside meaningful copper and silver co-production.
The Company notes the PEA is preliminary in nature and there is no certainty that the PEA will be realized. The PEA includes Inferred Mineral Resources that are considered too speculative geologically to have economic considerations applied to them that would enable them to be categorized as mineral reserves. Mineral Resources that are not Mineral Reserves do not have demonstrated economic viability. The Company also notes that a multi-phase underground development scenario has not been evaluated in the current PEA, no economic analysis has been applied to potential additional resources, and there is no certainty that any multi-phase underground expansion would be realized. DLP views the multi-phase underground expansion opportunity as a significant source of longer-term value not captured in the PEA economics and intends to advance dedicated multi-phase underground scoping work as a priority workstream.
Table 1) PEA Economic Summary
| Metric | Unit | Base Case |
| Base Case After-Tax Economics | ||
| NPV8% | $M | 2,703 |
| After-Tax IRR | % | 18.5 |
| Payback Period | years | 5.2 |
| NPV / Initial CAPEX | ratio | 1.14 |
| Pricing Assumptions | ||
| Copper | $/lb | 4.90 |
| Molybdenum | $/lb | 25.40 |
| Silver | $/oz | 45.30 |
| LOM Gross Revenue Contribution | ||
| LOM Revenue | $M | 26,072 |
| Copper | % | 30.6 |
| Molybdenum | % | 65.6 |
| Silver | % | 3.8 |
| Mining Metrics | ||
| Mine Life | Years | 17.5 |
| OP Mineralized Material | Mt | 237.3 |
| OP Strip Ratio | w:o | 0.95 |
| OP Copper Grade (LOM) | % | 0.33 |
| OP Molybdenum Grade (LOM) | % | 0.01 |
| OP Silver Grade (LOM) | g/t | 3.52 |
| UG Mineralized Material (LOM) | Mt | 165.6 |
| UG Copper Grade (LOM) | % | 0.07 |
| UG Molybdenum Grade (LOM) | % | 0.20 |
| UG Molybdenum Grade (Peak – Year 10) | % | 0.25 |
| UG Silver Grade (LOM) | g/t | 0.72 |
| Processing Metrics | ||
| Mineralized Material Milled | Mt | 402.9 |
| Copper grade (LOM) | % | 0.22 |
| Copper grade (years 1-6) | % | 0.30 |
| Molybdenum grade (LOM) | % | 0.09 |
| Molybdenum grade (years 7-14) | % | 0.14 |
| Silver grade (LOM) | g/t | 2.37 |
| Copper recovery | % | 85.50 |
| Molybdenum recovery | % | 88.50 |
| Silver recovery | % | 74.00 |
| Payable Copper (Annual) | Million pounds per year | 90.5 |
| Payable Copper (LOM) | Million pounds | 1,629 |
| Payable Molybdenum (Annual) | Million pounds per year | 37.4 |
| Payable Molybdenum (LOM) | Million pounds | 673 |
| Payable Silver (Annual) | Million ounces per year | 1.21 |
| Payable Silver (LOM) | Million ounces | 21.8 |
| Payable Copper Equivalent (Annual) | Million pounds | 301.0 |
| Payable Copper Equivalent (LOM) | Million pounds | 5,418 |
| Cost Metrics | ||
| Initial Capital Cost | $M | 2,377 |
| Sustaining + UG Development Capital | $M | 1,160 |
| Closure & Reclamation | $M | 121 |
Mining Methods
The mine plan consists of two principal mining methods: a conventional truck-and-shovel open pit operation to year 4 of the mine life (including stockpiling mineralized material), followed by underground mining of the higher-grade molybdenum core between years 3 and 17. Underground mineralized material will be processed alongside stockpiled open pit material.
Open Pit Mining (Years -3 to 4)
The open pit mine plan is based on a conventional truck-and-shovel operation producing a total of 237.3 million tonnes of mineralized material at a design throughput of 65,000 tonnes per day. The open pit strip ratio of 0.95:1 (waste:mineralized material) reflects the favorable geometry and continuity of the near-surface mineralized body. The open pit mine plan will see average mined grades of 0.33% copper, 0.01% molybdenum and 3.52 g/t silver.
Underground Mining (Years 3 to 17)
Following completion of open pit mining, operations transition to underground extraction of the higher-grade molybdenum-enriched core of the Aurora deposit. Underground development commences simultaneously with the opening of the open pit mine, using a block cave mining method, with level access established during late open pit years. The underground mine plan will see 165.6 million tonnes mined at an average molybdenum grade of 0.20% Mo, positioning Aurora as a robust, high grade molybdenum project.
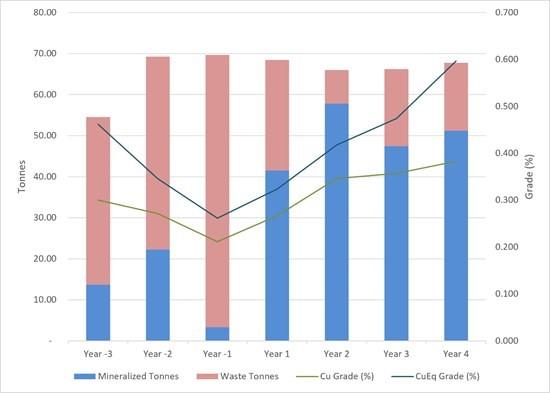
Figure 1) Open Pit Mine Production
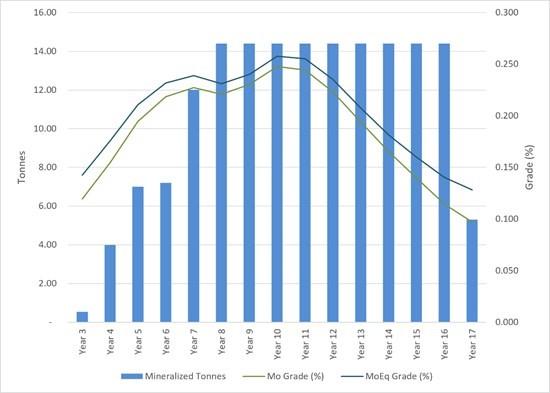
Figure 2) Underground Cave Production
Updated Mineral Resource Estimate
In connection with the PEA, an updated MRE has been completed for the Aurora deposit by Terre Lane of Global Resource Engineering, an independent Qualified Person as defined by NI 43-101. The MRE has an effective date of April 30, 2026. The updated MRE incorporates data from 28 drill holes totaling 22,613.38 metres and reflects revised geological modelling, updated metallurgical recovery assumptions, and the incorporation of recent infill drilling results.
The MRE is classified in accordance with the 2014 CIM Definition Standards on Mineral Resources and Reserves and was estimated in accordance with the CIM 2019 Best Practices Guidelines. The resource has been constrained by an open pit shell (OP domain) or by a conceptual underground extraction envelope (UG domain) demonstrating reasonable prospects for eventual economic extraction.
Table 2) Updated Mineral Resource Estimate (effective April 30, 2026)
| Classification | Tonnes (Mt) | Cu (%) | Mo (%) | Ag (g/t) | CuEq (%) | CuEq (Mlbs) |
| Open Pit (NSR Cut-off: $6.9/t) | ||||||
| Indicated | 382.58 | 0.24 | 0.020 | 2.55 | 0.37 | 3,118.21 |
| Inferred | 537.86 | 0.25 | 0.023 | 2.96 | 0.40 | 4,737.91 |
| Underground (NSR Cut-off: $25/t) | ||||||
| Indicated | 232.27 | 0.12 | 0.134 | 1.32 | 0.86 | 4,379.31 |
| Inferred | 580.94 | 0.11 | 0.117 | 1.02 | 0.74 | 9,527.32 |
| Total | ||||||
| Indicated | 614.84 | 0.19 | 0.06 | 2.09 | 0.55 | 7,497.53 |
| Inferred | 1,118.80 | 0.18 | 0.07 | 1.95 | 0.58 | 14,265.23 |
|
Notes: CuEq(lb) = Cu(lb)+Mo(lb)*((Mo Price*Mo Recovery*Mo Payability)/(Cu Price*Cu Recovery*Cu Payability))+Ag(lb)*((Ag Price*Ag Recovery*Ag Payability)/(Cu Price*Cu Recovery*Cu Payability)), using $4.90/lb Cu, $25.40/lb Mo, $45.30/oz Ag, 85.5% Cu recovery, 88.5% Mo recovery, 74% Ag recovery, 96.5% Cu payability, 96% Mo payability, 96% Ag payability (2) Cut-off grades: OP domain US$6.9/t NSR; UG domain US$25/t NSR. (3) Mineral Resources that are not Mineral Reserves do not have demonstrated economic viability. (4) Numbers may not sum due to rounding. |
||||||
QP Disclosure
The geological setting, mineralization, deposit characterization, exploration, drilling, sampling, analytical information, and data verification were prepared under the direction of Hamid Samari, Ph.D., QP, Principal Geologist at GRE. Dr. Samari meets the requirements for a QP as set out in his Certificate of Qualified Person.
Dr. Samari reviewed and verified the data supporting the Mineral Resource Estimate, including the geological and drillhole database, sampling information, analytical data, QA/QC results, and supporting documentation. As part of the data verification, Dr. Samari conducted a site visit to the Aurora Project on June 2-3, 2026, during which he reviewed the project geology, drill core, core logging and sampling procedures, and other relevant geological information. Independent check samples were collected and submitted for laboratory analysis. The copper (Cu), silver (Ag), and molybdenum (Mo) assay results obtained from the independent check samples were compared with the corresponding assay results reported in the project database. The comparison showed reasonable agreement between the two sets of results and provided additional verification of the analytical data supporting the Mineral Resource Estimate. Based on these verification procedures, Dr. Samari considers the data and information used to support the Mineral Resource Estimate to be sufficiently reliable for this purpose. No material limitations on the verification process or material failures to verify the data were identified.
Processing & Metallurgy
The Aurora PEA contemplates a conventional milling and froth flotation process plant designed to treat 65,000 tonnes of mineralized material per day. The process plant is designed to produce a copper concentrate grading approximately 25% Cu and a molybdenum concentrate grading approximately 55% Mo.
Metal recoveries to concentrate average 85.5% for copper, 88.5% for molybdenum, and 74.0% for silver. Silver reports to the copper concentrate as a by-product credit. The recoveries take into account mineralized material from various zones and the blending of various zones to feed the plant. Payable metal assumptions applied in the economic analysis reflect smelter and refinery terms of 96.5% payability for copper and 96.0% payability for molybdenum and silver.
Tailings from the flotation circuit will be filtered and placed in a drystack tailings facility and managed in accordance with applicable Peruvian regulatory requirements, including the standards established under the Environmental Impact Assessment (EIA-d) process overseen by Peru’s Ministry of Energy and Mines (MINEM). The Company is evaluating tailings storage facility design options as part of ongoing engineering studies.
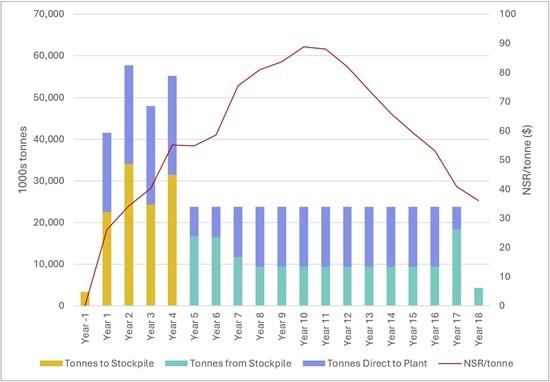
Figure 3) Processing Schedule
Capital & Operating Costs
Initial capital is estimated at $2,377 million over a 3-year construction period, and is based on the costs outlined in Table 3, below:
Table 3) Breakdown of Initial Capital
| Initial Capital Expenditure | Cost ($M) |
| Mine (OP) | 530.9 |
| Mine (UG) | 202.4 |
| Plant | 502.1 |
| Tailings | 332.1 |
| Infrastructure | 219.1 |
| Indirects | 137.6 |
| Permitting | 4.0 |
| Owner’s costs | 76.5 |
| Contingency | 372.3 |
| Total | 2,377 |
Sustaining and underground development capital over the life of mine (through year 20) is estimated at $1,160 million, with total closure costs estimated at $121M.
Working capital of $24.7 million in year 1.
Operating costs are estimated at $13.05/t processed based on the costs outlined in Table 4, below.
Table 4) Breakdown of Operating Costs
| Operating Cost | Cost ($/t mined)1 | Cost ($/t milled)2 |
| Mining (OP) | 1.72 | 1.08 |
| Mining (UG) | 6.90 | 2.35 |
| Processing | 5.19 | |
| Rehandling | 0.32 | |
| Tailings | 1.78 | |
| Water treatment | 0.07 | |
| G&A | 1.07 | |
| Contingency | 1.19 | |
| Total | 13.05* | |
| 1 Total mine operating costs per tonne mined, including pre-production mining costs 2 Operating costs less capitalized pre-production mining costs per total tonnes milled |
||
Life of Mine C1 cash costs are calculated on a co-product basis: $0.90/lb copper; $7.83/lb molybdenum. Stockpiled material costs (during the pre-production period) have been excluded from the C1 cash cost and included in the pre-production capital cost.
Economic Analysis Results
The PEA highlights an after-tax NPV8% of $2,703 million corresponding to an IRR of 18.5% and a 5.2-year payback period. Assumptions, including commodity pricing used as part of the economic analysis is outlined in Table 6 below:
Table 5) Commodity Price Assumptions
| Pricing Assumptions | ||
| Copper | $/lb | 4.90 |
| Molybdenum | $/lb | 25.40 |
| Silver | $/oz | 45.30 |
Table 6) Sensitivity to Copper and Molybdenum Prices, Capital Cost and Operating Cost
| Copper Price Sensitivity | |||
| -25% | Base Case | +25% | |
| After-Tax NPV8% | $2,101 | $2,703 | $3,286 |
| IRR | 16.0% | 18.5% | 20.8% |
| Payback | 6.2 | 5.2 | 4.4 |
| NPV to Initial Capex | 0.88 | 1.14 | 1.38 |
| Molybdenum Price Sensitivity | |||
| -25% | Base Case | +25% | |
| After-Tax NPV8% | $1,745 | $2,703 | $3,656 |
| IRR | 15.5% | 18.5% | 20.9% |
| Payback | 5.8 | 5.2 | 4.8 |
| NPV to Initial Capex | 0.73 | 1.14 | 1.54 |
| Base Case vs. Spot Pricing | ||
| Base Case | Spot* | |
| After-Tax NPV8% | $2,703 | $4,812 |
| IRR | 18.5% | 24.9% |
| Payback | 5.2 | 3.8 |
| NPV to Initial Capex | 1.14 | 2.02 |
| *Spot pricing as of Aug 26, 2026: Copper – $6.47/lb; Molybdenum – $33.57/lb; Silver – $68.50/oz.
|
||
| Capital Cost Sensitivity | |||
| -25% | Base Case | +25% | |
| After-Tax NPV8% | $3,422 | $2,703 | $1,988 |
| IRR | 23.8% | 18.5% | 14.7% |
| Operating Cost Sensitivity | |||
| -25% | Base Case | +25% | |
| After-Tax NPV8% | $3,136 | $2,703 | $2,263 |
| IRR | 20.5% | 18.5% | 16.5% |
Infrastructure & Site Layout
The site layout incorporates the process plant, tailings and waste management facilities, camp infrastructure, and water management systems within a consolidated footprint designed to support efficiency. Tailings are planned to be managed in a dry stack tailings facility (DSTF) and potential acid generating (PAG) waste rock storage facility (WRSF), utilizing favourable topographic conditions adjacent to the process plant site. The tailings and waste management facilities have been designed and sited with the long-term development potential of the Aurora deposit in mind, and the selected footprint provides a foundation from which future expansion capacity could be developed as the project advances. The Company will continue to refine site layout and infrastructure design as it advances Aurora toward a Pre-Feasibility Study.
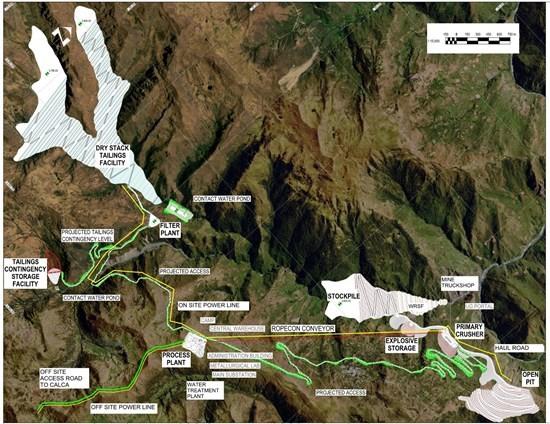
Figure 4) Site Layout
Opportunities
The PEA mine plan has been deliberately designed to deliver the optimal after-tax return on initial invested capital. By focusing the first phase of development on the highest-value portions of the Aurora deposit, the Company has structured the mine plan as a compelling, financeable standalone project while simultaneously preserving the potential for future phases to capture the full resource potential of the Aurora deposit.
This disciplined, phased development philosophy is consistent with practices adopted at analogous large-scale porphyry copper-molybdenum development projects. DLP believes this approach at Aurora appropriately sequences capital deployment to maximize shareholder value at each stage of development.
Multi-phase Expansion Potential
Aurora’s envisioned mine plan is contemplated as an approximate 30% subset of the Indicated and Inferred MRE. DLP views the resources outside of the mine plan, together with additional exploration targets as the natural foundation for multi-phase underground expansion, which the Company expects to advance through dedicated infill and conversion drilling and scoping studies in parallel with PFS activities. Subject to resource conversion, engineering studies, and regulatory approvals, a multi-phase development scenario has the potential to materially extend Aurora’s mine life and increase annual production rates beyond the current Phase 1 PEA.
As illustrated in Figure 5, mineralization at Aurora extends well beyond the boundaries of the Phase 1 mine plan, with the deposit remaining open to the west, east, and at depth. The current MRE boundaries are defined by drilling extent rather than geological limits, and all mineralized zones shown in the section, including lower-grade material at the margins, carry positive economic margins above projected operating costs.
A key feature of Aurora’s long-term value proposition is the infrastructure leverage inherent in a phased development approach. The 65,000 tonne-per-day processing facility constructed under the Phase 1 capital program represents the single largest infrastructure investment required to bring the project into production. Advancing a potential Phase 2 underground expansion would require a materially lower incremental capital outlay, concentrated primarily on underground development and a new dry-stack tailings facility, while utilizing the processing infrastructure already in place. DLP intends to advance an infill and extensional drilling program to further define Aurora’s resource base and support economic evaluation of a future Phase 2 expansion, with Phase 2 scoping work expected to advance in parallel with ongoing Phase 1 development studies.
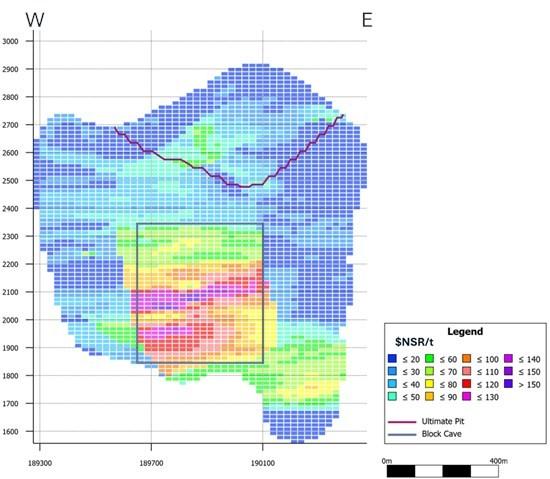
Figure 5) Aurora Deposit Cross Section – NSR/tonne ($)
A NI 43-101 Technical Report will be filed on SEDAR+ within 45 days of this news release.
Next Steps
The positive PEA results provide a strong technical and economic foundation for Aurora’s advancement. DLP Resources intends to take the following steps:
Qualified Persons
Mr. Gendall, CEO & President of the company is the qualified person as defined by National Instrument 43-101. Mr. Gendall has reviewed and approved the technical contents of this news release.
The following people are intendent qualified persons for the technical report and have reviewed and verified the disclosure in this news release against the information in the technical report they are responsible for:
About DLP Resources Inc.
DLP Resources Inc. is a copper-focused development company advancing two 100%-owned projects in southern Peru: Aurora and Esperanza.
Aurora is a large-scale porphyry copper-molybdenum-silver deposit containing a combined open pit and underground indicated resource of 614.84 million tonnes at 0.19% Cu, 0.06% Mo and 2.09 g/t Ag, and an inferred resource of 1,118.80 million tonnes at 0.18% Cu, 0.07% Mo and 1.95 g/t Ag. An independent Preliminary Economic Assessment completed in September 2026 established an after-tax NPV8% of US$2,703 million and an IRR of 18.5%, based on a 17.5-year mine life utilizing open pit and underground mining methods. Aurora’s robust production profile contemplates payable production of 90.5 million pounds per year of copper, 37.4 million pounds per year of molybdenum and 1.21 million ounces per year of silver.
Esperanza is an emerging district-scale copper-gold discovery located 35km from Cerro Verde, one of the world’s largest copper mines. A 5.0km × 2.5km magnetic anomaly is supported by high-grade surface and trench sampling results, with a maiden drill programme planned for Q3 2026.
Brutus Mining Inc. (CSE: BRU) (FSE: ZI3) is pleased to announce that it has closed its non-brokered ... READ MORE
Jaguar Uranium Corp. (NYSE American: JAGU) is pleased to announce an independent Mineral Resource E... READ MORE
Auro Metals Inc. (TSX-V: AURO) (OTCQB: AURFF), is pleased to announce the assay results of the fina... READ MORE
Endeavour Silver Corp. (NYSE: EXK) (TSX: EDR) is pleased to announce that repairs to the primary bal... READ MORE
Scorpio Gold Corp. (NASDAQ: SGLD) (TSX-V: SGLD) (OTCQB: SRCRF) (FSE: RY9) is pleased to announce re... READ MORE


