


Discovery Silver Corp. (TSX-V: DSV) (OTCQX: DSVSF) is pleased to announce results from its Preliminary Feasibility Study on its 100%-owned Cordero silver project located in Chihuahua State, Mexico. The PFS project team was led by Ausenco Engineering Canada Inc. with support from AGP Mining Consultants Inc. and Knight Piésold Ltd. Highlights include (all figures are in US$ unless otherwise noted):
Tony Makuch, CEO, states: “We are extremely pleased with the results from our Pre-Feasibility Study. The PFS positions Cordero uniquely in the silver developer space with a long mine life of 18 years and production averaging over 35 Moz AgEq in the first 12 years of the mine life. This represents an approximate 40% increase in total ounces produced compared to our 2021 PEA. Despite significant industry-wide cost escalation over the last year, cost savings from a streamlined process design and improved metallurgical performance have resulted in a highly capital efficient project with excellent margins.
“The Study also outlines the significant economic contribution the Project will have through employment, taxes and the purchases of local goods and services in the Municipality of Parral, in Chihuahua State and in Mexico. We now look forward to advancing the Project toward a Feasibility Study and surfacing additional value through numerous optimization opportunities we have already identified.”
PRE-FEASIBILITY STUDY SUMMARY
Project Economics
The economics for the PFS were based on the following metal prices: Ag – $22.00/oz, Au – $1,600/oz, Pb – $1.00/lb and Zn – $1.20/lb. Sensitivity of the Project’s expected after-tax NPV, IRR and payback at different commodity price assumptions is outlined in the table below:
| Units | Base Case | Spot Price | Base Case +15% |
Base Case -15% |
|
| After-Tax NPV (5% discount rate) | (US$ M) | $1,153 | $1,723 | $1,797 | $508 |
| Internal Rate of Return | (%) | 28.0% | 35.9% | 37.5% | 16.9% |
| Payback | (yrs) | 4.2 | 3.4 | 3.2 | 6.0 |
Production & Costs
Annual production over the life-of-mine is expected to average 33 Moz AgEq. In Years 5 – Year 12 production averages 40 Moz AgEq with peak production in Year 11 of 52 Moz AgEq. These production levels position Cordero as one of the largest primary silver mines globally.
All-In Sustaining Costs average $12.80/oz AgEq in Year 1 – Year 12 and $13.62/oz AgEq over the LOM. This represents an approximate increase of 10% versus the PEA. This increase is primarily due to higher treatment and refining charges and industry wide cost escalation including higher assumed prices for consumables, diesel ($1.10/L vs $1.00/L in PEA) and power ($0.068/kWh vs $0.062/kWh). These increases were offset to a large extent by cost reductions from lower reagent consumptions and unit cost reductions attributable to higher throughput rates in the PFS compared to the PEA.
A summary of AgEq production and AISC is provided in the table below. A breakdown of the production proportions of each individual metal and AISC over the LOM is provided in the graph below the table.
| Units | Year 1 – 4 | Year 5 – 12 | Year 13 -18 | LOM | |
| AgEq Produced – Average/yr | (Moz) | 30 | 40 | 25 | 33 |
| AgEq Payable – Average/yr | (Moz) | 25 | 34 | 21 | 27 |
| AgEq Produced – Total | (Moz) | 118 | 322 | 151 | 591 |
| AgEq Payable – Total | (Moz) | 102 | 268 | 124 | 494 |
| All-In Sustaining Cost (AISC) | (US$/AgEq oz) | $12.29 | $12.99 | $16.05 | $13.62 |
Note – AgEq Produced is metal recovered in concentrate. AgEq Payable is metal payable from concentrate and incorporates metal payment terms outlined in the Concentrate Terms section below. AgEq is calculated as Ag + (Au x 72.7) + (Pb x 45.5) + (Zn x 54.6); these factors are based on metal prices of Ag – $22/oz, Au – $1,600/oz, Pb – $1.00/lb and Zn – $1.20/lb. AISC is a non-GAAP measure; refer to the Non-GAAP Measures section of the release for further information on this measure. See Technical Disclosure section for AISC calculation methodology.
LOM Production & AISC
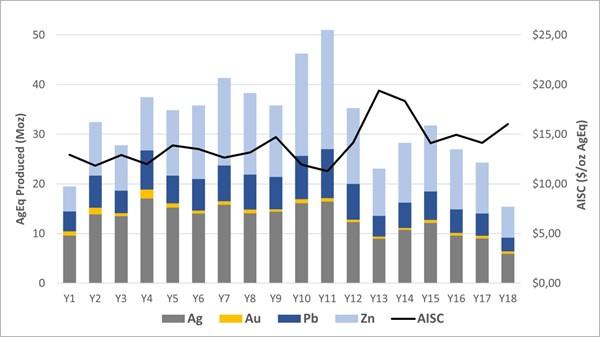
Note – Au/Pb/Zn production is shown on an AgEq basis based on: Ag = $22/oz, Au = $1,600/oz, Pb = $1.00/lb and Zn = $1.20/lb
2023 PFS vs 2021 PEA Summary
The PFS incorporates numerous significant positive developments in comparison to the PEA. Based on drilling success at depth and in the northeast of the deposit the size of the open pit has increased by over 30% and the strip ratio has improved to 2.1:1. This additional drilling has also significantly increased the confidence level of the underlying resource with the PFS supported by Reserves of which 54% are in the Proven category.
The PFS incorporates throughput rates of 25,500 tpd in Phase 1 and 51,000 tpd in Phase 2, ~25% higher than the PEA. This has resulted in average annual production increasing by 27% over an extended mine life of 18 years. The process design has been streamlined based on the excellent results from the 2022 metallurgical testwork program with the co-processing of oxides and sulphides via flotation allowing for the elimination of the heap leach circuit.
The payback period has increased to 4.2 years. This is due to the delay in processing oxide material from eliminating the heap leach and given the mill expansion occurs in Year 3 of the mine life (deferral of the expansion would reduce the payback period to 3.0 years). The payback period has been significantly de-risked with more than 70% of the mill feed in Years 1 to Year 5 in the Proven category and the removal of the elevated risk typically associated with heap leach ramp ups.
Initial capital increased by 24% to $455 M. This was primarily due to the 25% increase in the initial size of the plant, a switch to owner-operated mining (assuming lease finance of mine equipment) driven by the growth in size of the open pit (the PEA assumed contractor mining) and cost inflation.
| PARAMETER | UNITS | 2023 PFS | 2021 PEA |
| SUMMARY | |||
| After-Tax NPV (5% discount rate) | (US$ M) | $1,153 | $1,160 |
| Internal Rate of Return | (%) | 28.0% | 38.2% |
| Mine Life | (yrs) | 18 | 16 |
| Initial Capital | (US$ M) | $455 | $368 |
| Payback | (yrs) | 4.2 | 2.0 |
| OPERATIONS | |||
| Tonnes Processed (LOM – Total) | (Mt) | 302 | 228 |
| Strip ratio (LOM) | (w:o) | 2.1 | 2.2 |
| PRODUCTION & COSTS | |||
| AgEq Produced (LOM – Annual Average) | (Moz) | 33 | 26 |
| AgEq Produced (LOM – Total) | (Moz) | 591 | 426 |
| All-In Sustaining Cost (Y1 – Y12) | (US$/AgEq oz) | $12.82 | $11.73 |
| All-In Sustaining Cost (LOM) | (US$/AgEq oz) | $13.62 | $12.35 |
Project Economics are based on Ag = $22.00/oz, Au = $1,600/oz, Pb = $1.00/lb, Zn = $1.20/lb. See Technical Disclosure section for AgEq and AISC calculation methodology.
Feasibility Study Opportunities
The Feasibility Study is already being advanced and is expected to be completed in 1Q 2024. Key areas for optimization in the FS include:
Resource Update
In conjunction with the PFS, the Mineral Resource Estimate for Cordero has been updated to incorporate an additional 67,800 m of drilling (total drilling of 287,400 m in 706 drill holes). The Measured & Indicated Resource has grown by 35% to 1,132 Moz AgEq and the Inferred Resource has grown by 40% to 119 Moz AgEq as summarized below. This resource expansion has largely been driven by exploration success at depth and in the northeast part of the deposit.
Mineral resources that are not mineral reserves do not have demonstrated economic viability. Further details on the Resource including all supporting technical disclosure is outlined in Appendix A.
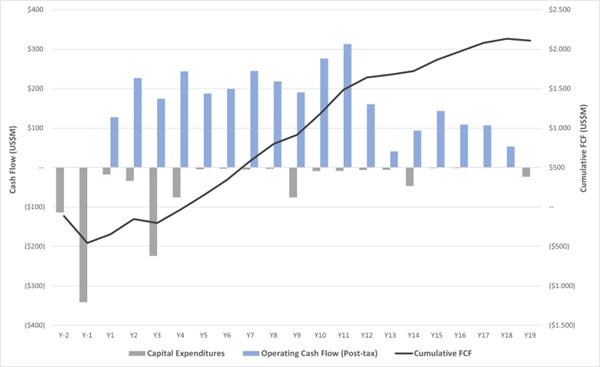
CAPITAL EXPENDITURES
Cordero is a highly capital-efficient project due to numerous underlying advantages:
Initial Capital (to achieve plant throughput of 9.3 Mt/a)
Initial capital to build Cordero Phase 1 is estimated to total $455 million and will be incurred over a two-year construction period. This capital estimate includes the construction of on-site infrastructure, power transmission line, Phase 1 of the process plant with nameplate capacity of 9.3 Mt/a (25,500 tpd), all pre-stripping activities and construction of the TSF including the initial starter dam embankment providing 2 years of tailings storage.
Contingency for the initial capital estimate typically ranges from 15% to 20% (depending on cost type) and is applied to direct and indirect costs. Owners costs represent 5% of direct costs. Indirect costs represent 23% of direct costs. These proportions are in-line with typical industry averages and are consistent with a cost base for a project build in Mexico and commensurate with the level of complexity of the project build.
Expansion Capital (to expand plant to 18.6 Mt/a)
The processing facility will be expanded to a nameplate capacity of 18.6 Mtpa (51,000 tpd) in Year 3 and Year 4 at an estimated cost of $290 million. This expansion includes the addition of parallel grinding and flotation circuits, additional on-site infrastructure and a major tailings dam lift that is concurrent with plant expansion.
An expansion of the flotation circuit is planned for Year 9 at a cost of $31 million. This includes the addition of cleaner flotation cells, a filter and a thickener to accommodate the higher zinc grades in Year 10 and Year 11.
Sustaining Capital
Sustaining capital over the LOM totals $228 million (includes closure costs net of salvage). This includes $106 million to be spent on tailings management facility expansions, with the remainder to be spent on mine equipment, the process plant, mobile equipment and replacements/refurbishments of infrastructure assets. Sustaining capex for the process plant has been classified as operating costs under the maintenance category. Sustaining capex for mining only includes down payments on replacement equipment with the remaining lease costs classified as mine operating costs.
| DESCRIPTION (all in US$ millions) | INITIAL CAPITAL | EXPANSION CAPITAL | SUSTAINING LOM CAPEX |
TOTAL LOM CAPEX |
|||
| Year -2 | Year -1 | Year 3/4 | Year 9 | ||||
| CAPITAL EXPENDITURES | |||||||
| Mining | $18 | $52 | $3 | – | $67 | $140 | |
| Infrastructure | $8 | $23 | $12 | – | $22 | $65 | |
| Processing Plant | $39 | $117 | $114 | $14 | – | $284 | |
| Tailings Facility (TSF) | $11 | $34 | $40 | – | $106 | $191 | |
| Offsite Infrastructure | $5 | $15 | $35 | – | – | $55 | |
| Indirects | $15 | $44 | $39 | $11 | – | $109 | |
| Owners Costs | $3 | $10 | $3 | $1 | – | $17 | |
| Closure (net of Salvage Value) | – | – | – | – | $24 | $24 | |
| Contingency | $15 | $46 | $43 | $5 | $9 | $118 | |
| Capital Expenditures – Subtotals | $114 | $341 | $289 | $31 | $228 | $1,003 | |
| $455 | |||||||
OPERATIONS
Mining
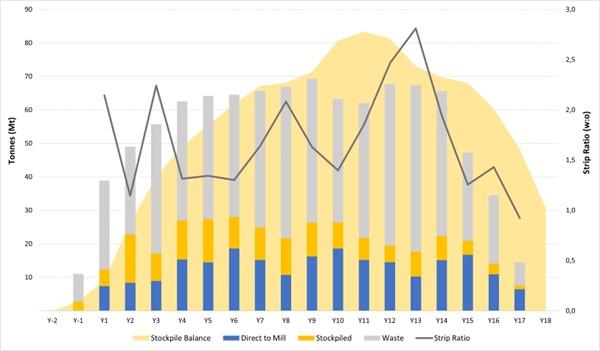
The mine plan incorporates accelerated stripping as well as stockpiling of low-grade material in order to optimize the grade profile over the LOM.
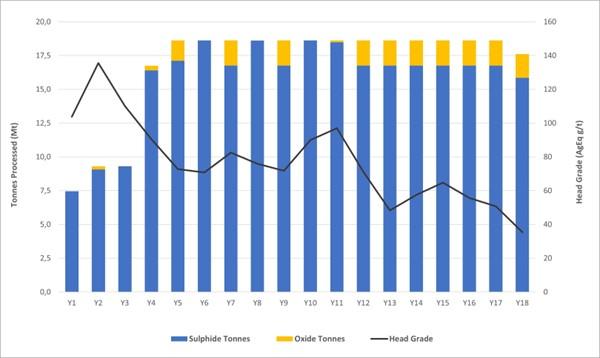
Processing
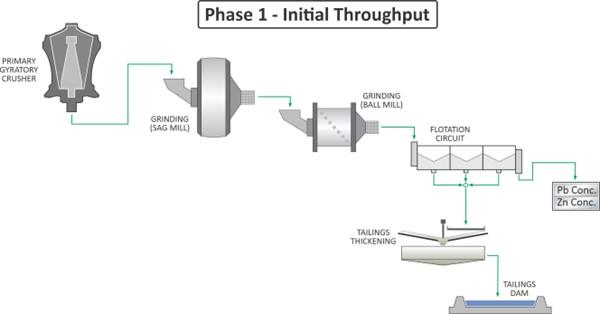
Processing was broken into two main phases to optimize the capital efficiency of the project. Oxides and sulphides are co-processed up to a maximum oxide tonne proportion of 10% of total mill feed.
– Phase 1: primary crushing, grinding (SAG and ball milling to a targeted grind size of 200 micron) and two-stage flotation to produce Pb and Zn concentrates.
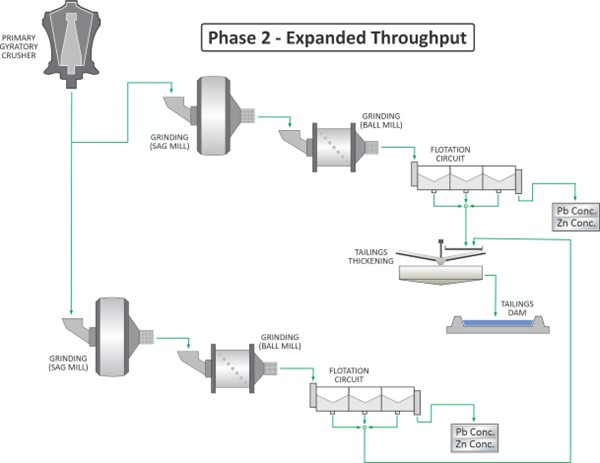
– Phase 2: addition of parallel grinding and flotation circuits to produce Pb and Zn concentrates.
Head grades
The mine plan focuses on feeding higher grades to the mill earlier in the mine life:
| TONNES PROCESSED / HEAD GRADES |
UNIT | PHASE 1 | PHASE 2 | LOM | |
| Year 1 – 4 | Year 5 – 12 | Year 13 – 18 | |||
| Oxide tonnes processed | (Mt) | 1 | 7 | 11 | 19 |
| Sulphide tonnes processed | (Mt) | 42 | 142 | 100 | 283 |
| Tonnes processed | (Mt) | 43 | 149 | 111 | 302 |
| Head Grades | |||||
| Ag | (g/t) | 46 | 29 | 19 | 27 |
| Au | (g/t) | 0.20 | 0.07 | 0.05 | 0.08 |
| Pb | (%) | 0.65% | 0.48% | 0.31% | 0.44 |
| Zn | (%) | 0.78% | 0.75% | 0.66% | 0.70 |
| AgEq | (g/t) | 110 | 79 | 52 | 73 |
Recoveries
Metal recoveries to the two concentrates based on the projected oxide-sulphide blends from the mine plan are summarized below:
| METALLURGICAL RECOVERIES (weighted average) | PHASE 1 | PHASE 2 | LOM | |
| Year 1 – 4 | Year 5 – 12 | Year 13 – 18 | ||
| Ag | 90% | 87% | 82% | 87% |
| Au | 22% | 22% | 22% | 22% |
| Pb | 89% | 87% | 83% | 86% |
| Zn | 86% | 86% | 84% | 85% |
Tailings Storage Facility
The TSF design was completed by Knight Piésold and is based on deposition of high-density thickened tailings into a tailings storage facility that utilizes the ‘downstream expansion’ embankment construction method.
OPERATING COST
Operating costs are summarized in the table below.
| PARAMETER | UNITS | PFS COST | PEA COST |
| OPERATING COSTS | |||
| Mining | $/t mined | $2.45 | $2.23 |
| Mining | $/t milled | $7.56 | $7.03 |
| Processing – Milling (Phase 1) | $/t milled | $6.46 | $7.01 |
| Processing – Milling (Phase 2) | $/t milled | $6.36 | $6.57 |
| Site G&A (Phase 2) | $/t milled | $0.57 | $0.86 |
Mining
Processing
G&A
CONCENTRATE TERMS
Metal Payable
| Ag | Au | Pb | Zn | |
| Pb Concentrate | ||||
| Average concentrate grade LOM | 2,650 g/t | 1.4 g/t | 52% | – |
| Payable metal | 95% | 95% | 95% | – |
| Minimum deduction | 50 g/t | 1 g/t | 3 units | – |
| Zn Concentrate | ||||
| Average concentrate grade LOM | 370 g/t | 0.7 g/t | – | 51% |
| Payable metal | 70% | 70% | – | 85% |
| Deduction | 3 oz/t | 1 g/t | – | – |
Treatment/Refining Charges
| PARAMETER | UNITS | PFS COST | 5-YEAR BENCHMARK AVERAGE |
| TREATMENT/REFINING CHARGES | |||
| Treatment charge – Pb concentrate | $/dmt | $130 | ~$130 |
| Treatment charge – Zn concentrate | $/dmt | $210 | ~$215 |
| Ag refining charge – Pb concentrate | $/oz | $1.20 | ~$1.05 |
Concentrate Transportation
TECHNICAL DISCLOSURE:
APPENDIX:
An appendix with the following supporting information can be found at the end of the release or the following link: Appendices
Appendix A – Mineral Resource Estimate
Appendix B – Mineral Reserve Estimate
Appendix C – After-Tax NPV/IRR/Payback Sensitivities
Appendix D – LOM Mine Plan Summary
Appendix E – LOM Process Throughput Summary
Appendix F – After-Tax Free Cash Flow
Appendix G – Simplified Process Flowsheets
Appendix H – Metallurgical Balance Summary
Appendix I – Site Layout
Appendix J – LOM Production & Cash Flow Schedule
About Discovery
Discovery’s flagship project is its 100%-owned Cordero project, one of the world’s largest silver deposits. The PFS summarized in today’s release demonstrates that Cordero has the potential to be developed into a highly capital efficient mine that offers the combination of margin, size and scalability. Cordero is located close to infrastructure in a prolific mining belt in Chihuahua State, Mexico. Continued exploration and project development at Cordero is supported by a strong balance sheet with cash of approximately C$45 million.
Qualified Person
The PFS for the Company’s Cordero project as summarized in this release was completed by Ausenco with support from by AGP and Knight Piésold. A full technical report supporting the PFS will be prepared in accordance with NI 43-101 and will be filed on SEDAR within 45 days of this press release. The most recent technical report for the Cordero Project is the 2021 Preliminary Economic Assessment (PEA). The PEA was completed by Ausenco Engineering Canada Inc. with support from AGP Mining Consultants Inc. and Knight Piésold and Co. (USA). The full technical report supporting the PEA is available on Discovery’s website and on SEDAR under Discovery Silver Corp. The scientific and technical content of this press release was reviewed and approved by Gernot Wober, Vice President Exploration for the Company, who is a “Qualified Person” as defined by National Instrument 43-101 – Standards of Disclosure for Mineral Projects.
APPENDIX A – MINERAL RESOURCE ESTIMATE
| Material | Class | Tonnes | Grade | Contained Metal | ||||||||
| Ag | Au | Pb | Zn | AgEq | Ag | Au | Pb | Zn | AgEq | |||
| (Mt) | (g/t) | (g/t) | (%) | (%) | (g/t) | (Moz) | (koz) | (Mlb) | (Mlb) | (Moz) | ||
| Oxide | Measured | 21 | 30 | 0.08 | 0.23 | 0.25 | 49 | 21 | 51 | 109 | 117 | 33 |
| Indicated | 42 | 24 | 0.06 | 0.24 | 0.31 | 46 | 33 | 85 | 224 | 288 | 62 | |
| M&I | 63 | 26 | 0.07 | 0.24 | 0.29 | 47 | 54 | 136 | 333 | 405 | 95 | |
| Inferred | 36 | 18 | 0.04 | 0.28 | 0.37 | 43 | 21 | 40 | 216 | 292 | 49 | |
| Sulphide | Measured | 250 | 23 | 0.08 | 0.33 | 0.57 | 55 | 185 | 604 | 1,824 | 3,132 | 439 |
| Indicated | 403 | 18 | 0.04 | 0.27 | 0.56 | 46 | 228 | 524 | 2,387 | 4,947 | 598 | |
| M&I | 653 | 20 | 0.05 | 0.29 | 0.56 | 49 | 413 | 1128 | 4,211 | 8,079 | 1037 | |
| Inferred | 109 | 13 | 0.02 | 0.21 | 0.38 | 33 | 46 | 82 | 510 | 923 | 118 | |
| TOTAL | Measured | 271 | 24 | 0.08 | 0.32 | 0.55 | 55 | 206 | 655 | 1,933 | 3,249 | 472 |
| Indicated | 445 | 19 | 0.04 | 0.27 | 0.54 | 46 | 261 | 609 | 2,611 | 5,235 | 660 | |
| M&I | 716 | 20 | 0.06 | 0.29 | 0.54 | 49 | 467 | 1,264 | 4,544 | 8,484 | 1,132 | |
| Inferred | 145 | 14 | 0.02 | 0.23 | 0.38 | 35 | 67 | 122 | 726 | 1,215 | 167 | |
Supporting Technical Disclosure for Resource
APPENDIX B – MINERAL RESERVE ESTIMATE
| Material | Class | Tonnes | Grade | Contained Metal | ||||||
| Ag | Au | Pb | Zn | Ag | Au | Pb | Zn | |||
| (Mt) | (g/t) | (g/t) | (%) | (%) | (Moz) | (Moz) | (Blb) | (Blb) | ||
| Oxide | Proven | 8 | 34 | 0.08 | 0.28 | 0.29 | 9 | 0.02 | 0.05 | 0.05 |
| Probable | 11 | 28 | 0.07 | 0.28 | 0.36 | 10 | 0.02 | 0.07 | 0.09 | |
| Total P&P | 19 | 31 | 0.07 | 0.28 | 0.33 | 19 | 0.04 | 0.12 | 0.14 | |
| Sulphide | Proven | 156 | 29 | 0.10 | 0.46 | 0.69 | 144 | 0.50 | 1.57 | 2.38 |
| Probable | 128 | 25 | 0.06 | 0.44 | 0.76 | 104 | 0.25 | 1.23 | 2.14 | |
| Total P&P | 284 | 27 | 0.08 | 0.45 | 0.72 | 248 | 0.75 | 2.79 | 4.52 | |
| TOTAL | Proven | 164 | 29 | 0.10 | 0.45 | 0.67 | 153 | 0.52 | 1.63 | 2.42 |
| Probable | 138 | 26 | 0.06 | 0.43 | 0.73 | 114 | 0.27 | 1.30 | 2.22 | |
| Total P&P | 302 | 27 | 0.08 | 0.44 | 0.70 | 266 | 0.79 | 2.94 | 4.65 | |
Supporting Technical Disclosure for Reserves
APPENDIX C: AFTER-TAX NPV / IRR / PAYBACK SENSITIVITIES
Sensitivity of the Project’s NPV, IRR and payback at different Ag and Zn price assumptions is outlined in the table below. For these sensitivities the Au and Pb prices have been fixed at $1,600/oz and $1.00/lb respectively. The Base Case scenario for the PEA is highlighted in grey below and assumes Ag – $22.00/oz, Au – $1,600/oz, Pb – $1.00/lb and Zn – $1.20/lb.
| Ag ($/oz) | ||||||||||||||||
| $18.00 | $20.00 | $22.00 | $25.00 | $30.00 | ||||||||||||
| NPV (5%) |
IRR | Payback | NPV (5%) |
IRR | Payback | NPV (5%) |
IRR | Payback | NPV (5%) |
IRR | Payback | NPV (5%) |
IRR | Payback | ||
| (US$M) | (%) | (yrs) | (US$M) | (%) | (yrs) | (US$M) | (%) | (yrs) | (US$M) | (%) | (yrs) | (US$M) | (%) | (yrs) | ||
| Zn ($/lb) | $1.05 | 638 | 19.3% | 5.5 | 798 | 22.3% | 5.0 | 958 | 25.2% | 4.5 | 1,198 | 29.3% | 3.9 | 1,599 | 36.0% | 3.3 |
| $1.10 | 703 | 20.3% | 5.4 | 863 | 23.3% | 4.8 | 1,023 | 26.1% | 4.4 | 1,263 | 30.2% | 3.9 | 1,664 | 36.8% | 3.2 | |
| $1.20 | 832 | 22.4% | 5.1 | 992 | 25.2% | 4.6 | 1,153 | 28.0% | 4.2 | 1,393 | 32.0% | 3.7 | 1,794 | 38.4% | 3.1 | |
| $1.30 | 962 | 24.3% | 4.8 | 1,122 | 27.1% | 4.3 | 1,282 | 29.7% | 4.0 | 1,523 | 33.7% | 3.6 | 1,923 | 40.0% | 3.0 | |
| $1.45 | 1,156 | 27.1% | 4.4 | 1,317 | 29.7% | 4.1 | 1,477 | 32.3% | 3.7 | 1,717 | 36.1% | 3.4 | 2,118 | 42.3% | 2.2 | |
APPENDIX D – LOM MINE PLAN SUMMARY
APPENDIX E – LOM PROCESS THROUGHPUT SUMMARY
APPENDIX F – AFTER-TAX FREE CASH FLOW
APPENDIX G – SIMPLIFIED PROCESS FLOWSHEETS
PHASE 1 (25,500 tpd nameplate capacity):
PHASE 2 (51,000 tpd nameplate capacity):
APPENDIX H – METALLURGICAL BALANCE SUMMARY
| UNITS | PHASE 1 | PHASE 2 | LOM | ||||||||||||||
| Years 1 – 4 | Years 5 – 12 | Years 13 – 18 | |||||||||||||||
| Ag | Au | Pb | Zn | Ag | Au | Pb | Zn | Ag | Au | Pb | Zn | Ag | Au | Pb | Zn | ||
| MET BALANCE | |||||||||||||||||
| Average head grade | g/t or % | 45 | 0.20 | 0.65 | 0.78 | 29 | 0.07 | 0.48 | 0.81 | 19 | 0.05 | 0.31 | 0.52 | 27 | 0.08 | 0.44 | 0.70 |
| Recovered to Pb Con | % | 77% | 13% | 89% | 6% | 71% | 13% | 87% | 7% | 61% | 13% | 82% | 7% | 71% | 13% | 86% | 7% |
| Recovered to Zn Con | % | 13% | 10% | 3% | 85% | 16% | 10% | 3% | 86% | 20% | 10% | 3% | 83% | 17% | 10% | 3% | 85% |
| Tailings | % | 10% | 77% | 8% | 9% | 13% | 77% | 10% | 7% | 19% | 77% | 15% | 10% | 12% | 77% | 11% | 8% |
| Total | % | 100% | 100% | 100% | 100% | 100% | 100% | 100% | 100% | 100% | 100% | 100% | 100% | 100% | 100% | 100% | 100% |
| CONCENTRATE GRADES | |||||||||||||||||
| Pb Concentrate | g/t or % | 3,546 | 2.57 | 58% | – | 2,643 | 1.15 | 53% | – | 2,129 | 1.17 | 45% | – | 2,650 | 1.42 | 52% | – |
| Zn Concentrate | g/t or % | 450 | 1.55 | – | 51% | 338 | 0.49 | – | 51% | 448 | 0.58 | – | 50% | 373 | 0.66 | – | 51% |
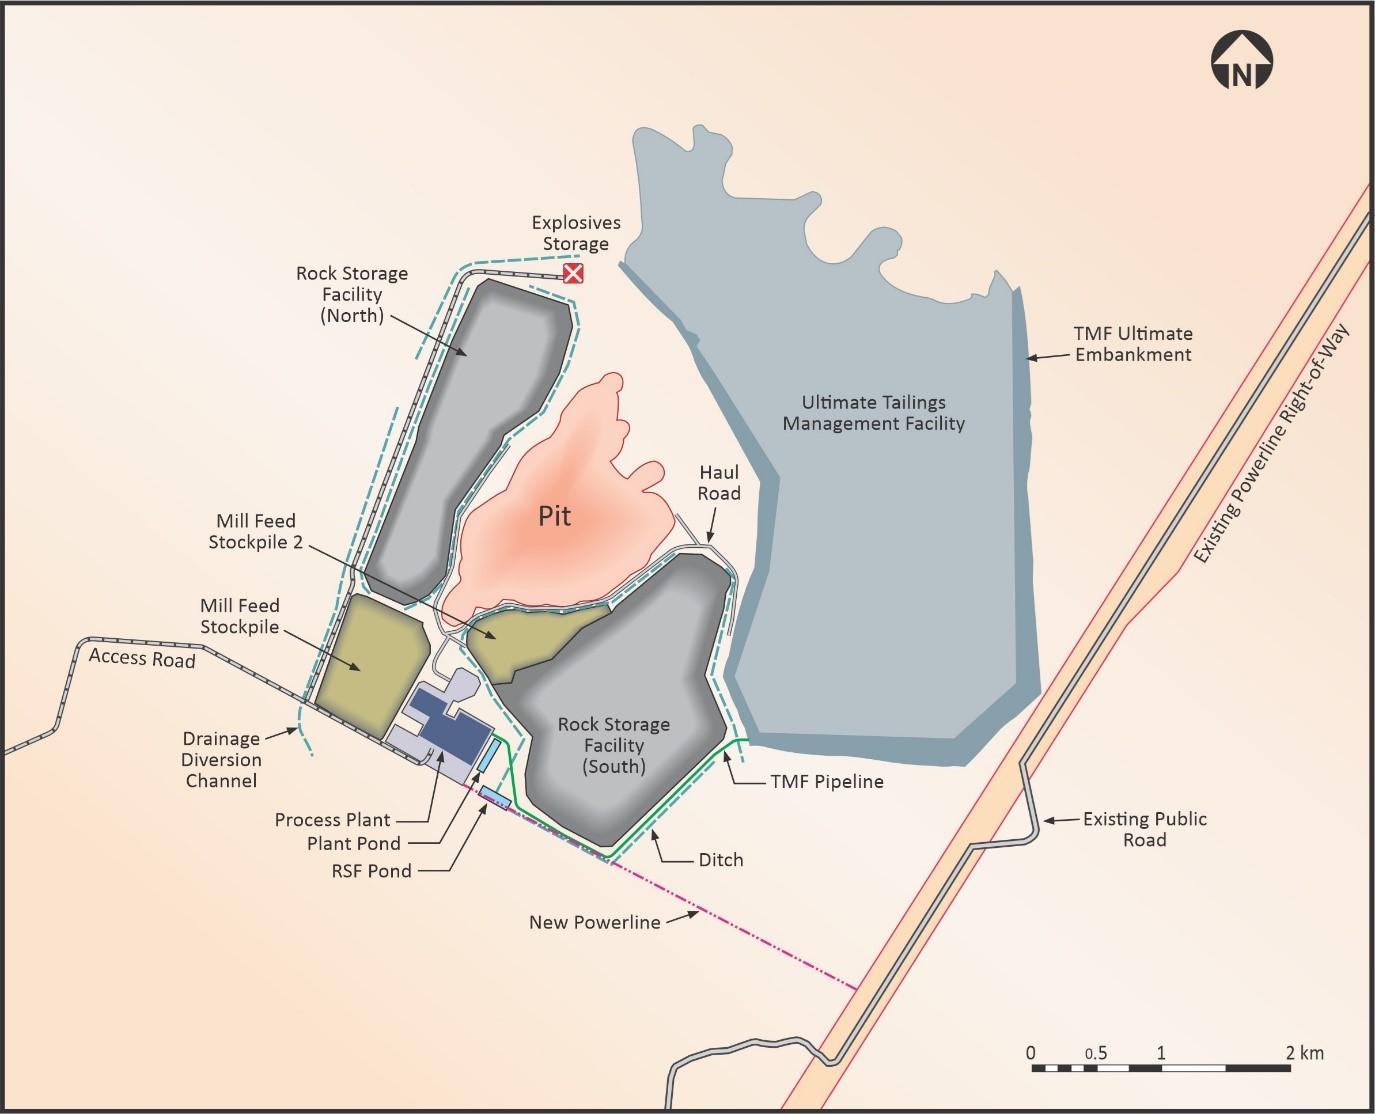
APPENDIX I – SITE LAYOUT:
APPENDIX J – PRODUCTION & CASH FLOW SCHEDULE:
| Units | Total/Avg | Y-2 | Y-1 | Y1 | Y2 | Y3 | Y4 | Y5 | Y6 | Y7 | Y8 | Y9 | Y10 | Y11 | Y12 | Y13 | Y14 | Y15 | Y16 | Y17 | Y18 | Y19 | |
| MINING | |||||||||||||||||||||||
| Mineralized Material Mined* | mt | 333 | — | 3 | 14 | 26 | 23 | 26 | 25 | 25 | 24 | 20 | 22 | 28 | 21 | 17 | 10 | 15 | 17 | 11 | 6 | — | — |
| Waste Mined | mt | 609 | — | 8 | 27 | 26 | 39 | 36 | 37 | 37 | 41 | 45 | 43 | 37 | 40 | 48 | 50 | 43 | 26 | 20 | 7 | — | — |
| Total Material Mined | mt | 942 | — | 11 | 40 | 53 | 62 | 62 | 62 | 62 | 65 | 65 | 65 | 65 | 62 | 65 | 60 | 59 | 43 | 31 | 13 | — | — |
| Mining Rate | ktpd | 143 | — | 30 | 111 | 144 | 169 | 169 | 169 | 169 | 178 | 178 | 178 | 178 | 169 | 178 | 164 | 161 | 119 | 86 | 37 | — | — |
| Strip Ratio** | w:o | 2.1 | — | 3.0 | 1.9 | 1.0 | 1.7 | 1.4 | 1.5 | 1.5 | 1.7 | 2.3 | 2.0 | 1.3 | 1.9 | 2.9 | 4.8 | 2.8 | 1.6 | 1.9 | 1.1 | — | — |
| *Mineralized material mined includes 30Mt of above cutoff oxides that are not processed. For ore processed (i.e.: reserves), see “Processing” section below | |||||||||||||||||||||||
| **Strip ratio is that of processed mineralized material (i.e.: ore in reserves) and excludes the unprocessed 30Mt of above cutoff grade oxides left on stockpiles at the end of production (i.e.: treated as waste in SR calculation) | |||||||||||||||||||||||
| PROCESSING | |||||||||||||||||||||||
| Oxides – Mill Feed: | |||||||||||||||||||||||
| Ore Tonnes | mt | 19 | — | — | — | 0.2 | 0.0 | 0.3 | 1.5 | — | 1.9 | 0.0 | 1.9 | — | 0.1 | 1.9 | 1.9 | 1.9 | 1.9 | 1.9 | 1.9 | 1.8 | — |
| Ore Grades: | |||||||||||||||||||||||
| Ag | g/t | 31 | — | — | — | 61 | 35 | 41 | 42 | — | 31 | 44 | 29 | — | 36 | 31 | 28 | 28 | 28 | 28 | 28 | 28 | — |
| Au | g/t | 0.07 | — | — | — | 0.07 | 0.09 | 0.06 | 0.05 | — | 0.07 | 0.03 | 0.08 | — | 0.08 | 0.06 | 0.08 | 0.08 | 0.08 | 0.08 | 0.08 | 0.08 | — |
| Pb | % | 0.28% | — | — | — | 0.76% | 1.29% | 0.36% | 0.30% | — | 0.29% | 0.69% | 0.24% | — | 0.49% | 0.41% | 0.25% | 0.25% | 0.25% | 0.25% | 0.25% | 0.25% | — |
| Zn | % | 0.33% | — | — | — | 1.07% | 1.29% | 0.27% | 0.25% | — | 0.29% | 0.35% | 0.29% | — | 0.46% | 0.54% | 0.30% | 0.30% | 0.30% | 0.30% | 0.30% | 0.30% | — |
| AgEq | g/t | 57 | — | — | — | 130 | 130 | 67 | 65 | — | 56 | 81 | 53 | — | 74 | 67 | 53 | 53 | 53 | 53 | 53 | 53 | — |
| Sulphides – Mill Feed: | |||||||||||||||||||||||
| Ore Tonnes | mt | 284 | — | — | 7 | 9 | 9 | 16 | 17 | 19 | 17 | 19 | 17 | 19 | 18 | 17 | 17 | 17 | 17 | 17 | 17 | 16 | — |
| Mill Head Grade: | |||||||||||||||||||||||
| Ag | g/t | 27 | — | — | 44 | 51 | 50 | 36 | 30 | 27 | 31 | 27 | 28 | 30 | 31 | 24 | 17 | 21 | 24 | 19 | 18 | 12 | — |
| Au | g/t | 0.08 | — | — | 0.22 | 0.28 | 0.12 | 0.21 | 0.09 | 0.06 | 0.07 | 0.08 | 0.05 | 0.09 | 0.07 | 0.05 | 0.04 | 0.04 | 0.06 | 0.05 | 0.05 | 0.05 | — |
| Pb | % | 0.45% | — | — | 0.63% | 0.82% | 0.58% | 0.56% | 0.38% | 0.41% | 0.50% | 0.45% | 0.45% | 0.55% | 0.63% | 0.49% | 0.29% | 0.35% | 0.40% | 0.33% | 0.31% | 0.19% | — |
| Zn | % | 0.72% | — | — | 0.63% | 1.03% | 0.88% | 0.60% | 0.68% | 0.72% | 0.90% | 0.79% | 0.74% | 0.97% | 1.13% | 0.76% | 0.48% | 0.62% | 0.69% | 0.62% | 0.53% | 0.32% | — |
| AgEq | g/t | 74 | — | — | 104 | 136 | 110 | 91 | 73 | 71 | 85 | 76 | 74 | 90 | 97 | 71 | 48 | 58 | 66 | 56 | 51 | 33 | — |
| TOTAL ORE – Mill Feed: | |||||||||||||||||||||||
| Ore Tonnes | mt | 302 | — | — | 7 | 9 | 9 | 17 | 19 | 19 | 19 | 19 | 19 | 19 | 19 | 19 | 19 | 19 | 19 | 19 | 19 | 18 | — |
| Mill Head Grade: | |||||||||||||||||||||||
| Ag | g/t | 27 | — | — | 44 | 52 | 50 | 36 | 31 | 27 | 31 | 27 | 28 | 30 | 31 | 25 | 19 | 22 | 24 | 20 | 19 | 14 | — |
| Au | g/t | 0.08 | — | — | 0.22 | 0.27 | 0.12 | 0.20 | 0.09 | 0.06 | 0.07 | 0.08 | 0.05 | 0.09 | 0.07 | 0.05 | 0.05 | 0.04 | 0.06 | 0.05 | 0.05 | 0.05 | — |
| Pb | % | 0.44% | — | — | 0.63% | 0.82% | 0.58% | 0.56% | 0.37% | 0.41% | 0.48% | 0.45% | 0.43% | 0.55% | 0.63% | 0.48% | 0.29% | 0.34% | 0.38% | 0.32% | 0.31% | 0.19% | — |
| Zn | % | 0.70% | — | — | 0.63% | 1.03% | 0.88% | 0.60% | 0.64% | 0.72% | 0.84% | 0.79% | 0.70% | 0.97% | 1.12% | 0.74% | 0.47% | 0.59% | 0.65% | 0.59% | 0.50% | 0.32% | — |
| AgEq | g/t | 73 | — | — | 104 | 136 | 110 | 90 | 73 | 71 | 83 | 76 | 72 | 90 | 97 | 71 | 48 | 57 | 65 | 56 | 51 | 35 | — |
| Lead/Silver Conc. – Recovery: | |||||||||||||||||||||||
| Ag | % | 71% | — | — | 78% | 77% | 77% | 75% | 65% | 74% | 68% | 75% | 67% | 77% | 77% | 65% | 61% | 64% | 65% | 63% | 62% | 54% | — |
| Au | % | 13% | — | — | 13% | 13% | 13% | 13% | 13% | 13% | 13% | 13% | 13% | 13% | 13% | 13% | 13% | 13% | 13% | 13% | 13% | 13% | — |
| Pb | % | 86% | — | — | 90% | 90% | 89% | 88% | 84% | 87% | 85% | 88% | 85% | 89% | 89% | 84% | 82% | 83% | 84% | 83% | 82% | 78% | — |
| Zinc Conc. – Recovery: | |||||||||||||||||||||||
| Ag | % | 17% | — | — | 12% | 12% | 13% | 14% | 18% | 14% | 17% | 14% | 17% | 13% | 13% | 18% | 20% | 19% | 18% | 19% | 20% | 23% | — |
| Au | % | 10% | — | — | 10% | 10% | 10% | 10% | 10% | 10% | 10% | 10% | 10% | 10% | 10% | 10% | 10% | 10% | 10% | 10% | 10% | 10% | — |
| Zn | % | 85% | — | — | 84% | 88% | 86% | 83% | 84% | 85% | 87% | 85% | 85% | 87% | 88% | 85% | 82% | 84% | 85% | 84% | 83% | 79% | — |
| PRODUCTION PROFILE | |||||||||||||||||||||||
| METAL PRODUCED: | |||||||||||||||||||||||
| Ag – Ag/Pb Concentrate | moz | 186 | — | — | 8 | 12 | 12 | 14 | 12 | 12 | 13 | 12 | 11 | 14 | 14 | 10 | 7 | 8 | 10 | 7 | 7 | 4 | — |
| Au – Ag/Pb Concentrate | koz | 100 | — | — | 7 | 10 | 5 | 14 | 7 | 5 | 5 | 6 | 4 | 6 | 5 | 4 | 4 | 3 | 4 | 4 | 4 | 4 | — |
| Pb – Ag/Pb Concentrate | mlbs | 2,513 | — | — | 93 | 151 | 105 | 183 | 129 | 147 | 167 | 163 | 151 | 203 | 229 | 167 | 96 | 118 | 133 | 110 | 104 | 64 | — |
| AgEq – Ag/Pb Concentrate | moz | 326 | — | — | 13 | 20 | 17 | 24 | 19 | 20 | 22 | 21 | 20 | 25 | 27 | 19 | 12 | 15 | 17 | 14 | 13 | 8 | — |
| Ag – Zn Concentrate | moz | 43 | — | — | 1 | 2 | 2 | 3 | 3 | 2 | 3 | 2 | 3 | 2 | 2 | 3 | 2 | 2 | 3 | 2 | 2 | 2 | — |
| Au – Zn Concentrate | koz | 75 | — | — | 5 | 8 | 3 | 10 | 5 | 4 | 4 | 5 | 3 | 5 | 4 | 3 | 3 | 2 | 3 | 3 | 3 | 3 | — |
| Zn – Zn Concentrate | mlbs | 3,986 | — | — | 87 | 185 | 156 | 185 | 223 | 249 | 297 | 277 | 244 | 348 | 405 | 260 | 161 | 203 | 225 | 203 | 174 | 105 | — |
| AgEq – Zn Concentrate | moz | 265 | — | — | 6 | 13 | 11 | 13 | 16 | 16 | 20 | 18 | 16 | 22 | 25 | 17 | 11 | 14 | 15 | 14 | 12 | 8 | — |
| Ag – Total | moz | 229 | — | — | 10 | 14 | 13 | 17 | 15 | 14 | 16 | 14 | 14 | 16 | 16 | 12 | 9 | 11 | 12 | 10 | 9 | 6 | — |
| Au – Total | koz | 175 | — | — | 12 | 18 | 8 | 24 | 12 | 8 | 9 | 11 | 7 | 11 | 9 | 6 | 6 | 5 | 8 | 7 | 7 | 6 | — |
| Pb – Total | mlbs | 2,513 | — | — | 93 | 151 | 105 | 183 | 129 | 147 | 167 | 163 | 151 | 203 | 229 | 167 | 96 | 118 | 133 | 110 | 104 | 64 | — |
| Zn – Total | mlbs | 4,314 | — | — | 92 | 197 | 168 | 196 | 242 | 271 | 322 | 301 | 264 | 377 | 440 | 280 | 175 | 221 | 244 | 221 | 188 | 114 | — |
| AgEq – Total Metal Produced | moz | 591 | — | — | 20 | 33 | 28 | 38 | 35 | 36 | 42 | 39 | 36 | 47 | 52 | 36 | 23 | 29 | 32 | 27 | 25 | 16 | — |
| METAL PAYABLE: | |||||||||||||||||||||||
| Ag – Ag/Pb Concentrate | moz | 177 | — | — | 8 | 11 | 11 | 14 | 11 | 11 | 12 | 11 | 11 | 13 | 13 | 9 | 6 | 8 | 9 | 7 | 7 | 4 | — |
| Au – Ag/Pb Concentrate | koz | 47 | — | — | 4 | 7 | 2 | 9 | 3 | 1 | 1 | 2 | 4 | 1 | 5 | 3 | 0 | 3 | 0 | 1 | 1 | 1 | — |
| Pb – Ag/Pb Concentrate | mlbs | 2,368 | — | — | 89 | 143 | 100 | 173 | 121 | 138 | 158 | 154 | 143 | 192 | 217 | 157 | 90 | 110 | 125 | 103 | 97 | 59 | — |
| AgEq – Ag/Pb Concentrate | moz | 288 | — | — | 12 | 18 | 16 | 22 | 17 | 18 | 19 | 18 | 18 | 22 | 24 | 17 | 10 | 13 | 15 | 12 | 11 | 7 | — |
| Ag – Zn Concentrate | moz | 22 | — | — | 1 | 1 | 1 | 1 | 2 | 1 | 2 | 1 | 2 | 1 | 1 | 1 | 1 | 1 | 1 | 1 | 1 | 1 | — |
| Au – Zn Concentrate | koz | 7 | — | — | 2 | 2 | — | 4 | — | — | — | — | — | — | — | — | — | — | — | — | — | — | — |
| Zn – Zn Concentrate | mlbs | 3,360 | — | — | 73 | 157 | 132 | 155 | 187 | 210 | 251 | 233 | 205 | 294 | 344 | 219 | 135 | 171 | 189 | 170 | 146 | 88 | — |
| AgEq – Zn Concentrate | moz | 206 | — | — | 5 | 10 | 8 | 10 | 12 | 13 | 15 | 14 | 13 | 17 | 20 | 13 | 9 | 11 | 12 | 10 | 9 | 6 | — |
| Ag – Total | moz | 199 | — | — | 9 | 12 | 12 | 15 | 13 | 12 | 14 | 12 | 12 | 14 | 14 | 11 | 8 | 9 | 10 | 8 | 8 | 5 | — |
| Au – Total | koz | 54 | — | — | 6 | 8 | 2 | 13 | 3 | 1 | 1 | 2 | 4 | 1 | 5 | 3 | 0 | 3 | 0 | 1 | 1 | 1 | — |
| Pb – Total | mlbs | 2,368 | — | — | 89 | 143 | 100 | 173 | 121 | 138 | 158 | 154 | 143 | 192 | 217 | 157 | 90 | 110 | 125 | 103 | 97 | 59 | — |
| Zn – Total | mlbs | 3,360 | — | — | 73 | 157 | 132 | 155 | 187 | 210 | 251 | 233 | 205 | 294 | 344 | 219 | 135 | 171 | 189 | 170 | 146 | 88 | — |
| AgEq – Total Metal Payable | moz | 494 | — | — | 17 | 28 | 24 | 32 | 29 | 30 | 35 | 32 | 30 | 39 | 43 | 30 | 19 | 24 | 26 | 22 | 20 | 13 | — |
| REVENUE | |||||||||||||||||||||||
| OXIDES + SULPHIDES: | |||||||||||||||||||||||
| Ag Revenue | US$mm | $4,387 | — | — | $190 | $272 | $265 | $335 | $291 | $271 | $301 | $271 | $275 | $310 | $315 | $232 | $168 | $202 | $231 | $180 | $170 | $110 | — |
| Au Revenue | US$mm | $87 | — | — | $10 | $14 | $3 | $20 | $4 | $1 | $1 | $2 | $6 | $2 | $8 | $6 | $1 | $5 | $1 | $1 | $1 | $2 | — |
| Pb Revenue | US$mm | $2,368 | — | — | $89 | $143 | $100 | $173 | $121 | $138 | $158 | $154 | $143 | $192 | $217 | $157 | $90 | $110 | $125 | $103 | $97 | $59 | — |
| Zn Revenue | US$mm | $4,032 | — | — | $88 | $188 | $158 | $186 | $225 | $252 | $301 | $280 | $246 | $353 | $412 | $263 | $163 | $205 | $227 | $204 | $175 | $106 | — |
| Gross Revenue | US$mm | $10,874 | — | — | $376 | $617 | $526 | $715 | $641 | $662 | $761 | $707 | $669 | $857 | $952 | $658 | $421 | $522 | $583 | $488 | $443 | $277 | — |
| Treatment & Refining Charges | US$mm | $1,243 | — | — | $36 | $62 | $53 | $71 | $71 | $77 | $88 | $83 | $76 | $101 | $113 | $79 | $51 | $63 | $69 | $61 | $54 | $34 | — |
| Total Penalties | US$mm | $58 | — | — | $2 | $3 | $2 | $3 | $3 | $3 | $4 | $4 | $3 | $5 | $6 | $4 | $2 | $3 | $3 | $3 | $2 | $1 | — |
| Net Revenue – Total | US$mm | $9,572 | — | — | $339 | $551 | $471 | $641 | $567 | $581 | $669 | $620 | $590 | $751 | $833 | $575 | $367 | $457 | $510 | $424 | $386 | $242 | — |
| OPERATING COSTS | |||||||||||||||||||||||
| UNIT COSTS: | |||||||||||||||||||||||
| Mine (Incl. Rehandling) | US$/t Moved | $2.45 | — | — | $2.44 | $2.31 | $2.31 | $2.39 | $2.42 | $2.30 | $2.34 | $2.26 | $2.18 | $2.35 | $2.48 | $2.32 | $2.44 | $2.56 | $2.84 | $3.04 | $4.45 | — | — |
| Processing | US$/t Processed | $6.38 | — | — | $6.56 | $6.46 | $6.46 | $6.38 | $6.36 | $6.36 | $6.36 | $6.36 | $6.36 | $6.36 | $6.48 | $6.36 | $6.36 | $6.36 | $6.36 | $6.36 | $6.36 | $6.37 | — |
| Site G&A Costs | US$/t Processed | $0.62 | — | — | $1.32 | $1.06 | $1.06 | $0.63 | $0.57 | $0.57 | $0.57 | $0.57 | $0.57 | $0.57 | $0.57 | $0.57 | $0.57 | $0.57 | $0.57 | $0.57 | $0.57 | $0.60 | — |
| OPERATING COSTS INCURED: | |||||||||||||||||||||||
| Mine (Incl. Rehandling) | US$mm | $2,286 | — | — | $98 | $121 | $142 | $147 | $149 | $141 | $151 | $146 | $141 | $152 | $153 | $150 | $146 | $150 | $123 | $95 | $60 | $18 | — |
| Processing | US$mm | $1,929 | — | — | $49 | $60 | $60 | $107 | $118 | $118 | $118 | $118 | $118 | $118 | $121 | $118 | $118 | $118 | $118 | $118 | $118 | $112 | — |
| Site G&A Costs | US$mm | $188 | — | — | $10 | $10 | $10 | $11 | $11 | $11 | $11 | $11 | $11 | $11 | $11 | $11 | $11 | $11 | $11 | $11 | $11 | $11 | — |
| Total Site Operating Costs | US$mm | $4,402 | — | — | $157 | $191 | $212 | $264 | $278 | $270 | $280 | $275 | $270 | $281 | $284 | $279 | $275 | $279 | $252 | $224 | $189 | $140 | — |
| NSR – Government | US$mm | $21 | — | — | $1 | $1 | $1 | $2 | $1 | $1 | $1 | $1 | $1 | $1 | $2 | $1 | $1 | $1 | $1 | $1 | $1 | $1 | — |
| Concentrate Transport | US$mm | $816 | — | — | $22 | $39 | $31 | $45 | $46 | $50 | $57 | $55 | $50 | $66 | $75 | $54 | $35 | $42 | $46 | $41 | $37 | $24 | — |
| Total Operating Costs | US$mm | $5,239 | — | — | $180 | $232 | $245 | $311 | $325 | $322 | $339 | $331 | $321 | $349 | $360 | $334 | $311 | $322 | $299 | $266 | $227 | $165 | — |
| CASH COSTS: | |||||||||||||||||||||||
| Co-Product Basis: | |||||||||||||||||||||||
| Operating Cash Costs | US$/oz AgEq | $8.91 | — | — | $9.20 | $6.83 | $8.86 | $8.14 | $9.53 | $8.99 | $8.10 | $8.57 | $8.88 | $7.22 | $6.56 | $9.34 | $14.39 | $11.76 | $9.51 | $10.08 | $9.37 | $11.13 | — |
| Total Cash Costs | US$/oz AgEq | $13.23 | — | — | $12.70 | $10.60 | $12.55 | $11.86 | $13.70 | $13.38 | $12.48 | $13.02 | $13.19 | $11.68 | $11.08 | $13.93 | $19.05 | $16.34 | $14.03 | $14.86 | $14.08 | $15.90 | — |
| All-in Sustaining Costs | US$/oz AgEq | $13.62 | — | — | $12.89 | $11.80 | $12.86 | $11.97 | $13.84 | $13.48 | $12.63 | $13.13 | $14.67 | $11.91 | $11.27 | $14.15 | $19.36 | $18.32 | $14.08 | $14.92 | $14.11 | $15.96 | — |
| CAPITAL EXPENDITURES | |||||||||||||||||||||||
| Initial/Expansion Capex | US$mm | $774 | $114 | $341 | — | — | $216 | $72 | — | — | — | — | $31 | — | — | — | — | — | — | — | — | — | — |
| Sustaining Capex (incl. Net Closure) | US$mm | $228 | — | — | $18 | $34 | $8 | $3 | $4 | $3 | $5 | $3 | $45 | $9 | $8 | $6 | $6 | $47 | $1 | $1 | $1 | $1 | $24 |
| Total Capital Expenditures | US$mm | $1,003 | $114 | $341 | $18 | $34 | $224 | $76 | $4 | $3 | $5 | $3 | $76 | $9 | $8 | $6 | $6 | $47 | $1 | $1 | $1 | $1 | $24 |
| FREE CASH FLOW VALUATION | |||||||||||||||||||||||
| Net Revenue | US$mm | $9,572 | — | — | $339 | $551 | $471 | $641 | $567 | $581 | $669 | $620 | $590 | $751 | $833 | $575 | $367 | $457 | $510 | $424 | $386 | $242 | — |
| Operating Expenses | US$mm | ($4,402) | — | — | ($157) | ($191) | ($212) | ($264) | ($278) | ($270) | ($280) | ($275) | ($270) | ($281) | ($284) | ($279) | ($275) | ($279) | ($252) | ($224) | ($189) | ($140) | — |
| Concentrate Transportation | US$mm | ($816) | — | — | ($22) | ($39) | ($31) | ($45) | ($46) | ($50) | ($57) | ($55) | ($50) | ($66) | ($75) | ($54) | ($35) | ($42) | ($46) | ($41) | ($37) | ($24) | — |
| Royalties | US$mm | ($21) | — | — | ($1) | ($1) | ($1) | ($2) | ($1) | ($1) | ($1) | ($1) | ($1) | ($1) | ($2) | ($1) | ($1) | ($1) | ($1) | ($1) | ($1) | ($1) | — |
| EBITDA | US$mm | $4,333 | — | — | $159 | $320 | $226 | $329 | $242 | $259 | $330 | $288 | $268 | $402 | $473 | $241 | $56 | $134 | $211 | $158 | $159 | $77 | — |
| Capital Expenditures | US$mm | ($1,003) | ($114) | ($341) | ($18) | ($34) | ($224) | ($76) | ($4) | ($3) | ($5) | ($3) | ($76) | ($9) | ($8) | ($6) | ($6) | ($47) | ($1) | ($1) | ($1) | ($1) | ($24) |
| Pre-Tax Free Cash Flow | US$mm | $3,331 | ($114) | ($341) | $141 | $286 | $2 | $254 | $238 | $256 | $324 | $285 | $192 | $393 | $464 | $235 | $51 | $87 | $210 | $157 | $159 | $76 | ($24) |
| Mining Tax | US$mm | ($325) | — | — | ($12) | ($24) | ($17) | ($25) | ($18) | ($19) | ($25) | ($22) | ($20) | ($30) | ($35) | ($18) | ($4) | ($10) | ($16) | ($12) | ($12) | ($6) | — |
| Income Tax Payable | US$mm | ($898) | — | — | ($19) | ($69) | ($35) | ($61) | ($36) | ($41) | ($60) | ($49) | ($57) | ($95) | ($124) | ($63) | ($11) | ($31) | ($52) | ($37) | ($41) | ($18) | — |
| Post-Tax Free Cash Flow | US$mm | $2,108 | ($114) | ($341) | $110 | $193 | ($50) | $169 | $183 | $196 | $239 | $215 | $115 | $267 | $305 | $154 | $35 | $47 | $142 | $108 | $106 | $52 | ($24) |
| Pre-Tax | Post-Tax | ||||||||||||||||||||||
| NPV (5%) | US$mm | $1,902 | $1,153 | ||||||||||||||||||||
| IRR | % | 38.9% | 28.0% | ||||||||||||||||||||
| Payback | Years | 3.1 | 4.2 | ||||||||||||||||||||
Confirms strong metallurgical potential and local processing capa... READ MORE
Standard Uranium Ltd. (TSX-V: STND) (OTCQB: STTDF) (FSE: 9SU0) ... READ MORE
Drilling Program Confirms Significant Graphitic Fault Zones and Associat... READ MORE
Second Highest Grade Intercept to Date on Ogden Project 115.51 g/... READ MORE
Wallbridge Mining Company Limited (TSX: WM) (OTCQB:WLBMF) is plea... READ MORE


