


![]()
Mineral Resource update shows significant growth with initial resource from Golden Eye; Increase in M&I provides foundation for advancing economic studies; Plus substantial scope for further resource growth with ongoing drilling
HIGHLIGHTS:
Cygnus Executive Chairman David Southam said: “Within just nine months of acquiring the Chibougamau Project, we have been able to deliver a significant resource upgrade with substantial scope for further growth.
“Importantly, it comes at a time of rising demand for copper projects in attractive jurisdictions with real scale and a clear pathway to production and cashflow. With this increased resource base, and the ongoing growth outlook, Cygnus is now clearly in that league.
“Being able to deliver a brand-new resource at Golden Eye in such a short space of time speaks volumes. It should not be lost that our total gold resources have increased substantially in a gold price environment in excess of US$3,500/oz.
“Given the potentially significant benefits of the increased resource on a production profile and the sharp rises in our commodity prices since the previous studies done three years ago, the attractions of the Chibougamau Project are now very clear to us.”
Cygnus Metals Limited (ASX: CY5) (TSX-V: CYG) (OTCQB: CYGGF) is pleased to announce a MRE update for the Chibougamau Copper-Gold Project in Quebec (Table 1).
This updated MRE is comprised of:
Overall, this results in a significant increase in the total resource base for the Chibougamau Hub and Spoke Project.
The MRE update for the Chibougamau Project includes the Corner Bay, Cedar Bay, Joe Mann, and Devlin deposits and the new Golden Eye deposit, all located within a 60 km radius from Cygnus’ 100%-owned existing processing facility. The increase in the MRE is the result of drilling programs completed by Doré Copper in 2022 & 2024 at Corner Bay and Cygnus in 2025 at Corner Bay and Golden Eye. In the nine months since Cygnus acquired Doré Copper on 1 January 2025, Cygnus has completed 17,183 m of drilling.
A major part of the increased MRE is due to a successful exploration drilling campaign at Golden Eye which was a focus of early target generation and exploration work by the Cygnus exploration team. The initial resource at Golden Eye includes Indicated Mineral Resources of 91 koz at 5.6 g/t AuEq and Inferred Mineral Resources of 182 koz at 4.6 g/t AuEq. The Company sees further opportunity to grow this resource, which remains open at depth below 400 m and in multiple directions.
The increase in the global MRE (see Figure 1) in a short timeframe proves that significant growth opportunities exist at the Chibougamau Project. Diamond drill rigs are continuing to turn while the Company continues to execute its in-house AI driven solution for the compilation of historic drill logs and maps, some of which have never been viewed in modern 3D software. This background work has successfully assisted Cygnus in targeting Golden Eye and resulted in the delivery of an initial MRE, as well as identifying new drill targets at Cedar Bay (currently being drilled), and will be fundamental to generating additional drill targets within the camp.
Significant exploration potential is centred around the high-grade Chibougamau mineral system, which has a production history of 945,000 t of copper and 3.5 Moz of gold.3 This endowment, combined with a fractured ownership history and premature mine closure, provides Cygnus with the first opportunity to conduct modern systematic exploration in over 20 years.
The MRE update provides the foundation for advancing the economic studies of the Chibougamau Project. Well established infrastructure provides the project a significant head start along the pathway to production with a 900,000 tpa processing facility, local mining town, sealed highway, airport, regional rail infrastructure, and 25 kV hydro power to the processing site. Significantly, the Chibougamau processing facility is the only base metal processing facility within a 250 km radius. There are a number of other advanced copper and gold projects within this reach.
The MRE was prepared by SLR Consulting (Canada) Ltd. in accordance with Canadian Institute of Mining Metallurgy and Petroleum Definition Standards as incorporated in National Instrument 43-101 Standard of Disclosures for Mineral Projects and the Joint Ore Reserves Committee’s 2012 edition of the Australasian Code for Reporting of Exploration Results, Mineral Resources and Ore Reserves. A Technical Report, documenting the Chibougamau Project Mineral Resource Estimate, will be filed on SEDAR+ (www.sedarplus.ca) within 45 days of this news release and will also be available on the Company’s website (www.cygnusmetals.com).
Table 1: Mineral Resource Estimate (“MRE”) for the Chibougamau Copper-Gold Project as at 16 September 2025.
| Cu Project | Classification | COG CuEq | Tonnage | Average Grade | Contained Metal | ||||||||
| Cu | Au | Ag | CuEq | AuEq | Cu | Au | Ag | CuEq | AuEq | ||||
| % | Mt | % | g/t | g/t | % | g/t | kt | koz | koz | kt | koz | ||
| Corner Bay | Indicated | 1.2 | 4.9 | 2.5 | 0.3 | 8.4 | 2.8 | 4.1 | 124 | 43 | 1,316 | 137 | 638 |
| Inferred | 5.4 | 2.7 | 0.2 | 8.9 | 3.0 | 4.3 | 146 | 41 | 1,543 | 159 | 744 | ||
| Devlin | Measured | 1.5 | 0.1 | 2.7 | 0.3 | 0.5 | 2.9 | 4.7 | 4 | 1 | 2 | 4 | 19 |
| Indicated | 0.6 | 2.0 | 0.2 | 0.2 | 2.1 | 3.4 | 13 | 4 | 5 | 13 | 69 | ||
| M&I | 0.8 | 2.1 | 0.2 | 0.3 | 2.3 | 3.6 | 16 | 5 | 7 | 17 | 88 | ||
| Inferred | 0.3 | 2.0 | 0.2 | 0.3 | 2.1 | 3.4 | 7 | 2 | 3 | 7 | 36 | ||
| Total | Measured | 1.2-1.5 | 0.1 | 2.7 | 0.3 | 0.5 | 2.9 | 4.7 | 4 | 1 | 2 | 4 | 19 |
| Indicated | 5.5 | 2.5 | 0.3 | 7.5 | 2.7 | 4.0 | 137 | 47 | 1,321 | 150 | 707 | ||
| M&I | 5.6 | 2.5 | 0.3 | 7.3 | 2.7 | 4.0 | 140 | 48 | 1,323 | 154 | 726 | ||
| Inferred | 5.7 | 2.7 | 0.2 | 8.4 | 2.9 | 4.2 | 153 | 43 | 1,546 | 166 | 780 | ||
| Au Project | Classification | COG AuEq | Tonnage | Average Grade | Contained Metal | ||||||||
| Cu | Au | Ag | CuEq | AuEq | Cu | Au | Ag | CuEq | AuEq | ||||
| g/t | Mt | % | g/t | g/t | % | g/t | kt | koz | koz | kt | koz | ||
| Joe Mann | Inferred | 2.0 | 0.7 | 0.2 | 6.0 | – | 4.6 | 6.3 | 2 | 143 | – | 34 | 151 |
| Cedar Bay | Indicated | 1.8 | 0.3 | 1.6 | 6.0 | 9.9 | 6.4 | 8.1 | 4 | 50 | 82 | 16 | 67 |
| Inferred | 0.8 | 2.0 | 5.1 | 11.8 | 6.1 | 7.8 | 17 | 134 | 309 | 50 | 205 | ||
| Golden Eye | Indicated | 0.5 | 1.0 | 4.3 | 9.9 | 4.4 | 5.6 | 5 | 69 | 161 | 22 | 91 | |
| Inferred | 1.2 | 0.9 | 3.4 | 7.9 | 3.6 | 4.6 | 11 | 134 | 313 | 45 | 182 | ||
| Total | Indicated | 1.8-2.0 | 0.8 | 1.2 | 4.9 | 9.9 | 5.1 | 6.5 | 9 | 119 | 243 | 39 | 158 |
| Inferred | 2.8 | 1.0 | 4.6 | 6.9 | 4.6 | 6.0 | 29 | 411 | 622 | 129 | 538 | ||
| Project | Classification | Tonnage | Average Grade | Contained Metal | |||||||||
| Cu | Au | Ag | CuEq | AuEq | Cu | Au | Ag | CuEq | AuEq | ||||
| Mt | % | g/t | g/t | % | g/t | kt | koz | koz | kt | koz | |||
| Hub and Spoke | Measured | 0.1 | 2.7 | 0.3 | 0.5 | 2.9 | 4.7 | 4 | 1 | 2 | 4 | 19 | |
| Indicated | 6.3 | 2.3 | 0.8 | 7.8 | 3.0 | 4.3 | 146 | 166 | 1,563 | 189 | 865 | ||
| M&I | 6.4 | 2.3 | 0.8 | 7.6 | 3.0 | 4.3 | 149 | 167 | 1,565 | 193 | 884 | ||
| Inferred | 8.5 | 2.1 | 1.7 | 7.9 | 3.5 | 4.8 | 182 | 454 | 2,168 | 295 | 1,318 | ||
Notes:
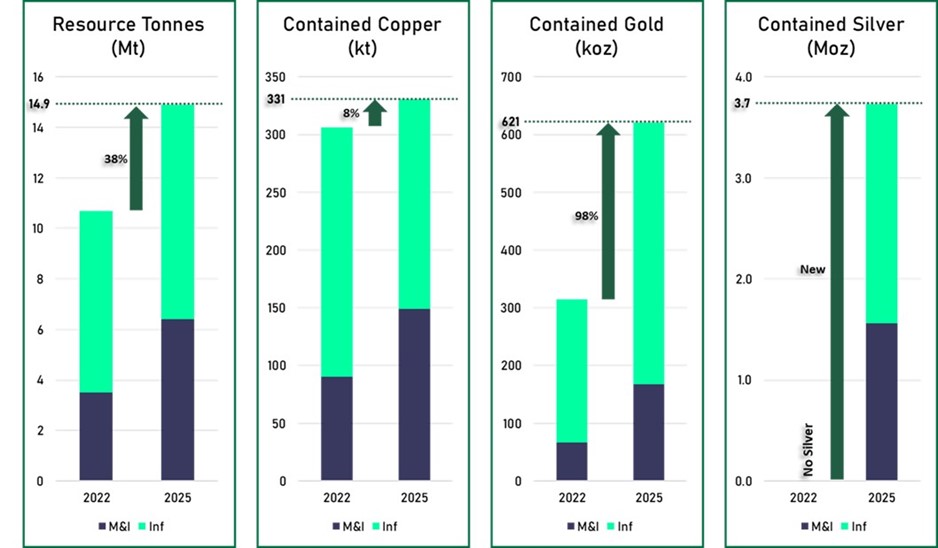
Figure 1: Comparison of current MRE (Sep 2025) with previous MRE (Mar 2022) for the Chibougamau Copper-Gold Project. Note: The previous MRE is considered a foreign estimate and was not prepared in accordance with the JORC Code. Refer to CY5’s ASX release dated 15 October 2024 for further details of the Foreign Estimate.
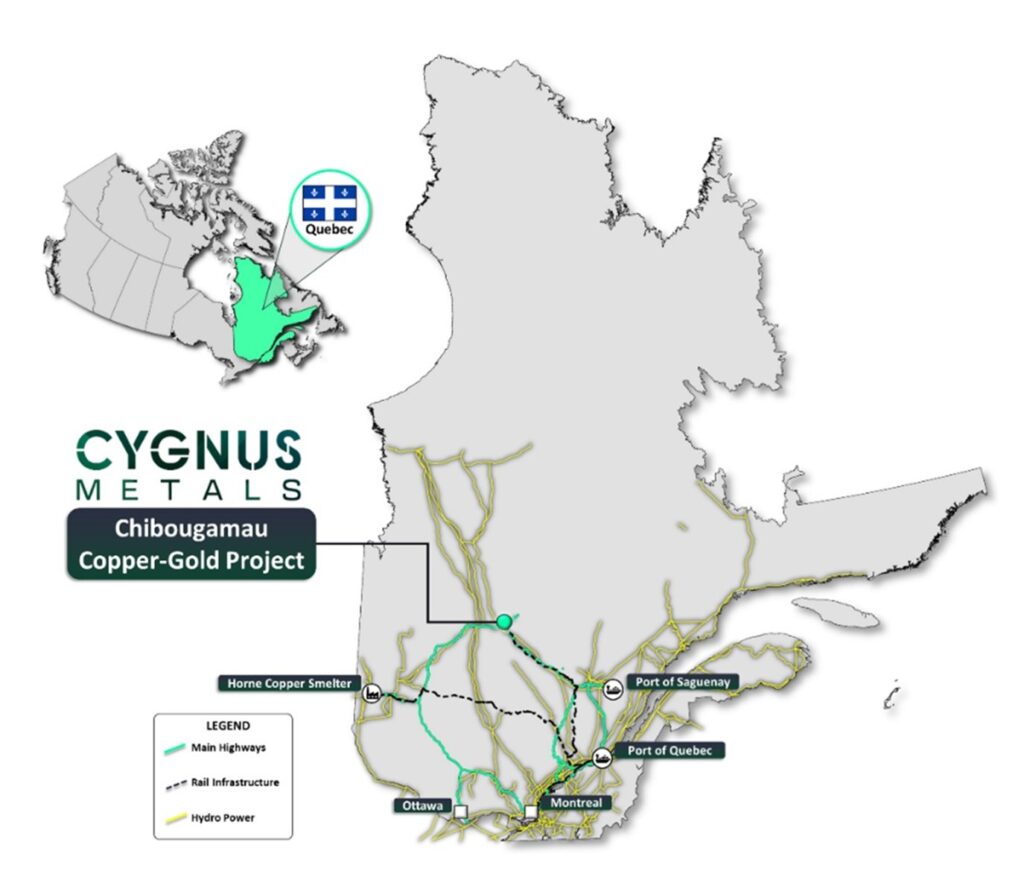
Figure 2: The Chibougamau Project located in Central Quebec on major road, rail and hydropower infrastructure.
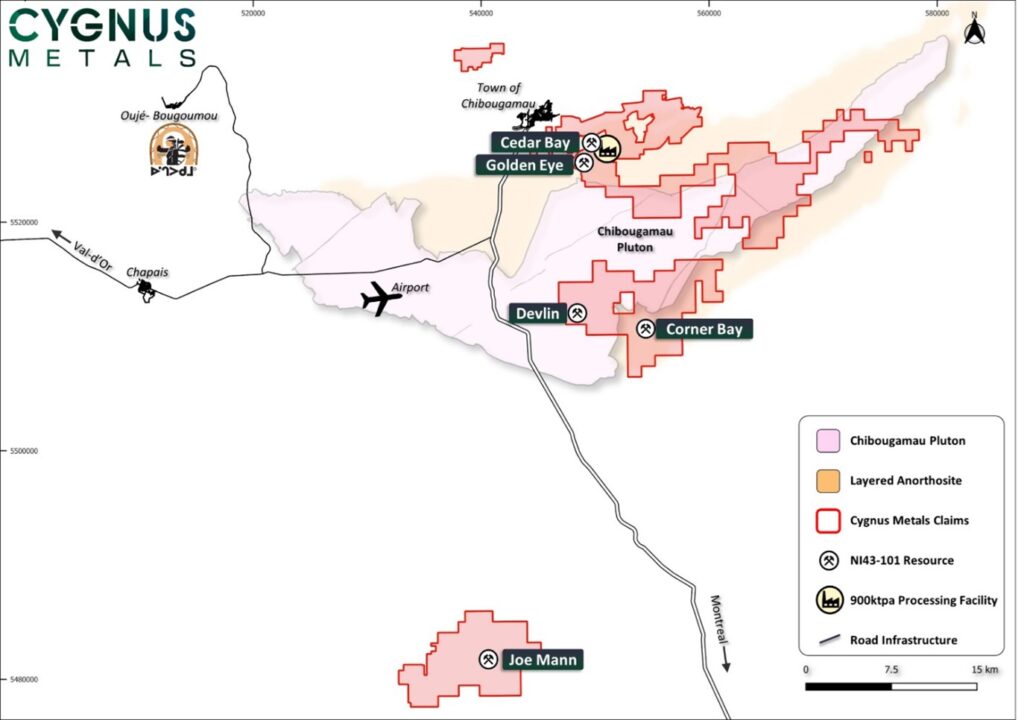
Figure 3: Location of high-grade Corner Bay, Devlin, Cedar Bay, Joe Mann and Golden Eye deposits in hub and spoke model.
Future Drilling
With this significant milestone now achieved, in line with the Company’s value creation strategy, the focus moves to the next 12 months (refer Figure 4). The MRE increase in contained metal clearly highlights the opportunity for continued growth and this remains one of the core drivers for value creation. Cygnus will continue exploration drilling across the camp utilising its in-house AI-driven solution for historic data to deliver priority drill targets. This approach will focus on known deposits and extensions to known mineralisation, continuing to unlock this historic district through low-risk brownfield exploration. In conjunction with exploration, the Company will also continue infill drilling to de-risk the Project and further provide confidence in the mineral resources to conduct more detailed study work.
Scoping Study/ Preliminary Economic Assessment
With the MRE update resulting in a 78% increase in the Measured and Indicated Mineral Resources, the Company also sees significant value in continuing to advance the Project with an updated Scoping Study / PEA (Doré Copper had previously completed a PEA in 2022)1 as there is significant opportunity to enhance the economics of the Project by using an updated MRE with updated costs (particularly treatment and refining charges), the inclusion of silver, exchange rates and metal prices to reflect the current commodity price environment. This updated study has commenced and is currently scheduled for completion in Q1 CY2026 (refer Figure 4).
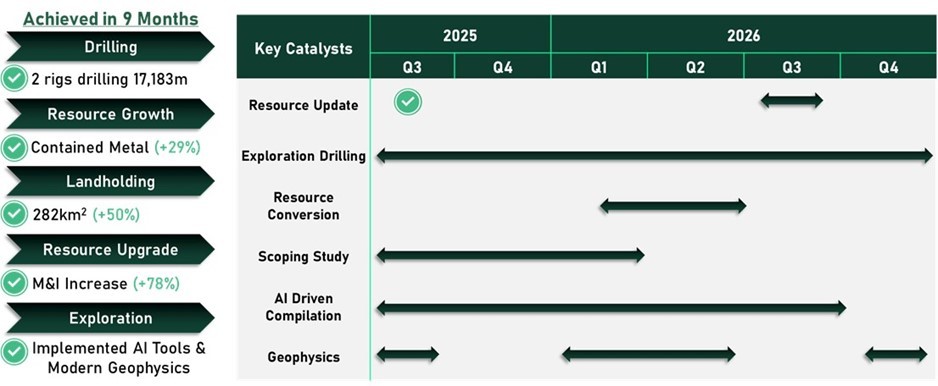
Figure 4: Indicative timetable of Cygnus’ strategy and news flow. The above timetable is indicative only and subject to change.
ABOUT THE MINERAL RESOURCE ESTIMATE
The Chibougamau Project Mineral Resource update consists of existing deposits Corner Bay, Cedar Bay, Joe Mann and Devlin and an initial MRE for the Golden Eye deposit (Table 1 on page 3 sets out the Mineral Resource Estimate for the Chibougamau Project).
The MRE has been prepared in accordance with the JORC Code and the 2014 CIM Definition Standards and were estimated in accordance with the Canadian Institute of Mining, Metallurgy and Petroleum’s 2019 Best Practices Guidelines, as required by NI 43-101. Mineral Resources that are not Mineral Reserves do not have demonstrated economic viability.
Key additional work that has resulted in the MRE increase includes, but is not limited to:
SUMMARY OF THE RESOURCE PARAMETERS
In accordance with ASX Listing Rule 5.8.1, a fair and balanced representation of the information contained in JORC Table 1 (refer Appendix B), including a summary of all information material to understanding the reported MRE is provided below.
Project Geology and Geological Interpretation
Regional and Local Geology
The Project is located at the northeastern extremity of the Abitibi Sub province in the Superior province of the Canadian Shield. The Abitibi Sub-province is considered to be one of the largest and best-preserved greenstone belts in the world and hosts numerous gold and base metal deposits.
The Chibougamau region is located in the northeastern part of the Abitibi Greenstone Belt of the Superior Province. The Archean rocks of the Chibougamau region were deformed and metamorphosed from greenschist to amphibolite facies during the Kenoran orogeny.
The Chapais-Chibougamau area recorded major intrusive activities of various nature, genetically linked to the volcanism and tectonism periods of the geological history of the region. The three important intrusive bodies of the region are: 1) the Doré Lake Complex; 2) the Chibougamau Pluton; and 3) the differentiated mafic to ultramafic sills of the Cumming Complex that formed in the second volcanic cycle.
The DLC hosts the Corner Bay, Cedar Bay and Golden Eye deposits as well as several other regional copper-gold deposits. It dates to 2,728.3 ± 1.2 Ma (Mortensen, 1993) and is a synvolcanic layered intrusion emplaced during the first volcanic cycle in the region between the Obatogamau and Waconichi Formations. DLC is an anorthositic complex with mafic to ultramafic intrusions with a tholeiitic to calc-alkaline magmatic affinity (Allard, 1976; Daigneault and al., 1990; Ahmadou and al., 2019).
The Chibougamau Pluton hosts the Devlin deposit. The pluton was emplaced in the DLC and part of the Waconichi Formation; however, it is coeval with the second volcanic cycle of the Roy Group. The Chibougamau Pluton is composed of an abundance of tonalite and diorite dikes, pegmatites, feldspar-phyric units, as well as hydrothermal and magmatic breccia; all of which point to a shallow emplacement depth (Mathieu and Racicot, 2019). The pluton occupies the core of the Chibougamau anticline, which is part of the major folding structures of the region.
The Joe Mann deposit is a structurally controlled deposit hosted by the Opawica-Guercheville deformation zone. This major east-west trending deformation corridor is approximately 2km wide and extends for over 200km (Tait, 1992a; Pilote 1998; Leclerc et al. 2012). The structure cuts the mafic volcanic rocks of the Obatogamau Formation in the north part of the Caopatina Segment.
Mineralization
The Corner Bay, Cedar Bay and Golden Eye deposits are located on the flanks of the DLC. These deposits are typical shear hosted copper-gold veins situated within the host anorthosite which is sheared and sericitized over widths of 2 m to 25 m. The mineralization is characterized by veins and/or lenses of massive to semi-massive sulphides associated with a brecciated to locally massive quartz-calcite material. The sulphides assemblage is composed of chalcopyrite, pyrite, and pyrrhotite, with lesser amounts of molybdenite and sphalerite. Late remobilized quartz-chalcopyrite-pyrite veins occur in a common wide halo around the main mineralization zones.
The Devlin deposit is hosted in the Chibougamau Pluton and is characterized by flat-lying undulating magmatic massive sulphide veins occurring at a depth of less than 100 m from surface. The deposit is hosted by a hydrothermal breccia, consisting of massive chalcopyrite-pyrite-quartz +/- carbonate vein, which pinches and swells. Minor hematite and magnetite are present locally; both being erratically distributed.
The gold mineralization at the Joe Mann mine is hosted by decimetre scale quartz-carbonate veins. The veins are mineralized with pyrite, pyrrhotite, and chalcopyrite disposed in lens and veinlets parallel to schistosity, and occasionally visible gold. The veins are dominated by vitreous white quartz with minor plagioclase and iron carbonate. They are intensely brecciated and often boudinaged and folded. Furthermore, these veins are characterized by their laminated or banded structure, consisting of alternating ribbons of quartz and mineralized wall rock. The majority of the vein sulphide mineralization is contained in these wall-rock fragments.
Drilling and Sampling Techniques
Drilling at the Chibougamau Project has been conducted exclusively by diamond drilling. A total of 768 drill holes for a total of 308,314 m have been included for the purposes of the MRE. The distribution of drilling by deposit is summarised below.
| Deposit | Holes | Metres |
| Corner Bay | 403 | 207,920 |
| Cedar Bay | 37 | 33,360 |
| Joe Mann | 51 | 17,622 |
| Devlin | 176 | 19,112 |
| Golden Eye | 101 | 30,300 |
| Total | 768 | 308,314 |
All 35 holes for 17,183 m of diamond drilling completed by Cygnus were NQ2 (50.6 mm diameter) and surveyed using DeviGyro OX NQsupplied by IMDEX out of Val-d’Or, Québec.
Cygnus established a sampling protocol whereby core is typically sampled to a maximum length of one metre and a minimum of 0.3 m to accommodate geological boundaries or changes in mineralization. While this protocol was followed for current drilling, some historical drill holes include intervals shorter than 0.3 m or longer than 1 m.. All Cygnus core was cut in half, with the non-assayed portion stored for future reference if required.
For further detail regarding drilling and sampling, please refer to Appendix B (Table 1 – Section 1).
Sample Analysis Method
All assays completed by Cygnus were conducted by Bureau Veritas Commodities Canada Ltd. Sample preparation and fire assay analysis were done at BV in Timmins, Ontario, and ICP-ES multi-elements analysis was done at BV in Vancouver, B.C.
Samples were weighed, dried, crushed to 70% passing 2 mm, split to 250 g, and pulverized to 85% passing 75 µm. Samples are fire assayed for gold (Au) (50 g and 30 g) and multi-acid digestion ICP-ES finish, for 23 elements (including key elements Ag, Cu, Mo). Samples with visible gold or likely to have gold grains are analysed with metallic screen fire assay. Samples assaying >10.0 g/t Au are re-analysed with a gravimetric finish using a 50 g and 30 g charge. Samples assaying >10% Cu are re-analysed with a sodium peroxide fusion with ICP-ES analysis using a 0.25 g charge.
QA/QC is done in-house by Cygnus’ geologists with oversight from the Senior Geologist. The check samples (blanks and standards – 4% of total samples with another 2% of core duplicates taken on half split core) that were inserted into the sample batches are verified against their certified values and are deemed a pass if they are within 3 standard deviations of the certified value. The duplicates are evaluated against each other to determine mineralization distribution (nugget). If there are large discrepancies in the check samples, then the entire batch is requested to be re-assayed.
For further details regarding drilling and sampling, please refer to Appendix B (Table 1 – Section 1).
Estimation Methodology
Geological and mineralisation constraints were generated in Leapfrog by Cygnus staff, reviewed by the Competent Person, and applied to geostatistics, variography, block modelling, and grade interpolation. Projects are not operational, and results have not been validated against reconciliation data. Post-mineralisation dykes and overburden were assigned zero grade. Parent block sizes were sub-celled and, where appropriate, rotated. Block model validation used standard industry methods, including visual inspection, statistical comparison (ID, NN, OK), swath plots, and wireframe-to-block volume checks. No assumptions were made about correlations between variables.
Grade interpolation followed inverse distance methods (ID² or ID³) with progressively larger search passes. Search ellipses were anisotropic or isotropic depending on the deposit, oriented using dynamic anisotropy or the default coordinate system. Assay capping was applied using basic statistics, histograms, log probability plots, and decile analysis, with composites generally formed at either 2 m or full-width intercepts.
Corner Bay includes nine domains (CBAD1 to CBAD4, CBAD3a, CBUD, WV, WV2, WV3) built using a 1% CuEq cut-off and a 2 m minimum thickness. Parent blocks are 5×5×5 m, sub-celled to 1.25×0.625×1.25 m, and rotated 5°. Capping levels are 16% for Cu, 5 g/t for Au, and 80 g/t for Ag. The composites are 2 m lengths, except full width for CBUD.
Cedar Bay has four domains based on a 1% CuEq cut-off and approximately a 1.5 m minimum thickness. Parent blocks are 5×5×5m, sub-celled to 1.25 m. Capping levels are 40 g/t for Au, 12% for Cu, and 60 g/t for Ag. Composites are full width.
Joe Mann has three domains with a 2 g/t Au cut-off and 1.2 m minimum thickness. Capping levels are 45 g/t for Au, and 2.5% for Cu, with high-grade restrictions of 20 g/t Au over 18.75 m in the x-axis and 75 m in the y-axis of the second interpolation pass. Parent blocks are 5×1×5 m, sub-celled to 1.25×0.25×1.25 m in two block models with different rotations. Composites are full width.
Devlin has four domains (three upper, one lower) based on a 1% Cu cut-off and a 1.8 m minimum thickness. Capping levels are 2.5 g/t for Au and 15% for Cu in the Lower Zone and 1.5 g/t for Au and 10% for Cu in the Upper Zone. Parent blocks are 10×10×2.5 m, sub-celled to 5×5×1.25 m. Composites are full width.
Golden Eye has ten domains based on a 1% CuEq cut-off and a 1.5 m minimum thickness. Parent blocks are 5×5×5 m, sub-celled to 1.25 m. Capping levels are 40 g/t for Au, 12% for Cu, and 60 g/t for Ag. Composites are full width.
Bulk Density
At Corner Bay, 1,667 water immersion density measurements were collected. Mineralisation domains ranged from 2.85 g/cm³ to 3.02 g/cm³, while overburden was assigned 2.0 g/cm³.
| Corner Bay Density Domains | Density (g/cm³) | Domains | Density (g/cm³) |
| Overburden | 2.00 | WV | 2.86 |
| CBAD1 | 3.02 | WV2 | 2.85 |
| CBAD2 | 3.02 | WV3 | 2.93 |
| CBAD3 | 3.00 | CBAD4 | 2.95 |
| CBUD | 2.97 | CBAD3a | 2.90 |
| Adjacent Material | 2.90 |
At Cedar Bay, 23 density measurements from two drill holes gave an average of 2.90 g/cm³, applied to all mineralised blocks.
At Joe Mann, 603 density measurements (2020–2021) ranged from 2.78 g/cm³ to 3.07 g/cm³ in mineralization and 1.28 g/cm³ to 3.24 g/cm³ in adjacent material; 2.90 g/cm³ was assigned to mineralization.
At Devlin, 52 samples (2013–2014) averaged 2.87 g/cm³; densities were set at 2.90 g/cm³ (Lower Zone), 2.85 g/cm³ (Upper Zone), and 2.77 g/cm³ (background).
At Golden Eye, similar to Cedar Bay, 2.90 t/m³ was assigned to mineralised blocks, consistent with host rock and limited density data.
It is the Competent Person’s opinion that with the exception of a small number of outliers, these are reasonable densities for these types of mineralization and host rocks.
Classification
At Corner Bay, Indicated Mineral Resources are defined by areas with at least three drill holes spaced up to approximately 60 m (100% variogram range), and Inferred Mineral Resources by drill holes spaced from approximately 60 m to 120 m. Class boundaries were locally adjusted where the drill spacing criteria were not met to consider geological understanding, grade continuity, zone thickness, and the creation of cohesive class boundaries.
At Cedar Bay, Indicated Mineral Resources are defined by drill holes spaced at up to approximately 60 m apart and Inferred Mineral Resources by drill holes spaced at approximately 60 m to 120 m apart, with modifications for geological understanding, grade continuity, and cohesive boundaries. Some lower-grade material was included to preserve continuity.
At Golden Eye, Indicated Mineral Resources are defined by drill holes spaced at up to approximately 50 m apart and Inferred Mineral Resources by drill holes spaced at approximately 50 m to 100 m apart, with adjustments for geological understanding, grade continuity, and cohesive boundaries. Some lower-grade material was included to preserve continuity.
At Devlin, Measured Mineral Resources are defined within 15 m of underground openings, Indicated Mineral Resources by drill holes spaced at up to approximately 60 m apart, and Inferred Mineral Resources by drill holes spaced at approximately 60 m to 100 m apart. Boundaries were adjusted for geological understanding, copper grade continuity, and cohesion, with some lower-grade material included.
At Joe Mann, only Inferred Mineral Resources are defined due to wider drill spacing (20 m to 100 m) and in consideration of observed grade continuity and variability based on historical mining. Lower-grade material was included in the Main01 wireframe design to preserve continuity.
Mining Factors
The anticipated mining method for sub-vertical dipping deposits: Corner Bay, Cedar Bay, Golden Eye and Joe Man is longitudinal long hole with pillar (“LHP”). This mining method has been used to identify sensible SMU units when determining block sizes in the model.
The anticipated mining method for Devlin is either 1) drift and fill with slash; and 2) room and pillar with partial pillar recovery.
SLR prepared underground reporting shapes from indicator shells built at the respective deposit breakeven cut-off grade for Mineral Resource reporting. Some incremental material within the shapes was included to preserve continuity. Minimum thickness was considered and applied at the wireframing stage.
Resources are calculated as in-situ resources. Conservative factors used to calculate the underground reporting cut-off are based on previous operating cost basis for the mill, recoveries and general and administration (G&A) costs and metal prices below:
| Costs | Cedar Bay | Golden Eye | Corner Bay | Devlin | Joe Mann |
| Mining Cost (C$/t milled) | $125 | $125 | $110 | $155 | $122 |
| Processing Cost (C$/t milled) | $27 | $27 | $31 | $23 | $27 |
| Transport (C$/t milled) | $2 | $1 | $12 | $18 | $19 |
| G&A (C$/t milled) | $6 | $6 | $8 | $0 | $6 |
Note: G&A at Devlin was transferred to Corner Bay.
Metallurgical Assumptions
Metallurgical assumptions vary by deposit and element; assumed metallurgical recoveries by deposit and element are summarised in the table below.
| Metallurgical Assumptions | |||||
| Element | Cedar Bay | Golden Eye | Corner Bay | Devlin | Joe Mann |
| Au | 87% | 87% | 78% | 73% | 84% |
| Cu | 91% | 91% | 93% | 96% | 95% |
| Ag | 80% | 80% | 80% | 80% | 80% |
Metallurgical recovery factors have been applied based upon historical production at the Chibougamau Processing Facility and recent metallurgical testing results (refer to announcement dated 28 January 2025).
Other modifying factors considered to date
Other modifying factors such as permitting, environmental considerations, and social/community impacts are still being considered. The Competent Person considers the modifying factors to be sufficiently understood to support the classification of Mineral Resources.
Metal Equivalents
Metal equivalents for the MRE have been calculated based on the following assumptions:
The following copper and gold equivalents formulas have been used:
It is the Company’s view that all elements in the metal equivalent calculations have a reasonable potential to be recovered and sold.
Reporting Cut-Off Values
The following copper equivalent (CuEq) and gold equivalent (AuEq) cut-off values have been applied for reporting:
About Cygnus Metals
Cygnus Metals Limited is a diversified critical minerals exploration and development company with projects in Quebec, Canada and Western Australia. The Company is dedicated to advancing its Chibougamau Copper-Gold Project in Quebec with an aggressive exploration program to drive resource growth and develop a hub-and-spoke operation model with its centralised processing facility. In addition, Cygnus has quality lithium assets with significant exploration upside in the world-class James Bay district in Quebec, and REE and base metal projects in Western Australia. The Cygnus team has a proven track record of turning exploration success into production enterprises and creating shareholder value.
LaFleur Minerals Inc. (CSE: LFLR) (OTCQB: LFLRF) (FSE: 3WK0) is p... READ MORE
GoldHaven Resources Corp. (CSE: GOH) (OTCQB: GHVNF) (FSE: 4QS) is... READ MORE
Maple Gold Mines Ltd. (TSX-V: MGM) (OTCQX: MGMLF) (FSE: M3G0) ann... READ MORE
Eastport Critical Metals Corp. (TSX-V: EVI) (OTCQB: EVIIF) is pl... READ MORE
Cambria Gold Mines Inc. (TSX-V: CAMB) (OTCQX: CAMVF) is pleased t... READ MORE


