


Cerro de Pasco Resources Inc. (CSE: CDPR) (OTCQB: GPPRF) (FRA: N8HP) is pleased to report assay results for an additional eight drill holes from the Quiulacocha Tailings Project in Central Peru.
Highlights – All intersections are in core lengths from surface and correspond to the predominant silver-zinc-lead zone in the northern section of the Quiulacocha deposit:
“Today’s drillhole results are highly encouraging and exceed our initial expectations,” stated Guy Goulet, CEO. “Drillholes intersected Cu-Ag-Au tailings with grades reaching 0.53% Cu, 0.45 g/t Au, and 95.8 g/t Ag, with thicker layers and higher grades concentrated in the southern part of the drilling area. Notably, lead and gallium content significantly increase towards the South, with grades exceeding 1% Pb and 100 g/t Ga in several instances. Gallium grades in the South average between 59 and 84 g/t, nearly double the northern averages of 21 to 41 g/t, demonstrating a clear correlation with the lead mineral galena.”
“The consistent and increasing presence of gallium, a critical metal essential for advanced electronics and renewable energy technologies, adds significant potential to the project’s economics. Gallium’s importance has risen sharply following China’s recent export restrictions to the US and other nations, which have caused prices to surge and underscored its strategic value in global supply chains. This geopolitical shift highlights the growing demand for secure and diversified sources of gallium, positioning our findings as particularly timely.”
The results demonstrate that the metal content is continuous at depth and laterally across 800 meters of the drilled area (Figure 1). The assay results for each of the eight drill holes are presented in Tables 1 to 8.
The Iron results also indicate a consistent presence of pyrite throughout the deposit. Pyrite (indicatively 50% of the tailings) may represent a valuable by-product for the project. The upcoming metallurgical test work program will also evaluate the potential for pyrite recovery, including estimated grade, by-products and impurities.
Figure 1: 40-hole Quiulacocha Drill Program showing drillholes related to this press release
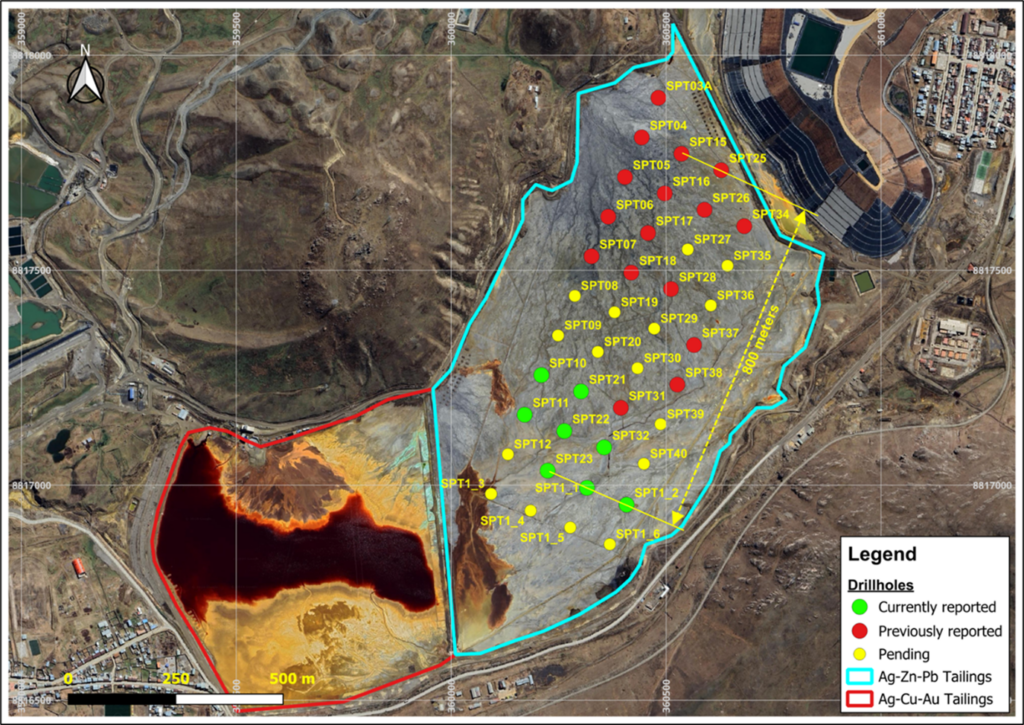
Table 1. Assay results, Drillhole SPT10
| Drillholes: SPT10 | ||||||||||
| From | To | Ag (oz/t) | Ag (g/t) | % Zn | % Pb | % Cu | Au (g/t) | Ga (g/t) | In (g/t) | % Fe |
| 0 | 1 | 1.63 | 50.70 | 0.51 | 0.65 | 0.05 | 0.04 | 58.76 | 22.68 | 27.04 |
| 1 | 2 | 1.19 | 37.01 | 0.94 | 0.58 | 0.03 | 0.03 | 42.92 | 21.21 | 26.28 |
| 2 | 3 | 1.47 | 45.72 | 1.11 | 0.77 | 0.04 | 0.02 | 75.84 | 7.32 | 25.93 |
| 3 | 4 | 1.22 | 37.95 | 0.83 | 0.54 | 0.03 | 0.02 | 45.12 | 21.33 | 27.42 |
| 4 | 5 | 1.22 | 37.95 | 0.84 | 0.54 | 0.03 | 0.02 | 48.60 | 20.85 | 26.43 |
| 5 | 6 | 1.27 | 39.50 | 0.87 | 0.60 | 0.04 | 0.02 | 47.76 | 22.52 | 27.06 |
| 6 | 7 | 1.42 | 44.17 | 1.01 | 0.64 | 0.05 | 0.03 | 58.96 | 22.97 | 28.60 |
| 7 | 8 | 1.45 | 45.10 | 1.02 | 0.70 | 0.05 | 0.02 | 60.56 | 22.37 | 28.59 |
| 8 | 9 | 1.46 | 45.41 | 1.15 | 0.64 | 0.06 | 0.02 | 70.53 | 22.79 | 26.00 |
| 9 | 10 | 1.48 | 46.03 | 1.25 | 0.75 | 0.07 | 0.03 | 66.88 | 22.21 | 26.21 |
| 10 | 11 | 1.65 | 51.32 | 1.41 | 1.07 | 0.09 | 0.03 | 68.68 | 11.56 | 26.90 |
| 11 | 12 | 1.38 | 42.92 | 1.14 | 0.69 | 0.06 | 0.03 | 58.30 | 19.99 | 26.95 |
| 12 | 13 | 1.73 | 53.81 | 2.02 | 1.95 | 0.10 | 0.03 | 97.38 | 10.24 | 25.84 |
| 13 | 14 | 1.70 | 52.88 | 1.86 | 1.73 | 0.09 | 0.03 | 95.79 | 13.16 | 24.55 |
| 14 | 15 | 1.92 | 59.72 | 2.18 | 2.54 | 0.15 | 0.05 | 105.00 | 15.80 | 24.40 |
| 15 | 16 | 1.52 | 47.28 | 1.48 | 1.11 | 0.10 | 0.05 | 53.80 | 29.86 | 27.14 |
| 16 | 17 | 1.37 | 42.61 | 1.28 | 0.85 | 0.08 | 0.05 | 50.12 | 20.76 | 27.03 |
| 17 | 18 | 1.33 | 41.37 | 1.18 | 0.64 | 0.07 | 0.06 | 41.84 | 18.58 | 27.25 |
| 18 | 19 | 1.28 | 39.81 | 1.29 | 0.63 | 0.09 | 0.09 | 35.51 | 18.88 | 27.26 |
| 19 | 20 | 1.32 | 41.06 | 1.37 | 0.67 | 0.09 | 0.09 | 32.08 | 18.08 | 27.27 |
| 20 | 21 | 1.36 | 42.30 | 1.43 | 0.75 | 0.09 | 0.07 | 42.68 | 19.15 | 27.03 |
| 21 | 22 | 1.52 | 47.28 | 1.43 | 0.68 | 0.16 | 0.18 | 51.61 | 20.32 | 27.24 |
| 22 | 23 | 1.42 | 44.17 | 1.21 | 0.64 | 0.13 | 0.18 | 47.43 | 17.72 | 26.98 |
| 23 | 24 | 1.26 | 39.19 | 1.16 | 0.44 | 0.09 | 0.15 | 19.93 | 15.05 | 28.72 |
| 24 | 25 | 1.40 | 43.54 | 1.15 | 0.57 | 0.13 | 0.20 | 41.14 | 15.46 | 26.35 |
| 25 | 26 | 1.47 | 45.72 | 1.32 | 0.60 | 0.15 | 0.20 | 43.12 | 18.46 | 27.78 |
| 26 | 27 | 1.68 | 52.25 | 1.29 | 0.70 | 0.20 | 0.37 | 60.50 | 18.28 | 26.40 |
| 27 | 28 | 1.98 | 61.58 | 1.74 | 1.30 | 0.24 | 0.45 | 90.24 | 10.28 | 25.98 |
| 28 | 29 | 1.76 | 54.74 | 1.73 | 1.02 | 0.21 | 0.44 | 61.78 | 21.97 | 25.35 |
| 29 | 30 | 1.90 | 59.10 | 1.35 | 0.61 | 0.21 | 0.42 | 41.32 | 16.57 | 33.71 |
| 30 | 31 | 2.19 | 68.12 | 1.65 | 1.37 | 0.27 | 0.44 | 79.02 | 9.24 | 25.39 |
| Mean | 1.51 | 47.11 | 1.30 | 0.87 | 0.10 | 0.12 | 57.85 | 18.25 | 26.94 | |
Table 2. Assay results, Drillhole SPT11
| Drillholes: SPT11 | ||||||||||
| From | To | Ag (oz/t) | Ag (g/t) | % Zn | % Pb | % Cu | Au (g/t) | Ga (g/t) | In (g/t) | % Fe |
| 0 | 1 | 1.29 | 40.12 | 1.25 | 1.37 | 0.05 | 0.04 | 75.01 | 19.92 | 22.83 |
| 1 | 2 | 1.03 | 32.04 | 1.32 | 0.83 | 0.03 | 0.02 | 44.94 | 23.46 | 25.53 |
| 2 | 3 | 1.41 | 43.86 | 1.17 | 1.29 | 0.05 | 0.02 | 111.00 | 19.84 | 22.42 |
| 3 | 4 | 1.29 | 40.12 | 1.03 | 0.80 | 0.05 | 0.03 | 88.79 | 30.66 | 25.68 |
| 4 | 5 | 1.22 | 37.95 | 1.17 | 0.92 | 0.04 | 0.03 | 103.00 | 21.48 | 24.35 |
| 5 | 6 | 1.24 | 38.57 | 0.97 | 0.74 | 0.04 | 0.02 | 89.88 | 20.80 | 26.66 |
| 6 | 7 | 1.14 | 35.46 | 0.92 | 0.67 | 0.05 | 0.03 | 72.91 | 18.48 | 25.70 |
| 7 | 8 | 1.26 | 39.19 | 1.07 | 0.73 | 0.05 | 0.02 | 77.53 | 18.68 | 26.01 |
| 8 | 9 | 1.26 | 39.19 | 1.02 | 0.70 | 0.05 | 0.02 | 71.36 | 19.52 | 25.99 |
| 9 | 10 | 1.53 | 47.59 | 1.19 | 0.86 | 0.06 | 0.02 | 72.74 | 18.32 | 24.88 |
| 10 | 11 | 1.55 | 48.21 | 1.28 | 1.09 | 0.08 | 0.03 | 69.96 | 7.16 | 26.90 |
| 11 | 12 | 1.52 | 47.28 | 0.94 | 0.71 | 0.06 | 0.03 | 42.29 | 21.04 | 28.07 |
| 12 | 13 | 1.55 | 48.21 | 1.25 | 1.07 | 0.06 | 0.03 | 62.16 | 24.88 | 26.59 |
| 13 | 14 | 1.43 | 44.48 | 1.39 | 1.22 | 0.08 | 0.02 | 85.32 | 6.60 | 24.34 |
| 14 | 15 | 1.50 | 46.66 | 1.27 | 0.83 | 0.06 | 0.03 | 70.52 | 7.68 | 26.53 |
| 15 | 16 | 1.47 | 45.72 | 1.52 | 1.64 | 0.16 | 0.07 | 92.00 | 11.96 | 26.17 |
| 16 | 17 | 1.45 | 45.10 | 1.12 | 0.71 | 0.09 | 0.07 | 47.52 | 22.30 | 28.58 |
| 17 | 18 | 1.27 | 39.50 | 1.10 | 0.58 | 0.10 | 0.10 | 35.20 | 21.48 | 28.90 |
| 18 | 19 | 1.35 | 41.99 | 1.43 | 0.60 | 0.10 | 0.08 | 33.44 | 20.52 | 27.42 |
| 19 | 20 | 1.52 | 47.28 | 1.19 | 0.70 | 0.19 | 0.21 | 55.52 | 20.35 | 24.90 |
| 20 | 21 | 1.61 | 50.08 | 1.45 | 0.60 | 0.20 | 0.19 | 43.56 | 21.05 | 28.10 |
| 21 | 22 | 1.58 | 49.14 | 1.03 | 0.77 | 0.22 | 0.29 | 87.64 | 22.46 | 27.54 |
| 22 | 23 | 1.52 | 47.28 | 1.32 | 0.64 | 0.16 | 0.19 | 40.28 | 20.83 | 27.72 |
| 23 | 24 | 1.57 | 48.83 | 1.81 | 0.68 | 0.17 | 0.18 | 36.40 | 23.72 | 28.97 |
| 24 | 25 | 0.93 | 28.93 | 1.05 | 0.65 | 0.03 | 0.02 | 37.84 | 4.92 | 25.78 |
| 25 | 26 | 0.87 | 27.06 | 1.11 | 0.56 | 0.02 | 0.02 | 41.64 | 20.65 | 25.70 |
| 26 | 27 | 1.66 | 51.63 | 1.50 | 0.67 | 0.23 | 0.22 | 49.36 | 21.73 | 26.22 |
| Mean | 1.37 | 42.65 | 1.22 | 0.84 | 0.09 | 0.08 | 64.36 | 18.91 | 26.24 | |
Table 3. Assay results, Drillhole SPT21
| Drillholes: SPT21 | ||||||||||
| From | To | Ag (oz/t) | Ag (g/t) | % Zn | % Pb | % Cu | Au (g/t) | Ga (g/t) | In (g/t) | % Fe |
| 0 | 1 | 1.33 | 41.37 | 0.85 | 1.20 | 0.06 | 0.04 | 73.17 | 10.60 | 25.53 |
| 1 | 2 | 1.23 | 38.26 | 1.35 | 1.16 | 0.05 | 0.04 | 63.54 | 24.31 | 25.87 |
| 2 | 3 | 1.31 | 40.75 | 1.32 | 1.28 | 0.05 | 0.04 | 75.37 | 23.22 | 25.11 |
| 3 | 4 | 1.23 | 38.26 | 1.05 | 0.68 | 0.03 | 0.03 | 46.45 | 22.86 | 27.29 |
| 4 | 5 | 1.19 | 37.01 | 1.06 | 0.66 | 0.03 | 0.03 | 50.95 | 21.00 | 25.98 |
| 5 | 6 | 1.41 | 43.86 | 1.09 | 0.60 | 0.04 | 0.03 | 56.01 | 22.52 | 28.73 |
| 6 | 7 | 1.33 | 41.37 | 1.02 | 0.58 | 0.04 | 0.03 | 62.08 | 21.95 | 27.13 |
| 7 | 8 | 1.16 | 36.08 | 0.86 | 0.47 | 0.03 | 0.03 | 52.49 | 21.04 | 27.22 |
| 8 | 9 | 1.47 | 45.72 | 1.27 | 0.80 | 0.06 | 0.03 | 76.16 | 24.86 | 24.87 |
| 9 | 10 | 1.51 | 46.97 | 1.33 | 1.02 | 0.07 | 0.03 | 76.65 | 24.64 | 26.81 |
| 10 | 11 | 1.46 | 45.41 | 1.14 | 0.71 | 0.06 | 0.02 | 67.28 | 21.31 | 26.85 |
| 11 | 12 | 1.53 | 47.59 | 1.20 | 0.73 | 0.06 | 0.02 | 69.78 | 22.87 | 26.03 |
| 12 | 13 | 1.70 | 52.88 | 1.89 | 2.07 | 0.11 | 0.04 | 107.00 | 13.20 | 24.98 |
| 13 | 14 | 1.72 | 53.50 | 1.27 | 0.73 | 0.07 | 0.02 | 75.42 | 22.74 | 26.18 |
| 14 | 15 | 1.52 | 47.28 | 1.14 | 1.31 | 0.09 | 0.04 | 78.48 | 11.56 | 26.55 |
| 15 | 16 | 1.72 | 53.50 | 1.13 | 0.78 | 0.08 | 0.03 | 71.12 | 23.32 | 28.12 |
| 16 | 17 | 1.34 | 41.68 | 1.10 | 0.68 | 0.06 | 0.04 | 49.04 | 20.43 | 28.53 |
| 17 | 18 | 1.42 | 44.17 | 1.27 | 0.67 | 0.08 | 0.07 | 49.40 | 20.79 | 28.47 |
| 18 | 19 | 1.38 | 42.92 | 1.35 | 0.72 | 0.10 | 0.07 | 43.00 | 21.04 | 28.19 |
| 19 | 20 | 1.42 | 44.17 | 1.65 | 0.87 | 0.10 | 0.08 | 42.60 | 22.06 | 29.85 |
| 20 | 21 | 1.50 | 46.66 | 1.29 | 0.65 | 0.18 | 0.27 | 49.12 | 19.83 | 27.54 |
| 21 | 22 | 1.40 | 43.54 | 1.39 | 0.66 | 0.10 | 0.10 | 42.00 | 18.84 | 27.90 |
| 22 | 23 | 1.45 | 45.10 | 1.36 | 0.64 | 0.11 | 0.11 | 41.44 | 18.47 | 29.22 |
| 23 | 24 | 1.46 | 45.41 | 1.44 | 0.65 | 0.13 | 0.16 | 43.44 | 20.62 | 27.34 |
| 24 | 25 | 1.46 | 45.41 | 1.42 | 0.60 | 0.15 | 0.20 | 40.88 | 18.87 | 27.53 |
| 25 | 26 | 1.46 | 45.41 | 1.85 | 0.52 | 0.22 | 0.20 | 41.56 | 19.39 | 24.49 |
| 26 | 27 | 1.54 | 47.90 | 1.61 | 0.54 | 0.19 | 0.25 | 40.48 | 18.93 | 26.87 |
| Mean | 1.43 | 44.52 | 1.29 | 0.81 | 0.09 | 0.08 | 58.70 | 20.42 | 27.01 | |
Table 4. Assay results, Drillhole SPT22
| Drillholes: SPT22 | ||||||||||
| From | To | Ag (oz/t) | Ag (g/t) | % Zn | % Pb | % Cu | Au (g/t) | Ga (g/t) | In (g/t) | % Fe |
| 0 | 1 | 1.58 | 49.14 | 0.41 | 1.58 | 0.03 | 0.05 | 96.32 | 23.48 | 20.47 |
| 1 | 2 | 1.43 | 44.48 | 1.44 | 1.21 | 0.05 | 0.02 | 120.00 | 13.44 | 24.04 |
| 2 | 3 | 1.34 | 41.68 | 1.25 | 1.08 | 0.05 | 0.02 | 105.00 | 30.55 | 24.59 |
| 3 | 4 | 1.19 | 37.01 | 1.33 | 1.13 | 0.05 | 0.02 | 122.00 | 12.32 | 24.26 |
| 4 | 5 | 1.36 | 42.30 | 1.02 | 0.77 | 0.04 | 0.02 | 79.97 | 25.76 | 27.14 |
| 5 | 6 | 1.32 | 41.06 | 1.03 | 0.63 | 0.04 | 0.02 | 59.72 | 22.06 | 27.73 |
| 6 | 7 | 1.54 | 47.90 | 1.08 | 0.66 | 0.05 | 0.03 | 61.04 | 21.77 | 29.28 |
| 7 | 8 | 1.50 | 46.66 | 1.11 | 0.68 | 0.05 | 0.02 | 64.52 | 21.07 | 29.25 |
| 8 | 9 | 1.40 | 43.54 | 1.24 | 0.85 | 0.06 | 0.02 | 56.12 | 21.43 | 26.22 |
| 9 | 10 | 1.46 | 45.41 | 1.16 | 0.85 | 0.06 | 0.02 | 65.96 | 23.44 | 28.95 |
| 10 | 11 | 1.74 | 54.12 | 1.70 | 1.62 | 0.11 | 0.03 | 91.64 | 13.32 | 26.23 |
| 11 | 12 | 1.58 | 49.14 | 1.62 | 1.59 | 0.08 | 0.03 | 96.92 | 13.68 | 27.30 |
| 12 | 13 | 1.76 | 54.74 | 1.65 | 1.80 | 0.10 | 0.03 | 100.00 | 39.16 | 25.94 |
| 13 | 14 | 1.67 | 51.94 | 1.11 | 0.82 | 0.07 | 0.03 | 74.00 | 25.16 | 27.39 |
| 14 | 15 | 1.59 | 49.45 | 1.20 | 0.95 | 0.08 | 0.03 | 63.05 | 24.18 | 26.87 |
| 15 | 16 | 1.48 | 46.03 | 1.44 | 1.20 | 0.10 | 0.07 | 56.32 | 26.60 | 28.52 |
| 16 | 17 | 1.58 | 49.14 | 1.45 | 1.22 | 0.09 | 0.05 | 57.42 | 23.30 | 28.14 |
| 17 | 18 | 1.43 | 44.48 | 1.20 | 0.78 | 0.08 | 0.06 | 45.85 | 21.96 | 27.39 |
| 18 | 19 | 1.25 | 38.88 | 1.06 | 0.71 | 0.09 | 0.08 | 37.71 | 21.34 | 26.73 |
| 19 | 20 | 1.36 | 42.30 | 1.15 | 0.81 | 0.09 | 0.07 | 53.05 | 24.58 | 27.13 |
| 20 | 21 | 1.51 | 46.97 | 1.37 | 0.73 | 0.11 | 0.08 | 37.97 | 21.90 | 28.88 |
| 21 | 22 | 1.55 | 48.21 | 1.49 | 0.97 | 0.13 | 0.07 | 45.45 | 24.83 | 29.14 |
| 22 | 23 | 1.27 | 39.50 | 1.03 | 0.59 | 0.11 | 0.09 | 31.33 | 18.19 | 27.87 |
| 23 | 24 | 1.45 | 45.10 | 1.38 | 0.63 | 0.13 | 0.08 | 30.23 | 21.66 | 28.75 |
| 24 | 25 | 1.52 | 47.28 | 1.52 | 0.60 | 0.17 | 0.12 | 36.21 | 21.02 | 28.37 |
| 25 | 26 | 1.59 | 49.45 | 1.22 | 1.13 | 0.32 | 0.25 | 96.01 | 31.18 | 25.16 |
| Mean | 1.48 | 46.00 | 1.26 | 0.98 | 0.09 | 0.05 | 68.61 | 22.59 | 26.99 | |
Table 5. Assay results, Drillhole SPT23
| Drillholes: SPT23 | ||||||||||
| From | To | Ag (oz/t) | Ag (g/t) | % Zn | % Pb | % Cu | Au (g/t) | Ga (g/t) | In (g/t) | % Fe |
| 0 | 1 | 2.49 | 77.45 | 2.88 | 1.47 | 0.07 | 0.04 | 102.00 | 10.84 | 22.79 |
| 1 | 2 | 1.91 | 59.41 | 3.15 | 1.71 | 0.07 | 0.04 | 103.00 | 9.76 | 23.68 |
| 2 | 3 | 2.51 | 78.07 | 3.14 | 1.80 | 0.09 | 0.04 | 104.00 | 10.04 | 24.96 |
| 3 | 4 | 1.75 | 54.43 | 2.23 | 1.48 | 0.07 | 0.03 | 136.00 | 9.80 | 24.02 |
| 4 | 5 | 1.55 | 48.21 | 1.40 | 1.17 | 0.06 | 0.02 | 140.00 | 8.84 | 24.10 |
| 5 | 6 | 1.49 | 46.34 | 1.14 | 0.78 | 0.05 | 0.02 | 73.69 | 6.76 | 25.83 |
| 6 | 7 | 1.53 | 47.59 | 1.14 | 0.82 | 0.05 | 0.02 | 87.49 | 6.88 | 26.98 |
| 7 | 8 | 1.77 | 55.05 | 1.42 | 0.82 | 0.07 | 0.03 | 72.06 | 5.68 | 26.71 |
| 8 | 9 | 1.79 | 55.68 | 1.48 | 0.76 | 0.07 | 0.03 | 63.90 | 5.96 | 26.22 |
| 9 | 10 | 1.68 | 52.25 | 1.34 | 0.87 | 0.08 | 0.03 | 83.04 | 6.20 | 26.31 |
| 10 | 11 | 1.69 | 52.56 | 1.29 | 0.72 | 0.07 | 0.03 | 57.51 | 21.39 | 25.49 |
| 11 | 12 | 1.70 | 52.88 | 1.41 | 1.03 | 0.08 | 0.03 | 74.48 | 22.95 | 26.61 |
| 12 | 13 | 1.71 | 53.19 | 1.41 | 1.07 | 0.08 | 0.03 | 77.85 | 15.00 | 26.94 |
| 13 | 14 | 1.91 | 59.41 | 1.77 | 2.00 | 0.13 | 0.04 | 104.00 | 15.84 | 24.95 |
| 14 | 15 | 1.57 | 48.83 | 1.80 | 2.04 | 0.13 | 0.05 | 123.00 | 11.96 | 25.14 |
| 15 | 16 | 1.27 | 39.50 | 1.28 | 1.30 | 0.11 | 0.08 | 59.71 | 22.68 | 26.51 |
| 16 | 17 | 1.38 | 42.92 | 1.11 | 0.93 | 0.11 | 0.09 | 56.41 | 24.31 | 31.36 |
| 17 | 18 | 1.33 | 41.37 | 1.19 | 1.20 | 0.14 | 0.08 | 68.82 | 24.74 | 26.28 |
| 18 | 19 | 1.23 | 38.26 | 1.17 | 0.89 | 0.12 | 0.08 | 50.78 | 22.20 | 25.84 |
| 19 | 20 | 1.24 | 38.57 | 1.14 | 0.86 | 0.14 | 0.09 | 57.55 | 20.99 | 25.79 |
| 20 | 21 | 1.41 | 43.86 | 1.30 | 0.76 | 0.16 | 0.11 | 50.89 | 20.61 | 28.34 |
| 21 | 22 | 1.43 | 44.48 | 1.28 | 0.71 | 0.16 | 0.10 | 49.64 | 20.55 | 28.18 |
| 22 | 23 | 1.39 | 43.23 | 1.25 | 0.68 | 0.16 | 0.14 | 50.93 | 20.37 | 27.47 |
| 23 | 24 | 1.42 | 44.17 | 1.29 | 0.81 | 0.23 | 0.20 | 69.26 | 19.98 | 25.23 |
| 24 | 25 | 1.52 | 47.28 | 1.29 | 0.79 | 0.21 | 0.20 | 76.85 | 22.89 | 27.06 |
| 25 | 26 | 2.12 | 65.94 | 1.29 | 1.62 | 0.30 | 0.41 | 151.00 | 17.64 | 25.45 |
| 26 | 27 | 1.95 | 60.65 | 1.28 | 1.03 | 0.26 | 0.38 | 84.20 | 22.42 | 27.05 |
| 27 | 28 | 3.08 | 95.80 | 1.07 | 1.12 | 0.53 | 0.42 | 99.75 | 20.33 | 28.50 |
| Mean | 1.71 | 53.12 | 1.53 | 1.12 | 0.14 | 0.10 | 83.14 | 15.99 | 26.21 | |
Table 6. Assay results, Drillhole SPT32
| Drillholes: SPT32 | ||||||||||
| From | To | Ag (oz/t) | Ag (g/t) | % Zn | % Pb | % Cu | Au (g/t) | Ga (g/t) | In (g/t) | % Fe |
| 0 | 1 | 1.87 | 58.16 | 1.67 | 2.04 | 0.10 | 0.03 | 118.00 | 36.03 | 22.78 |
| 1 | 2 | 1.84 | 57.23 | 1.43 | 1.50 | 0.07 | 0.03 | 123.00 | 37.46 | 23.16 |
| 2 | 3 | 1.21 | 37.64 | 1.15 | 0.96 | 0.05 | 0.02 | 111.00 | 34.57 | 24.65 |
| 3 | 4 | 1.26 | 39.19 | 1.29 | 1.21 | 0.06 | 0.02 | 133.00 | 41.88 | 24.16 |
| 4 | 5 | 1.25 | 38.88 | 1.01 | 0.66 | 0.04 | 0.02 | 93.50 | 28.79 | 26.92 |
| 5 | 6 | 1.47 | 45.72 | 0.96 | 0.62 | 0.04 | 0.02 | 66.35 | 23.97 | 26.83 |
| 6 | 7 | 1.67 | 51.94 | 1.21 | 0.80 | 0.06 | 0.02 | 82.81 | 28.61 | 27.36 |
| 7 | 8 | 1.79 | 55.68 | 1.18 | 0.68 | 0.07 | 0.03 | 65.08 | 25.52 | 28.21 |
| 8 | 9 | 1.62 | 50.39 | 1.19 | 0.67 | 0.07 | 0.03 | 66.79 | 26.12 | 25.88 |
| 9 | 10 | 1.65 | 51.32 | 1.17 | 0.71 | 0.06 | 0.02 | 55.62 | 22.61 | 26.96 |
| 10 | 11 | 1.61 | 50.08 | 1.25 | 0.94 | 0.08 | 0.03 | 63.67 | 26.12 | 26.11 |
| 11 | 12 | 1.53 | 47.59 | 1.25 | 0.97 | 0.06 | 0.03 | 69.65 | 27.23 | 27.06 |
| 12 | 13 | 1.89 | 58.79 | 1.91 | 2.16 | 0.12 | 0.03 | 133.00 | 43.14 | 25.07 |
| 13 | 14 | 1.67 | 51.94 | 1.73 | 1.71 | 0.11 | 0.05 | 83.69 | 37.40 | 26.40 |
| 14 | 15 | 1.60 | 49.77 | 1.28 | 0.96 | 0.07 | 0.03 | 59.62 | 24.89 | 25.53 |
| 15 | 16 | 1.53 | 47.59 | 1.33 | 1.18 | 0.09 | 0.04 | 67.45 | 28.40 | 26.22 |
| 16 | 17 | 1.48 | 46.03 | 1.21 | 0.99 | 0.10 | 0.06 | 58.93 | 27.39 | 26.95 |
| 17 | 18 | 1.42 | 44.17 | 1.34 | 1.03 | 0.10 | 0.06 | 57.33 | 27.04 | 26.98 |
| 18 | 19 | 1.41 | 43.86 | 1.20 | 1.02 | 0.10 | 0.08 | 53.20 | 24.88 | 26.94 |
| 19 | 20 | 1.53 | 47.59 | 1.64 | 1.62 | 0.11 | 0.06 | 71.85 | 34.97 | 26.80 |
| 20 | 21 | 1.50 | 46.66 | 1.17 | 0.88 | 0.10 | 0.06 | 48.75 | 25.30 | 28.19 |
| 21 | 22 | 1.35 | 41.99 | 1.08 | 0.86 | 0.10 | 0.07 | 40.70 | 22.42 | 28.15 |
| 22 | 23 | 1.35 | 41.99 | 1.06 | 0.76 | 0.10 | 0.07 | 48.43 | 24.44 | 27.13 |
| 23 | 24 | 1.39 | 43.23 | 1.21 | 1.04 | 0.11 | 0.08 | 48.84 | 4.88 | 28.05 |
| 24 | 25 | 1.27 | 39.50 | 0.99 | 0.52 | 0.09 | 0.09 | 23.45 | 17.29 | 29.22 |
| 25 | 26 | 1.50 | 46.66 | 1.34 | 0.62 | 0.10 | 0.07 | 27.59 | 20.74 | 30.85 |
| 26 | 27 | 1.36 | 42.30 | 1.04 | 0.52 | 0.09 | 0.07 | 25.52 | 16.95 | 28.83 |
| 27 | 28 | 1.35 | 41.99 | 1.01 | 0.55 | 0.11 | 0.07 | 35.60 | 17.88 | 28.27 |
| 28 | 29 | 1.36 | 42.30 | 0.92 | 0.54 | 0.09 | 0.07 | 26.53 | 16.81 | 28.96 |
| 29 | 30 | 1.45 | 45.10 | 1.68 | 0.55 | 0.11 | 0.07 | 23.28 | 20.82 | 29.36 |
| 30 | 31 | 1.54 | 47.90 | 1.12 | 0.47 | 0.15 | 0.08 | 25.92 | 16.41 | 28.66 |
| Mean | 1.51 | 46.88 | 1.26 | 0.96 | 0.09 | 0.05 | 64.78 | 26.16 | 26.99 | |
Table 7. Assay results, Drillhole SPT1_1
| Drillholes: SPT1_1 | ||||||||||
| From | To | Ag (oz/t) | Ag (g/t) | % Zn | % Pb | % Cu | Au (g/t) | Ga (g/t) | In (g/t) | % Fe |
| 0 | 1 | 2.15 | 66.87 | 1.90 | 1.09 | 0.08 | 0.04 | 71.84 | 8.52 | 25.07 |
| 1 | 2 | 1.51 | 46.97 | 1.94 | 1.29 | 0.08 | 0.05 | 117.00 | 9.36 | 23.33 |
| 2 | 3 | 1.60 | 49.77 | 1.64 | 1.25 | 0.08 | 0.04 | 142.00 | 10.08 | 24.85 |
| 3 | 4 | 1.41 | 43.86 | 1.51 | 1.16 | 0.07 | 0.03 | 134.00 | 8.64 | 23.67 |
| 4 | 5 | 1.31 | 40.75 | 1.21 | 0.85 | 0.06 | 0.03 | 113.00 | 8.68 | 24.54 |
| 5 | 6 | 1.45 | 45.10 | 1.30 | 0.86 | 0.06 | 0.03 | 101.00 | 7.84 | 25.09 |
| 6 | 7 | 1.88 | 58.47 | 1.63 | 0.88 | 0.07 | 0.02 | 72.81 | 6.28 | 26.22 |
| 7 | 8 | 1.86 | 57.85 | 1.55 | 0.79 | 0.07 | 0.03 | 69.06 | 5.92 | 25.66 |
| 8 | 9 | 1.68 | 52.25 | 1.32 | 0.79 | 0.07 | 0.03 | 68.27 | 23.67 | 25.13 |
| 9 | 10 | 1.81 | 56.30 | 1.34 | 0.89 | 0.07 | 0.03 | 61.17 | 23.11 | 25.01 |
| 10 | 11 | 1.70 | 52.88 | 1.26 | 0.78 | 0.07 | 0.03 | 60.90 | 23.97 | 25.40 |
| 11 | 12 | 1.94 | 60.34 | 1.53 | 1.54 | 0.10 | 0.03 | 77.26 | 6.96 | 25.39 |
| 12 | 13 | 1.89 | 58.79 | 1.64 | 1.54 | 0.10 | 0.03 | 97.68 | 7.64 | 24.92 |
| 13 | 14 | 1.60 | 49.77 | 1.47 | 1.21 | 0.09 | 0.05 | 60.59 | 24.59 | 27.07 |
| 14 | 15 | 1.73 | 53.81 | 1.65 | 1.57 | 0.10 | 0.04 | 93.98 | 6.60 | 25.63 |
| 15 | 16 | 1.57 | 48.83 | 1.65 | 1.67 | 0.12 | 0.05 | 97.06 | 9.44 | 25.81 |
| 16 | 17 | 1.47 | 45.72 | 1.51 | 1.22 | 0.12 | 0.07 | 58.61 | 24.37 | 26.01 |
| 17 | 18 | 1.31 | 40.75 | 1.15 | 0.87 | 0.10 | 0.08 | 54.86 | 5.32 | 26.08 |
| 18 | 19 | 1.42 | 44.17 | 1.50 | 1.32 | 0.10 | 0.06 | 63.20 | 6.48 | 24.97 |
| 19 | 20 | 1.31 | 40.75 | 1.25 | 1.14 | 0.14 | 0.08 | 76.43 | 7.64 | 26.01 |
| 20 | 21 | 1.45 | 45.10 | 1.23 | 1.05 | 0.12 | 0.07 | 64.21 | 5.04 | 26.63 |
| 21 | 22 | 1.88 | 58.47 | 2.12 | 1.60 | 0.06 | 0.04 | 102.00 | 8.40 | 25.67 |
| 22 | 23 | 1.73 | 53.81 | 2.07 | 1.47 | 0.06 | 0.04 | 92.04 | 8.32 | 25.53 |
| 23 | 24 | 2.09 | 65.01 | 2.14 | 1.73 | 0.07 | 0.04 | 113.00 | 8.04 | 26.04 |
| 24 | 25 | 1.37 | 42.61 | 1.19 | 1.00 | 0.11 | 0.07 | 65.22 | 6.00 | 25.50 |
| 25 | 26 | 2.26 | 70.29 | 1.43 | 0.76 | 0.31 | 0.12 | 48.25 | 21.37 | 27.31 |
| Mean | 1.67 | 51.89 | 1.54 | 1.17 | 0.10 | 0.05 | 83.67 | 11.24 | 25.48 | |
Table 8. Assay results, Drillhole SPT1_2
| Drillholes: SPT1_2 | ||||||||||
| From | To | Ag (oz/t) | Ag (g/t) | % Zn | % Pb | % Cu | Au (g/t) | Ga (g/t) | In (g/t) | % Fe |
| 0 | 1 | 1.74 | 54.12 | 1.19 | 0.88 | 0.04 | 0.04 | 54.12 | 24.47 | 27.93 |
| 1 | 2 | 1.39 | 43.23 | 1.33 | 0.71 | 0.07 | 0.08 | 69.65 | 4.20 | 26.93 |
| 2 | 3 | 1.31 | 40.75 | 1.15 | 0.60 | 0.06 | 0.09 | 54.52 | 23.31 | 27.63 |
| 3 | 4 | 1.32 | 41.06 | 1.20 | 0.66 | 0.07 | 0.09 | 67.01 | 23.72 | 27.30 |
| 4 | 5 | 1.33 | 41.37 | 1.20 | 0.62 | 0.07 | 0.10 | 59.97 | 23.90 | 27.07 |
| 5 | 6 | 1.67 | 51.94 | 1.50 | 0.72 | 0.06 | 0.04 | 58.09 | 25.02 | 26.69 |
| 6 | 7 | 1.76 | 54.74 | 1.56 | 0.75 | 0.07 | 0.03 | 55.75 | 4.40 | 27.95 |
| 7 | 8 | 1.80 | 55.99 | 1.52 | 0.72 | 0.06 | 0.03 | 54.21 | 22.48 | 27.19 |
| 8 | 9 | 1.78 | 55.36 | 1.34 | 0.76 | 0.07 | 0.03 | 48.05 | 24.34 | 28.03 |
| 9 | 10 | 1.54 | 47.90 | 1.29 | 0.84 | 0.06 | 0.03 | 46.73 | 21.54 | 26.77 |
| 10 | 11 | 1.76 | 54.74 | 1.97 | 1.97 | 0.10 | 0.03 | 108.00 | 7.76 | 25.70 |
| 11 | 12 | 1.61 | 50.08 | 1.52 | 1.35 | 0.09 | 0.04 | 70.09 | 4.48 | 27.18 |
| 12 | 13 | 1.58 | 49.14 | 1.42 | 1.39 | 0.09 | 0.05 | 77.84 | 5.68 | 26.35 |
| 13 | 14 | 1.50 | 46.66 | 1.64 | 1.58 | 0.13 | 0.06 | 91.92 | 7.36 | 25.80 |
| 14 | 15 | 1.27 | 39.50 | 1.24 | 1.04 | 0.09 | 0.08 | 52.23 | 4.60 | 27.58 |
| 15 | 16 | 1.26 | 39.19 | 1.24 | 1.23 | 0.09 | 0.06 | 69.39 | 5.76 | 24.56 |
| Mean | 1.54 | 47.86 | 1.39 | 0.99 | 0.08 | 0.06 | 64.85 | 14.56 | 26.92 | |
Drill Program
CDPR engaged Ingetrol Comercial S.A.C., a subsidiary of Grupo Ingetrol (Chile), and ConeTec Peru, a subsidiary of the ConeTec Group (Canada). The campaign utilizes percussion and sonic drilling techniques to ensure the most accurate results.
On October 23rd, the Company completed the last of 40 drill holes, ahead of the rainy season, collecting more than 1,000 samples over a significant portion of the Quiulacocha tailings deposit. The samples were safely transported to the laboratory in freezer containers and are currently being analyzed.
Laboratory Testing
All samples are stored and transported to Lima in freezer containers to prevent oxidation and preserve sample integrity.
The samples are dried and tested at the Inspectorate Services Lab (Bureau Veritas) in Lima. Following geochemical and mineralogical testing, representative composites from select samples will be sent for an advanced metallurgical test work program.
The assay results are derived from a combination of multi-element ICP (detecting 60 elements), Atomic Absorption (for determining upper limits of the metals Zn, Pb, and Cu), and Fire Assay for Au.
Quality Assurance and Quality Control
The preparation of samples for Geochemical Analyses comprises drying at 100°C and riffle splitting to obtain a representative pulp sample of 250 grams. The sample does not undergo sieving or any other mechanical preparation (crushing or grinding) to preserve the original grain size distribution.
Bureau Veritas performs all sample preparation and analytical programs, supported by the QA/QC program, which is monitored on a sample lot basis. The CDPR QA/QC program consists of inserting twin samples, coarse duplicate samples, pulp duplicate samples, standard reference materials, and coarse blank material and further checking at a second laboratory.
Geophysics
CDPR has successfully completed Phase 1 of its geophysical studies, focusing on the dry areas of the Quiulacocha Tailings. Depth readings, conducted by Geomain Ingenieros S.A.C., ranged from 20 to over 40 meters in various locations.
The Quiulacocha Tailings
CDPR is the titleholder of the concession “El Metalurgista” in Peru, which grants it the right to explore and exploit the Quiulacocha Tailings within its assigned area. The General Mining Bureau of the Peruvian Ministry of Energy and Mines has formally confirmed the enforceability of these rights.
The Quiulacocha Tailings Storage Facility covers approximately 115 hectares and is estimated to hold approximately 75 million tonnes of material processed from the 1920s to 1990s.
Initially, these tailings resulted from the mining of 16+ million tonnes of copper-silver-gold mineralization with reported historical grades of up to 10% Cu, 4 g/t Au, and over 300 g/t Ag, and later from the mining of 58+ million tonnes of zinc-lead-silver mineralized material with average historical grades of 7.41% Zn, 2.77% Pb, and 90.33 g/t Ag.
With minimal mining costs due to surface-level material and current reprocessing capacity at adjacent plants, CDPR’s Quiulacocha Project stands out as one of Peru’s key mining initiatives. This project provides economic benefits and aims to restore the environment and create employment opportunities, aligning with the local community’s needs.
Technical Information
Mr. Alfonso Palacio Castilla, MIMMM/Chartered Engineer (CEng) and Project Superintendent for CDPR, has reviewed and approved the scientific and technical information contained in this news release. Mr. Palacio is a Qualified Person for the purposes of reporting in compliance with NI 43-101.
Cerro de Pasco Resources
Cerro de Pasco Resources Inc. is focused on the development of its principal 100% owned asset, the El Metalurgista mining concession, comprising silver-rich mineral tailings and stockpiles extracted over a century of operation from the Cerro de Pasco open pit mine in Central Peru. The company’s approach at El Metalurgista entails the reprocessing and environmental remediation of mining waste and the creation of numerous opportunities in a circular economy. The asset is one of the world’s largest above-ground resources.
Imperial Metals Corporation (TSX:III) reports copper and gold p... READ MORE
Aldebaran Resources Inc. (TSX-V: ALDE) (OTCQX: ADBRF) and its maj... READ MORE
Nevada Sunrise Metals Corporation (TSX-V: NEV) (OTC Pink: NVSGF)... READ MORE
Newmont Corporation (NYSE: NEM) (ASX: NEM) (PNGX: NEM) announced ... READ MORE
Scorpio Gold Corporation (TSX-V: SGN) (OTCQB: SRCRF) (FSE: RY9) i... READ MORE


