


Centerra Gold Inc. (TSX: CG) (NYSE: CGAU) is pleased to announce the results of a Pre-Feasibility Study for its Mount Milligan mine in British Columbia, confirming a life of mine extension of approximately 10 years, to 2045. The extension is driven by disciplined future investments, including increasing process plant capacity in 2029 and constructing a second tailings storage facility in the first half of the 2030s. These initiatives reinforce Mount Milligan as a long-term, low-cost contributor to Centerra’s production profile and cash flow generation in a top tier mining jurisdiction.
President and CEO, Paul Tomory, commented, “Mount Milligan’s LOM extension marks a key milestone in advancing Centerra’s organic gold growth strategy. Recent step-out and infill drilling programs have confirmed the continuation of mineralization to the west of the current open pit. Incorporating this drilled inventory, the PFS outlines a 10-year LOM extension, to 2045, supported by phased, manageable non-sustaining capital expendituresNG totaling $186 million, most of which is not required until the early-to-mid-2030s, that we expect to fully fund from available liquidity. The PFS reaffirms Mount Milligan’s solid economics, underpinned by consistent production, disciplined capital deployment, and low all-in sustaining costs on a by-product basisNG. As we look to the future of Mount Milligan, we are encouraged by the establishment of British Columbia’s new Mining and Critical Minerals Ministry and by Mount Milligan’s designation as a provincial priority project, in support of a more streamlined permitting process. Ongoing exploration continues to highlight the potential to further expand mineral resources and extend mine life beyond the updated plan. Mount Milligan remains a strategic cornerstone asset in Centerra’s portfolio, with 20 years of mine life, meaningful low-cost gold and copper production, strong cash flow generation, and significant opportunity for future exploration potential in a top tier mining jurisdiction.”
Mount Milligan PFS Highlights
Summary of Mount Milligan PFS Key Metrics
| Summary of Mount Milligan PFS Key Metrics | |
| Production | |
| Mine Life (years) | 20 |
| Total gold production (kozs) | 2,791 |
| Average annual gold production – 2026-2042(1) (kozs) | 150 |
| Average annual gold production – LOM (kozs) | 136 |
| Total copper production (Mlbs) | 1,282 |
| Average annual copper production – 2026-2042(1) (Mlbs) | 69 |
| Average annual copper production – LOM (Mlbs) | 63 |
| Total mill feed (M tonnes) | 483 |
| Average mill throughput(2) (tpd) | 66,300 |
| Average gold grade – 2026-2042(1) (g/t) | 0.31 |
| Average gold grade – LOM (g/t) | 0.28 |
| Average copper grade – 2026-2042(1) (%) | 0.18 |
| Average copper grade – LOM (%) | 0.16 |
| Average gold recovery (%) | 64.8 |
| Average copper recovery (%) | 78.0 |
| Costs | |
| Mining cost per tonne mined(3) ($/tonne) | 2.50 |
| Processing cost per tonne processed ($/tonne) | 5.57 |
| General & Administrative (“G&A”) cost per tonne processed(4) ($/tonne) | 2.11 |
| Gold production costs per ounce sold ($/oz) | 1,312 |
| All-in sustaining costs on a by-product basisNG per ounce sold ($/oz) | 950 |
| Capital Expenditures | |
| LOM Total capital expendituresNG ($ millions) | 925 |
| Non-sustaining capital expendituresNG ($ millions) | 186 |
| Sustaining capital expendituresNG(8) ($ millions) | 739 |
| PFS Economics(5,7) | |
| After-tax NPV5% ($ millions) | 1,492 |
| Economics at Spot Commodity Prices(6,7) | |
| After-tax NPV5% ($ millions) | 2,127 |
(1) Averages reflect production and grades for 2026-2042. The period from 2043 to 2045 has been excluded, as it represents low-grade stockpile processing. (2) Average mill throughput starting in 2030 and beyond. (3) On the basis of gross mining costs, prior to the allocation to TSF, divided by total tonnes mined. (4) Excludes corporate allocations. (5) PFS economics are based on commodity prices of $3,205/oz gold and $4.35/lb copper in H2 2025, $3,263/oz and $4.48/lb in 2026, $3,078/oz and $4.60/lb in 2027, $2,928/oz and $4.67/lb in 2028, and a long-term assumption (2029+) of $2,600/oz gold and $4.30/lb copper. USD/CAD exchange rate assumptions are $1.39:1 in H2 2025, $1.38:1 in 2026, $1.37:1 in 2027, $1.36:1 in 2028 and $1.35:1 from 2029 onward. (6) Economics at spot commodity prices assumes $3,500/oz gold and $4.50/lb copper over LOM. All other assumptions are the same as the PFS economics. (7) After-tax NPV assumes amalgamation of various Canadian legal entities, including the subsidiary that owns Mount Milligan, to optimize tax deductions. (8) Does not include capital leases of $99M. Refer to PFS LOM Summary table at the end of this news release for more detail.
Mount Milligan PFS Summary
Centerra has completed a PFS for Mount Milligan that contemplates a 10-year LOM extension, to 2045, supported by an optimized mine plan, with average annual production, from 2026 to 2042, of approximately 150,000 ounces of gold and 69 million pounds of copper, followed by the processing of low-grade stockpiles from 2043 to 2045. Centerra’s recent infill drilling program, targeting tighter drill spacing in key areas of the deposit, has been incorporated into the PFS, improving confidence in the geology and mine plan.
Mount Milligan will continue to be mined as a conventional truck-shovel open pit mine. Total mining rates of ore and waste are expected to average 156 ktpd between 2026 and 2042. The strip ratio over the same period is expected to average 1.0. Mining will continue through 2042, at which time, lower grade stockpiles are expected to feed the process plant from 2043 through 2045.
Mine operations will incorporate in-pit dumping of potentially acid-generating waste, reducing the environmental footprint, lowering operating costs, and optimizing tailings storage capacity. This approach reinforces Centerra’s commitment to delivering long-term value for all Mount Milligan stakeholders.
Operational improvements, including in-pit dumping and enhanced stockpile management, will increase efficiency as mining rates are expected to reach 200 ktpd at points during the LOM, requiring only a modest fleet expansion of five additional trucks. Regular equipment replacements and the five additional trucks will support the material movements for the remainder of the mine life.
In 2029, process plant throughput is expected to increase by 10%, from 60.0 ktpd to approximately 66.3 ktpd, by upgrading the ball mill motors. Flotation capacity is also expected to increase which should deliver a modest improvement in gold and copper recoveries of about 1%. These enhancements require a manageable capital investment of $36 million.
A second tailings facility is required to support the LOM expansion and is planned north of the existing facility, subject to consultation with First Nations, with an estimated cost of approximately $114 million, phased over 2032 and 2033. The new TSF is expected to deliver an improved water balance compared to the current facility, with subsequent lifts constructed using the capital-efficient cyclone sand method. The TSF footprint has been designed to accommodate future lifts, providing flexibility for potential further LOM extensions that could add multiple decades of capacity beyond the current mine life of 2045.
Over the LOM, open pit mining costs are expected to average $2.50 per tonne mined, processing costs are expected to average $5.57 per tonne processed, and G&A costs are expected to average $2.11 per tonne processed.
Mount Milligan PFS Production and Cost Profile(1)
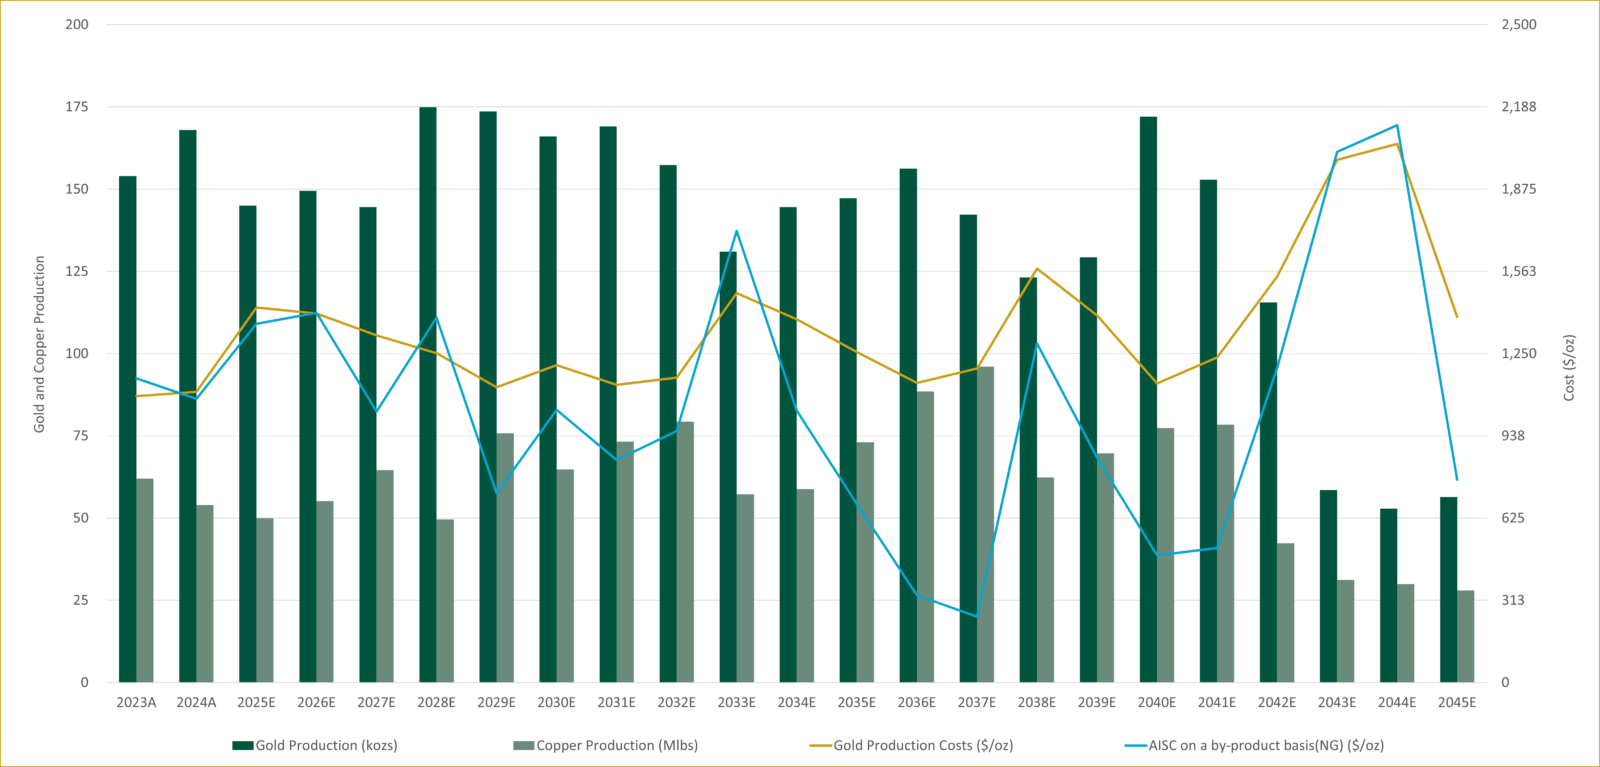
(1) AISC on a by-product basisNG in 2030s is low due to higher copper credits in those years.
Royal Gold Additional Agreement
In February 2024, Centerra announced an additional agreement with RGLD Gold AG, a subsidiary of Royal Gold, Inc. related to Mount Milligan, which established favourable parameters for potential future mine life extensions. Under the Additional Agreement, the percentage of gold and copper production streamed to Royal Gold over the mine life remains unchanged at 35% and 18.75%, respectively. However, Centerra will receive increased payments for gold and copper sold to Royal Gold. Details of the Additional Agreement are illustrated in the tables below. For more information refer to the news release “Centerra Gold Announces Mount Milligan Mine Life Extension and Additional Agreement with Royal Gold” published on February 14, 2024.
Gold Stream
| Gold Delivery Threshold (after January 1, 2024) |
Approximate Period(1) |
Gold Payments Received from Royal Gold |
| Until either 375,000 ounces of gold or 30,000 tonnes of copper have been delivered to Royal Gold (the “First Threshold”) | 2024 – 2029 | $435/oz |
| After the First Threshold until 665,000 ounces of gold have been delivered to Royal Gold (the “Second Gold Threshold”) | 2030 – 2035 | Lower of $850/oz and 50% of spot gold price |
| After 665,000 ounces of gold have been delivered to Royal Gold | 2036+ | Lower of $1,050/oz and 66% of spot gold price |
(1) Approximate period estimates are based on PFS production profile.
Copper Stream
| Gold Delivery Threshold (after January 1, 2024) |
Approximate Period(1) |
Gold Payments Received from Royal Gold |
| Until either 375,000 ounces of gold or 30,000 tonnes of copper have been delivered to Royal Gold (the “First Threshold”) | 2024 – 2029 | 15% of spot copper price |
| After the First Threshold until 60,000 tonnes of copper have been delivered to Royal Gold (the “Second Copper Threshold”) | 2030 – 2035 | 50% of spot copper price |
| After 60,000 tonnes of copper have been delivered to Royal Gold | 2036+ | 66% of spot copper price |
(1) Approximate period estimates are based on PFS production profile.
Capital ExpendituresNG
The total non-sustaining capital expendituresNG required for the Mount Milligan LOM extension is $186 million, mainly related to a second TSF, modifications in the process plant to increase throughput by approximately 10%, and five new haul truck additions. The capital program is designed to leverage existing infrastructure, reducing the cost and execution risk.
Approximately $36 million of non-sustaining capitalNG is expected for the process plant expansion. Ball mill motor upgrades are expected to increase process plant throughput by approximately 10%, to 66.3 ktpd, reaching nameplate capacity in 2029. Flotation capacity is also expected to increase which should deliver a modest improvement in gold and copper recoveries of about 1%.
Approximately $114 million of non-sustaining capitalNG is expected to be evenly distributed in 2032 and 2033 related to the second TSF. Sustaining capital for raises on the new TSF are expected to be more cost effective than the existing TSF construction method while maintaining high safety standards. After completion of the starter facility, the dam will be constructed using cycloned tailings sand produced by the process plant, offering efficiency and cost advantages compared to the existing earthen dam structure. This new facility, anticipated to be located to the north of the existing facility, subject to consultation with First Nations, would have the benefit of an improved water balance compared with the existing facility. The new TSF footprint is sufficiently large to enable future lifts that could potentially add multiple decades of capacity beyond the current mine life. Both designs follow the centerline construction method, a proven approach recognized for its geotechnical stability.
Approximately $28 million of non-sustaining capitalNG is expected for fleet additions. This includes five new haul trucks, required to accommodate longer hauling distances, increased material movement to achieve higher process plant throughput, and the creation of strategic stockpiles.
In addition, sustaining capitalNG of approximately $739 million is planned over the 20-year mine life, primarily allocated to ongoing equipment replacements, TSF raises, and other site infrastructure requirements.
A breakdown of the non-sustaining capitalNG is included in the table below.
| Non-Sustaining CapitalNG Breakdown | Total ($M) |
| TSF Expansion | 114 |
| Process Plant Expansion | 36 |
| Fleet Additions | 28 |
| Site Infrastructure | 7 |
| Total Non-Sustaining CapitalNG | 186 |
NOTE: Totals may not sum due to rounding.
Mineral Reserve and Mineral Resource Estimate
An updated proven and probable mineral reserve totalling 483.2 million tonnes, with an average grade of 0.28 grams per tonne gold and 0.16% copper, containing 4.4 million ounces of gold and 1.7 billion pounds of copper was included in the PFS. This represents a 56% increase from the 2.8 million ounces of gold reserves and a 52% increase from the 1.2 billion pounds of copper reserves reported at the end of 2024, driven by resource conversion related to increased tailings capacity. Mineral resources, inclusive of reserves, at Mount Milligan have increased following infill drilling at the western extension of the deposit. The Company has lowered its mining cost assumptions for mineral reserves and resources, reflecting load and haul efficiencies achieved through the ongoing site optimization program.
Mount Milligan Gold Mineral Reserve and Resources
| June 30, 2025 | December 31, 2024 | |||||
| Tonnes (kt) |
Grade (g/t Au) |
Contained Metal (kozs) |
Tonnes (kt) |
Grade (g/t Au) |
Contained Metal (kozs) |
|
| Mineral Reserves | ||||||
| Proven | 190,315 | 0.31 | 1,880 | 187,961 | 0.34 | 2,056 |
| Probable | 292,842 | 0.27 | 2,537 | 76,551 | 0.31 | 770 |
| Proven and Probable | 483,157 | 0.28 | 4,417 | 264,512 | 0.33 | 2,826 |
| Mineral Resources (inclusive of Mineral Reserves)(1) | ||||||
| Measured | 363,982 | 0.28 | 3,309 | 291,187 | 0.30 | 2,835 |
| Indicated | 310,110 | 0.27 | 2,661 | 176,323 | 0.29 | 1,622 |
| Measured and Indicated | 674,092 | 0.28 | 5,970 | 467,510 | 0.30 | 4,457 |
| Inferred Resources | 12,056 | 0.28 | 110 | 27,924 | 0.44 | 395 |
(1) Mineral resources inclusive of mineral reserves, as of December 31, 2024, is for comparative purposes only. See 2024 year-end mineral reserves and resources news release dated February 20, 2025, for mineral resources exclusive of mineral reserves as of December 31, 2024. NOTE: Refer to “Reserve and Resource Additional Footnotes” at the end of this news release. Totals may not sum due to rounding.
Mount Milligan Copper Mineral Reserve and Resources
| June 30, 2025 | December 31, 2024 | |||||
| Tonnes (kt) |
Grade (% Cu) |
Contained Metal (Mlbs) |
Tonnes (kt) |
Grade (% Cu) |
Contained Metal (Mlbs) |
|
| Mineral Reserves | ||||||
| Proven | 190,315 | 0.17 | 698 | 187,961 | 0.19 | 808 |
| Probable | 292,842 | 0.16 | 1,051 | 76,551 | 0.20 | 342 |
| Proven and Probable | 483,157 | 0.16 | 1,749 | 264,512 | 0.20 | 1,150 |
| Mineral Resources (inclusive of Mineral Reserves)(1) | ||||||
| Measured | 363,982 | 0.17 | 1,378 | 291,187 | 0.19 | 1,212 |
| Indicated | 310,110 | 0.14 | 979 | 176,323 | 0.18 | 703 |
| Measured and Indicated | 674,092 | 0.16 | 2,357 | 467,510 | 0.19 | 1,915 |
| Inferred Resources | 12,056 | 0.11 | 30 | 27,924 | 0.12 | 74 |
(1) Mineral inventory inclusive of mineral reserves, as of December 31, 2024, is for comparative purposes only. See 2024 year-end mineral reserves and resources news release dated February 20, 2025, for mineral resources exclusive of mineral reserves as of December 31, 2024. NOTE: Refer to “Reserve and Resource Additional Footnotes” at the end of this news release. Totals may not sum due to rounding.
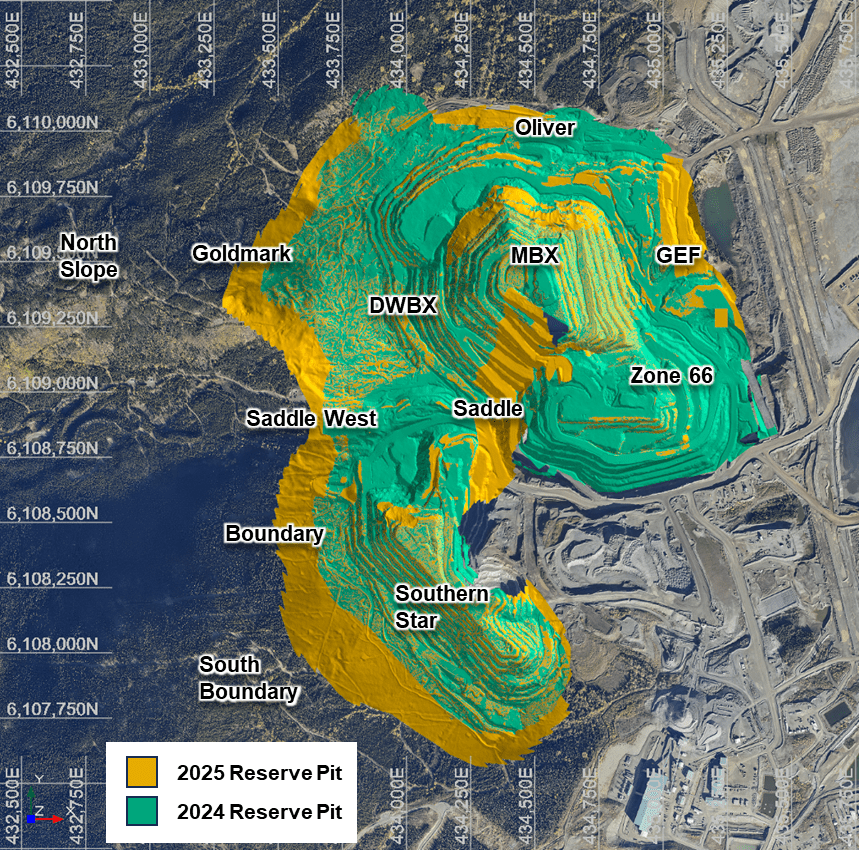
Figure 1: Plan view comparing the 2024 reserve pit to the 2025 reserve pit. Gold areas illustrate the areas of expansion beyond the previous pit limits.
Exploration Potential
Exploration drilling in 2025 was completed in two phases. Phase 1 focused on upgrading inferred resources to the indicated category for inclusion in the PFS. Drilling was concentrated within the conceptual resource pit, with 83 holes totaling approximately 23 kilometres completed and incorporated into the updated model. The Phase 1 program, completed in the first quarter of 2025, targeted Zone 66, GEF, Saddle, WBX, MBX, Southern Star and South Boundary.
Figure 2: Plan view of Mount Milligan deposit showing 2025 resource shell.
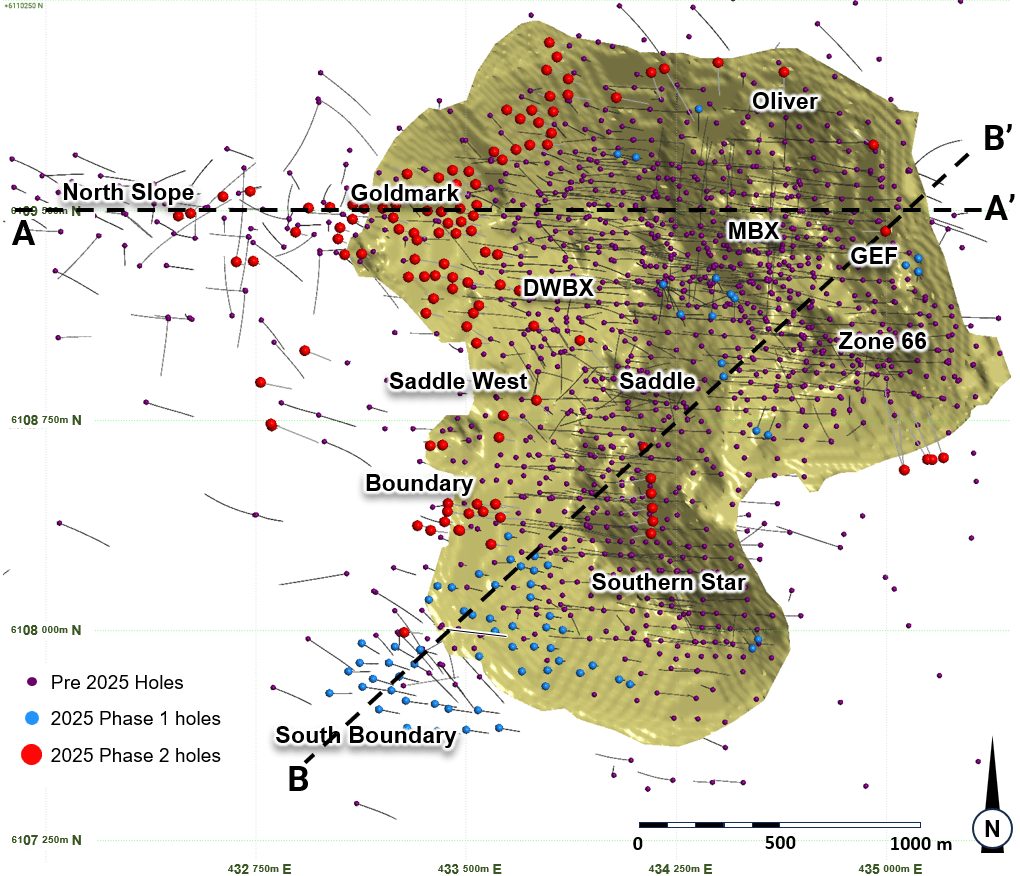
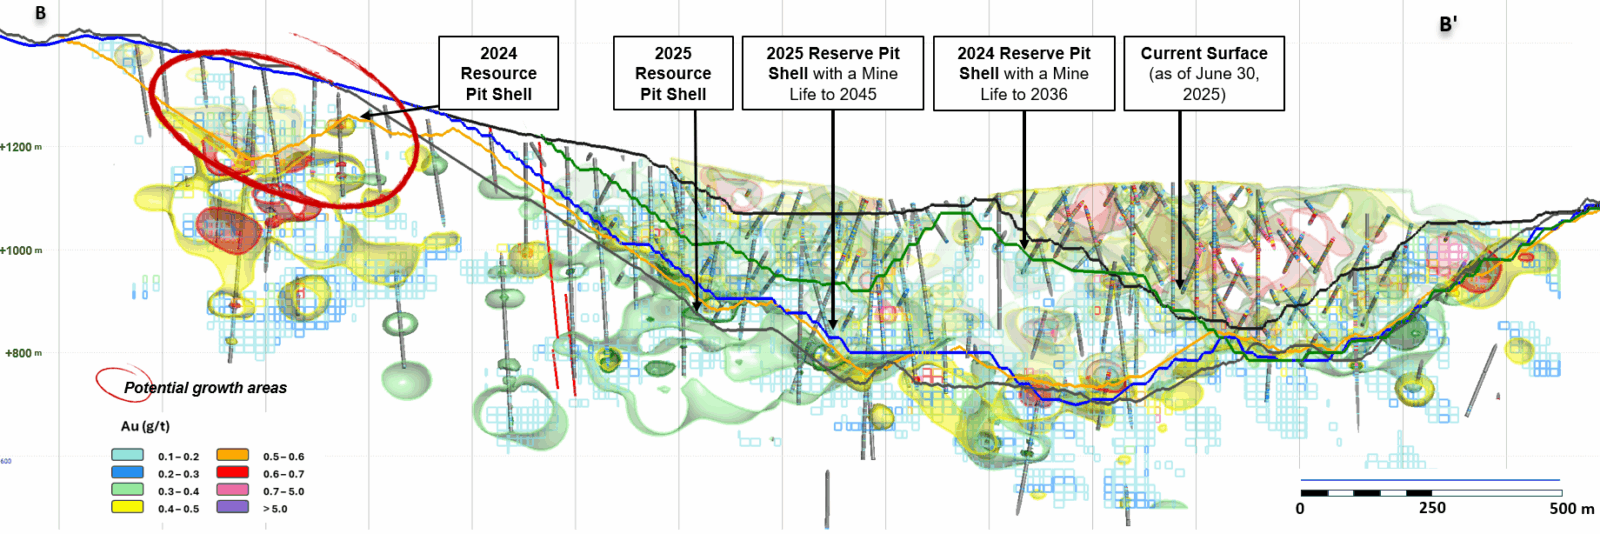
Figure 3: East-west cross section of the Mount Milligan 2025 resource pit (looking north), showing gold and copper grade contours. Red traces show holes drilled, but assays not yet received.
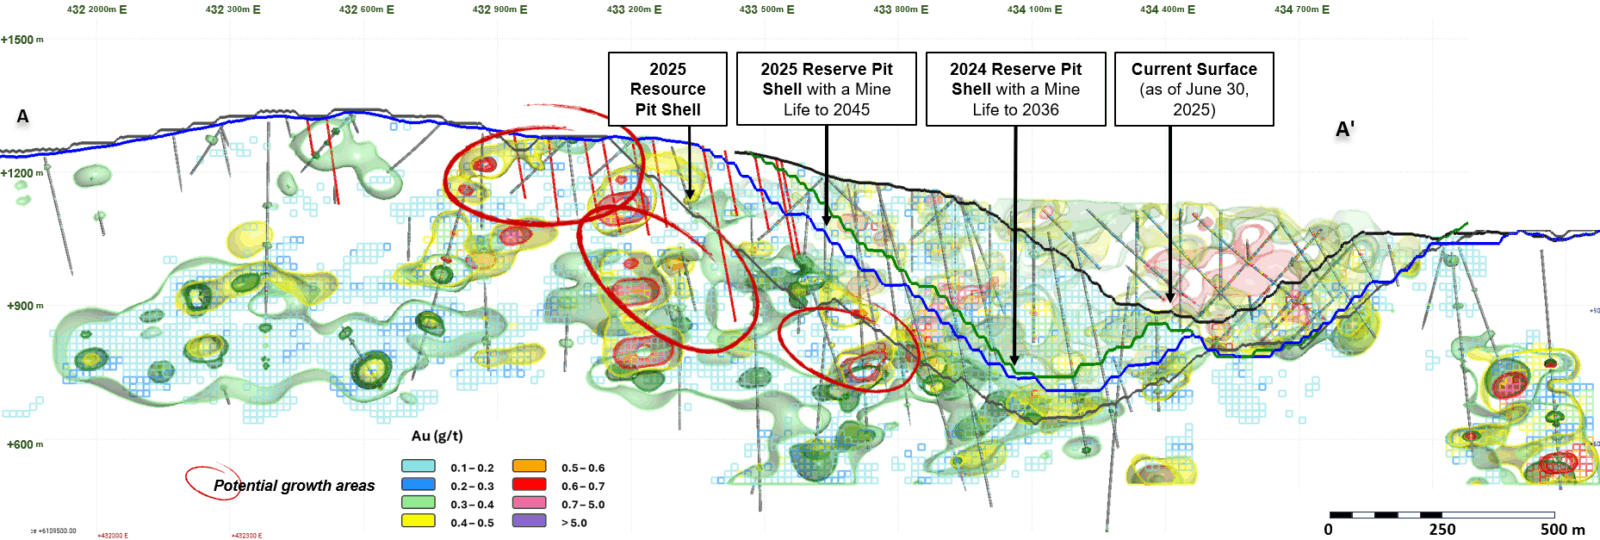
Figure 4: Cross section of the Mount Milligan 2025 resource pit (looking northwest), showing gold and copper grade contours. Red traces show holes drilled, but assays not yet received.
At South Boundary, infill drilling revealed more complex mineralogical controls of the vein mineralization compared to other areas of the deposit. Additional detailed work is planned to better understand this zone. Due to these geological complexities, as well as the less favourable economics of the high gold-low copper mineralization style and pyrite recovery challenges, the South Boundary mineralization is not currently included in the PFS mineral resources estimate.
Figure 5: Comparison of 2024 and 2025 resource shells.
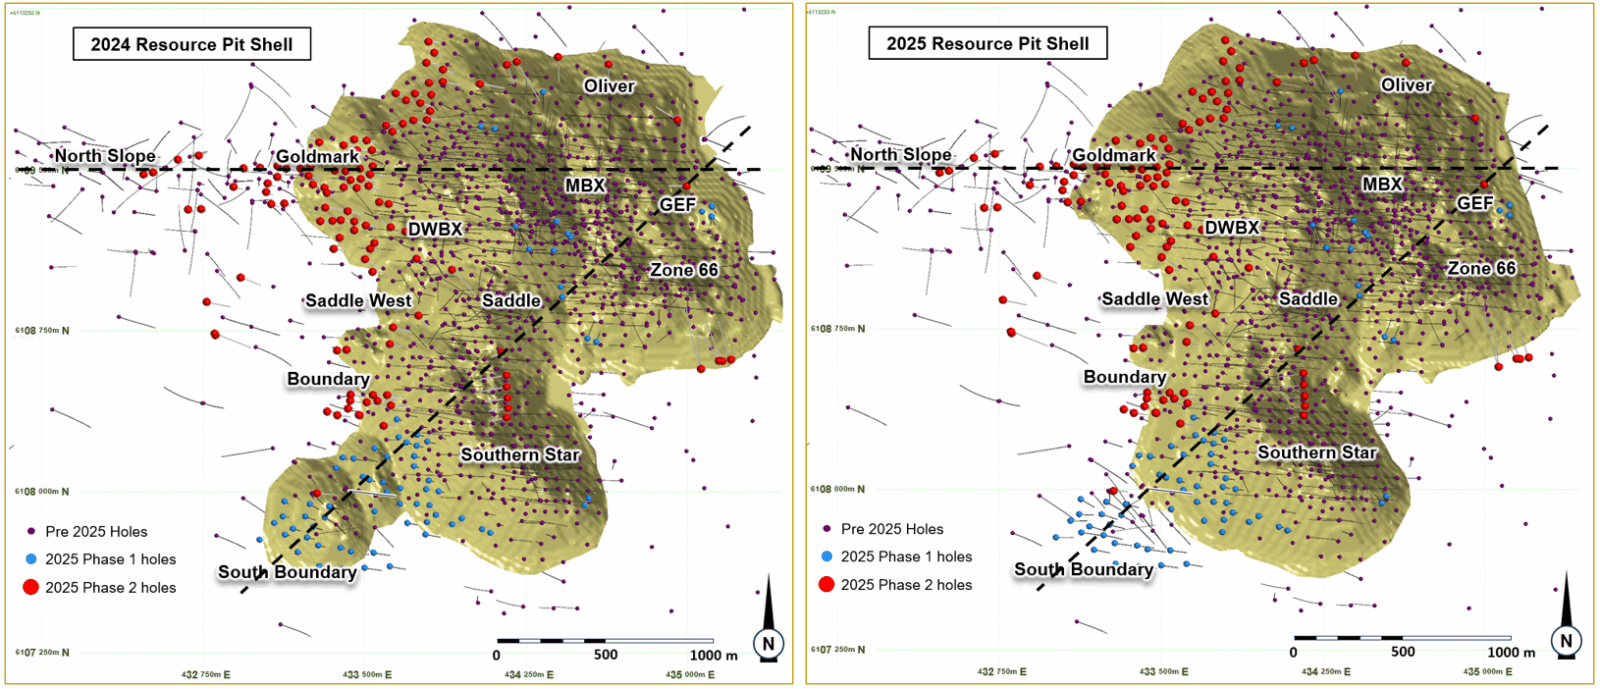
Phase 2 drilling, completed in the third quarter 2025, comprised 117 holes totaling 33 km and focused on the Goldmark, North Slope, Oliver, Saddle, Boundary, and Southern Star areas. Assays from this phase were not included in the most recent model update for the PFS, however, results received to date highlight encouraging mineralization. Significant near-surface grades were intersected between Goldmark and North Slope in areas where earlier wide- spaced drilling did not identify appreciable shallow grades. At depth, drilling also intersected strong mineralization in zones previously modelled as waste on the periphery of the Saddle stock, suggesting potential continuity between the Goldmark and Saddle zones. In the Oliver area, located near the northern margins of the reserve pit, drilling intersected mineralization in areas previous classified as waste.
Figure 6: Section 6,109,250N showing new drill results not included in the model update.
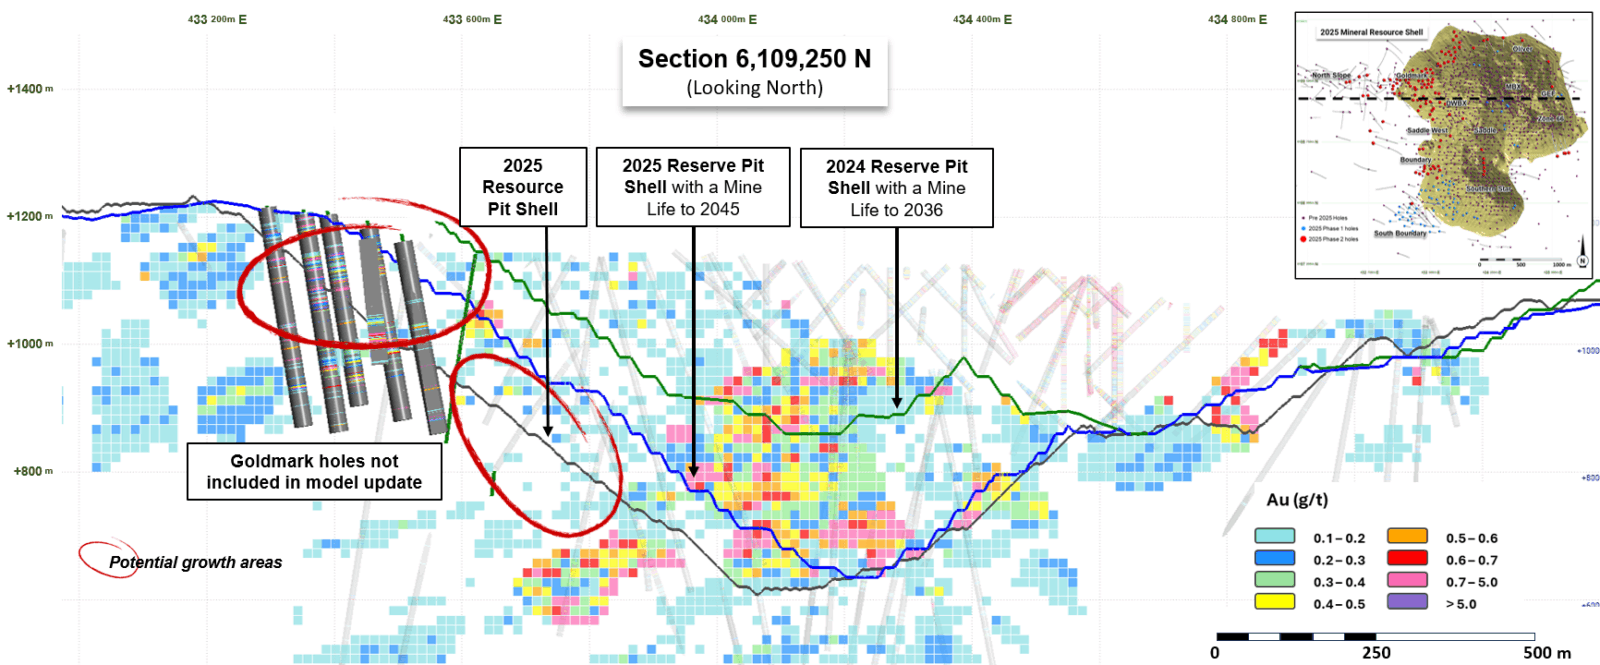
Based on Phase 2 results, Centerra plans to continue drilling to upgrade resources both near surface and at depth, focusing on areas to the west and southwest of the Mount Milligan reserve pit.
Permitting and Community Relations
Since 2014, Mount Milligan has been a significant producer of copper and gold, establishing its status as an essential critical mineral asset for British Columbia. In early 2025, the BC Government designated Mount Milligan as one of the province’s priority projects, which supports a more streamlined permitting process under the newly established Ministry of Mining and Critical Minerals.
In March 2025, Centerra submitted its amendment application for key permits to extend operations through 2035, including a process plant throughput expansion of approximately 10%, with a decision expected in the first half of 2026. Permitting activities for a second TSF and other required authorizations are expected to begin in 2027, allowing adequate time for approvals ahead of planned construction in 2032.
The extended LOM is expected to provide consistent employment to more than 1,000 workers and increase business opportunities to First Nations, surrounding communities, and the province, representing a significant economic driver for northern communities in British Columbia.
Sensitivity Analysis
The PFS reaffirms Mount Milligan’s solid economics, supported by consistent production, disciplined capital investment and low AISC on a by-product basisNG. Mount Milligan’s after-tax NPV5% is approximately $1.5 billion, based on long-term gold and copper price assumptions of $2,600 per ounce and $4.30 per pound, respectively. At spot commodity prices of approximately $3,500 per ounce of gold and $4.50 per pound of copper, the after-tax NPV5% increases to approximately $2.1 billion. The sensitivities to commodity prices and input costs are illustrated in the tables below.
Mount Milligan PFS After-Tax NPV5% Sensitivities
| -10%(2) | -5%(2) | PFS(1) | 5%(2) | 10%(2) | |
| Gold Price | 1,280 | 1,386 | 1,492 | 1,597 | 1,701 |
| Copper Price | 1,287 | 1,390 | 1,492 | 1,594 | 1,694 |
| Canadian Dollar | 1,146 | 1,331 | 1,492 | 1,633 | 1,759 |
| Capital Costs | 1,569 | 1,531 | 1,492 | 1,453 | 1,415 |
| Operating Costs | 1,510 | 1,501 | 1,492 | 1,483 | 1,474 |
(1) PFS economics are based on commodity prices of $3,205/oz gold and $4.35/lb copper in H2 2025, $3,263/oz and $4.48/lb in 2026, $3,078/oz and $4.60/lb in 2027, $2,928/oz and $4.67/lb in 2028, and a long-term assumption (2029+) of $2,600/oz gold and $4.30/lb copper. USD/CAD exchange rate assumptions are $1.39:1 in H2 2025, $1.38:1 in 2026, $1.37:1 in 2027, $1.36:1 in 2028 and $1.35:1 from 2029 onward. (2) Sensitivities are assumed flat over LOM, flexed for each scenario, with the other assumptions the same as the PFS economics.
Mount Milligan PFS After-Tax NPV5% Sensitivity to Long-Term Gold Price
| Gold Price ($/oz) | |||||
| $2,000(2) | $2,600(1) (PFS) |
$3,000(2) | $3,500(2) | $4,000(2) | |
| NPV5% | 898 | 1,492 | 1,685 | 2,061 | 2,435 |
(1) PFS economics are based on commodity prices of $3,205/oz gold and $4.35/lb copper in H2 2025, $3,263/oz and $4.48/lb in 2026, $3,078/oz and $4.60/lb in 2027, $2,928/oz and $4.67/lb in 2028, and a long-term assumption (2029+) of $2,600/oz gold and $4.30/lb copper. USD/CAD exchange rate assumptions are $1.39:1 in H2 2025, $1.38:1 in 2026, $1.37:1 in 2027, $1.36:1 in 2028 and $1.35:1 from 2029 onward. (2) Gold price sensitivities are assumed flat over LOM. The other assumptions are the same as the PFS economics.
Mount Milligan PFS After-Tax NPV5% Sensitivity to Long-Term Copper Price
| Copper Price ($/lb) | |||||
| $3.75(2) | $4.00(2) | $4.30(1) (PFS) |
$4.50(2) | $4.75(2) | |
| NPV5% | 1,206 | 1,325 | 1,429 | 1,560 | 1,676 |
(1) PFS economics are based on commodity prices of $3,205/oz gold and $4.35/lb copper in H2 2025, $3,263/oz and $4.48/lb in 2026, $3,078/oz and $4.60/lb in 2027, $2,928/oz and $4.67/lb in 2028, and a long-term assumption (2029+) of $2,600/oz gold and $4.30/lb copper. USD/CAD exchange rate assumptions are $1.39:1 in H2 2025, $1.38:1 in 2026, $1.37:1 in 2027, $1.36:1 in 2028 and $1.35:1 from 2029 onward. (2) Copper price sensitivities are assumed flat over LOM. The other assumptions are the same as the PFS economics.
Mount Milligan PFS LOM Summary
| LOM Total | H2 2025 | 2026 | 2027 | 2028 | 2029 | 2030 | 2031 | 2032 | 2033 | 2034 | 2035 | 2036 | 2037 | 2038 | 2039 | 2040 | 2041 | 2042 | 2043 | 2044 | 2045 | 2046+ | |
| Assumptions | |||||||||||||||||||||||
| Gold price ($/oz) | 3,205 | 3,263 | 3,078 | 2,928 | 2,600 | 2,600 | 2,600 | 2,600 | 2,600 | 2,600 | 2,600 | 2,600 | 2,600 | 2,600 | 2,600 | 2,600 | 2,600 | 2,600 | 2,600 | 2,600 | 2,600 | 2,600 | |
| Copper price ($/lb) | 4.35 | 4.48 | 4.60 | 4.67 | 4.30 | 4.30 | 4.30 | 4.30 | 4.30 | 4.30 | 4.30 | 4.30 | 4.30 | 4.30 | 4.30 | 4.30 | 4.30 | 4.30 | 4.30 | 4.30 | 4.30 | 4.30 | |
| Silver price ($/oz) | 33.80 | 35.06 | 34.65 | 33.23 | 35.00 | 35.00 | 35.00 | 35.00 | 35.00 | 35.00 | 35.00 | 35.00 | 35.00 | 35.00 | 35.00 | 35.00 | 35.00 | 35.00 | 35.00 | 35.00 | 35.00 | 35.00 | |
| USD to CAD Exchange rate | 1.39 | 1.38 | 1.37 | 1.36 | 1.35 | 1.35 | 1.35 | 1.35 | 1.35 | 1.35 | 1.35 | 1.35 | 1.35 | 1.35 | 1.35 | 1.35 | 1.35 | 1.35 | 1.35 | 1.35 | 1.35 | 1.35 | |
| Mine Production | |||||||||||||||||||||||
| Ore mined (Mt) | 479 | 12 | 23 | 22 | 28 | 28 | 26 | 36 | 32 | 21 | 22 | 33 | 37 | 36 | 25 | 28 | 31 | 30 | 9 | – | – | – | – |
| Waste mined (Mt) | 478 | 11 | 27 | 31 | 23 | 27 | 34 | 34 | 31 | 39 | 41 | 29 | 23 | 24 | 35 | 32 | 24 | 13 | 1 | – | – | – | – |
| Total material mined (Mt) | 957 | 22 | 49 | 53 | 51 | 55 | 60 | 70 | 63 | 60 | 63 | 62 | 60 | 60 | 60 | 60 | 55 | 44 | 10 | – | – | – | – |
| Rehandle material moved (Mt) | 247 | 2 | 3 | 2 | 0 | 4 | 10 | 4 | 4 | 14 | 11 | 6 | 4 | 4 | 4 | 8 | 4 | 4 | 43 | 49 | 48 | 20 | – |
| Total material moved (Mt) | 1,205 | 24 | 52 | 55 | 52 | 59 | 70 | 74 | 67 | 74 | 74 | 68 | 64 | 64 | 64 | 68 | 58 | 47 | 53 | 49 | 48 | 20 | – |
| Strip ratio (Waste:Ore) | 1.0 | 0.9 | 1.2 | 1.4 | 0.8 | 0.9 | 1.3 | 1.0 | 1.0 | 1.9 | 1.8 | 0.9 | 0.6 | 0.6 | 1.4 | 1.1 | 0.8 | 0.4 | 0.1 | – | – | – | – |
| Processing | |||||||||||||||||||||||
| Ore processed(1)(Mt) | 483.2 | 11.4 | 21.6 | 21.6 | 21.9 | 23.8 | 24.2 | 24.2 | 24.2 | 24.2 | 24.2 | 24.2 | 24.2 | 24.2 | 24.2 | 24.2 | 24.2 | 24.2 | 24.2 | 24.2 | 24.2 | 19.7 | – |
| Gold feed grade (g/t) | 0.28 | 0.33 | 0.34 | 0.33 | 0.43 | 0.35 | 0.34 | 0.33 | 0.31 | 0.27 | 0.30 | 0.30 | 0.30 | 0.27 | 0.24 | 0.26 | 0.34 | 0.29 | 0.25 | 0.13 | 0.12 | 0.16 | – |
| Copper feed grade (%) | 0.16% | 0.15% | 0.16% | 0.19% | 0.15% | 0.19% | 0.17% | 0.18% | 0.20% | 0.15% | 0.15% | 0.19% | 0.22% | 0.23% | 0.16% | 0.17% | 0.19% | 0.19% | 0.12% | 0.09% | 0.08% | 0.10% | – |
| Gold recovery (%) | 64.8% | 63.6% | 64.0% | 64.5% | 58.8% | 66.2% | 64.7% | 67.0% | 66.6% | 63.5% | 63.6% | 65.1% | 68.5% | 69.9% | 66.5% | 66.7% | 66.2% | 69.0% | 59.6% | 58.7% | 59.7% | 58.0% | – |
| Copper recovery (%) | 78.0% | 76.1% | 76.3% | 77.5% | 72.8% | 79.5% | 77.7% | 79.7% | 79.8% | 76.4% | 76.6% | 78.5% | 81.5% | 82.8% | 78.6% | 79.3% | 79.5% | 81.2% | 72.6% | 70.6% | 71.1% | 70.7% | – |
| Gold recovered (kozs) | 2,860 | 76 | 153 | 149 | 179 | 178 | 170 | 173 | 161 | 134 | 148 | 151 | 160 | 146 | 126 | 133 | 176 | 157 | 118 | 60 | 54 | 58 | – |
| Copper recovered (Mlbs) | 1,364 | 28 | 60 | 70 | 53 | 81 | 69 | 78 | 84 | 61 | 63 | 78 | 94 | 102 | 66 | 74 | 82 | 83 | 45 | 33 | 32 | 30 | – |
| Dry concentrate produced (kdmt) | 3,104 | 78 | 164 | 192 | 117 | 178 | 152 | 172 | 187 | 135 | 138 | 172 | 208 | 226 | 147 | 164 | 182 | 184 | 100 | 73 | 70 | 66 | – |
| Gold payable produced (kozs) | 2,791 | 74 | 150 | 145 | 175 | 174 | 166 | 169 | 157 | 131 | 145 | 147 | 156 | 142 | 123 | 129 | 172 | 153 | 116 | 58 | 53 | 56 | – |
| Copper payable produced (Mlbs) | 1,282 | 26 | 55 | 65 | 50 | 76 | 65 | 73 | 79 | 57 | 59 | 73 | 88 | 96 | 62 | 70 | 77 | 78 | 42 | 31 | 30 | 28 | – |
| Metal Sales(2) | |||||||||||||||||||||||
| Gold ounces sold (kozs) | 2,791 | 74 | 150 | 145 | 175 | 174 | 166 | 169 | 157 | 131 | 145 | 147 | 156 | 142 | 123 | 129 | 172 | 153 | 116 | 58 | 53 | 56 | – |
| Copper pounds sold (Mlbs) | 1,282 | 26 | 55 | 65 | 50 | 76 | 65 | 73 | 79 | 57 | 59 | 73 | 88 | 96 | 62 | 70 | 77 | 78 | 42 | 31 | 30 | 28 | – |
| Revenue | |||||||||||||||||||||||
| Gold sales(3) ($M) | 5,694 | 166 | 341 | 311 | 361 | 321 | 316 | 337 | 313 | 261 | 288 | 293 | 320 | 293 | 254 | 266 | 355 | 315 | 238 | 121 | 109 | 116 | – |
| Copper sales(3) ($M) | 5,034 | 96 | 207 | 248 | 195 | 274 | 248 | 285 | 309 | 223 | 229 | 290 | 356 | 386 | 251 | 280 | 311 | 315 | 171 | 126 | 121 | 112 | – |
| Silver revenue ($M) | 408 | 5 | 12 | 16 | 25 | 27 | 27 | 21 | 23 | 19 | 21 | 22 | 20 | 17 | 17 | 22 | 20 | 28 | 23 | 14 | 14 | 14 | – |
| Smelting and refining costs ($M) | (207) | (3) | (6) | (8) | (6) | (9) | (9) | (10) | (11) | (9) | (9) | (12) | (15) | (17) | (11) | (13) | (15) | (16) | (9) | (6) | (6) | (6) | – |
| Total revenue ($M) | 10,929 | 264 | 553 | 567 | 574 | 612 | 583 | 633 | 634 | 494 | 528 | 593 | 681 | 680 | 511 | 555 | 671 | 643 | 423 | 254 | 237 | 237 | – |
| Unit Costs | |||||||||||||||||||||||
| Gold production costs ($/oz) | 1,312(5) | 1,418 | 1,403 | 1,318 | 1,251 | 1,122 | 1,206 | 1,131 | 1,159 | 1,480 | 1,380 | 1,256 | 1,138 | 1,194 | 1,573 | 1,395 | 1,137 | 1,235 | 1,549 | 1,986 | 2,047 | 1,389 | – |
| Copper production costs ($/lb) | 2.44(5) | 2.25 | 2.25 | 2.30 | 2.32 | 2.13 | 2.36 | 2.15 | 2.20 | 2.80 | 2.60 | 2.42 | 2.15 | 2.24 | 2.95 | 2.61 | 2.12 | 2.31 | 2.89 | 3.71 | 3.82 | 2.59 | – |
| AISC on a by-product basisNG ($/oz) | 950(5) | 1,494 | 1,454 | 1,080 | 1,187 | 746 | 1,067 | 906 | 623 | 1,274 | 1,065 | 710 | 363 | 284 | 1,325 | 891 | 510 | 537 | 1,234 | 2,056 | 2,146 | 770 | – |
| Outflows | |||||||||||||||||||||||
| Operating costs ($M) | (6,492) | (159) | (325) | (328) | (321) | (341) | (344) | (342) | (344) | (342) | (345) | (351) | (354) | (357) | (347) | (349) | (343) | (338) | (274) | (219) | (219) | (148) | – |
| Selling and marketing costs(4) ($M) | (159) | (5) | (8) | (10) | (6) | (9) | (8) | (9) | (9) | (7) | (7) | (9) | (11) | (11) | (7) | (8) | (9) | (9) | (5) | (4) | (4) | (3) | – |
| Royalties ($M) | (298) | (6) | (9) | (11) | (13) | (15) | (9) | (6) | (13) | (12) | (7) | (10) | (14) | (28) | (30) | (13) | (16) | (32) | (27) | (13) | (4) | (3) | (7) |
| Capital expenditures ($M) | (925) | (39) | (89) | (56) | (113) | (47) | (75) | (84) | (107) | (93) | (26) | (24) | (29) | (21) | (25) | (23) | (24) | (21) | (12) | (9) | (6) | (3) | – |
| Lease payments ($M) | (99) | (3) | (5) | (5) | (5) | (5) | (5) | (5) | (5) | (5) | (5) | (5) | (5) | (5) | (5) | (5) | (5) | (5) | (3) | (3) | (3) | (1) | – |
| Reclamation expenditures ($M) | (96) | – | – | – | – | – | – | – | – | – | – | – | – | – | – | – | – | – | – | – | – | – | (96) |
| Cash taxes ($M) | (733) | (2) | (4) | (5) | (5) | (5) | (5) | (39) | (58) | (14) | (35) | (60) | (91) | (89) | (33) | (54) | (98) | (87) | (35) | (2) | (1) | (11) | – |
| Total outflows ($M) | (8,802) | (213) | (441) | (414) | (463) | (422) | (446) | (486) | (536) | (474) | (427) | (459) | (504) | (511) | (448) | (453) | (497) | (492) | (357) | (250) | (237) | (169) | (103) |
| Net cash flow ($M) | 2,127 | 51 | 113 | 153 | 111 | 189 | 137 | 147 | 98 | 20 | 102 | 134 | 177 | 169 | 63 | 102 | 174 | 151 | 66 | 3 | 1 | 68 | (103) |
| NPV @ 5% ($M) | 1,492 | – | – | – | – | – | – | – | – | – | – | – | – | – | – | – | – | – | – | – | – | – | – |
(1) Ore processed tonnes include processing stockpiled ore accumulated prior to July 1, 2025.
(2) Mount Milligan metal sold quantities are presented on 100%-basis.
(3) Gold and copper revenues include impact from the Mount Milligan streaming arrangement with Royal Gold and the Additional Agreement.
(4) Selling and marketing costs include ocean freight.
(5) Unit cost LOM average.
“Mt” refers to millions of tonnes; “koz” to thousands of ounces; “Mlb” to millions of pounds; and “kdmt” to thousands of dry metric tonnes. NOTE: Totals may not add due to rounding.
Project Assumptions
The economic analysis of the Project was performed using the following assumptions and basis:
Reserve and Resource Additional Footnotes
Mineral reserve and mineral resource estimates are forward-looking information and are based on key assumptions and are subject to material risk factors. If any event arising from these risks occurs, the Company’s business, prospects, financial condition, results of operations or cash flows, and the market price of Centerra’s shares could be adversely affected. Additional risks and uncertainties not currently known to the Company, or that are currently deemed immaterial, may also materially and adversely affect the Company’s business operations, prospects, financial condition, results of operations or cash flows, and the market price of Centerra’s shares. See the section entitled “Risk That Can Affect Centerra’s Business” in the Company’s Management’s Discussion and Analysis (MD&A) for the three months ended June 30, 2025, available on SEDAR+ at www.sedarplus.ca and EDGAR at www.sec.gov/edgar and see also the discussion below under the heading “Cautionary Statement on Forward-Looking Information”.
NI 43-101 Technical Report
A technical report on Mount Milligan will be prepared in accordance with National Instrument 43-101 Standards of Disclosure for Mineral Projects and will be filed within 45 days of this news release on SEDAR+ at www.sedarplus.ca and EDGAR www.sec.gov/edgar.
About Centerra Gold
Centerra Gold Inc. is a Canadian-based gold mining company focused on operating, developing, exploring and acquiring gold and copper properties in North America, Türkiye, and other markets worldwide. Centerra operates two mines: the Mount Milligan Mine in British Columbia, Canada, and the Öksüt Mine in Türkiye. The Company also owns the Kemess Project in British Columbia, Canada, the Goldfield Project in Nevada, United States, and owns and operates the Molybdenum Business Unit in the United States and Canada. Centerra’s shares trade on the Toronto Stock Exchange (“TSX”) under the symbol CG and on the New York Stock Exchange (“NYSE”) under the symbol CGAU. The Company is based in Toronto, Ontario, Canada.
For more information:
Lisa Wilkinson
Vice President, Investor Relations & Corporate Communications
(416) 204-3780
Lisa.Wilkinson@centerragold.com
Additional information on Centerra is available on the Company’s website at www.centerragold.com, on SEDAR+ at www.sedarplus.ca and EDGAR at www.sec.gov/edgar.
CPM Group’s 10-Year Copper Outlook are now available. ... READ MORE
Arizona Gold and Silver Inc. (TSX-V: AZS) (OTCQB: AZASF) is ple... READ MORE
Brixton Metals Corporation (TSX-V: BBB) (OTCQX: BBBXF) is pleased... READ MORE
Valkea Resources Corp. (TSX-V: OZ) is pleased to announce the clo... READ MORE
Tiger Gold Corp. (TSX-V: TIGR) (FSE: D150) (OTCQB: TGRGF) is plea... READ MORE


