


Centerra Gold Inc. (TSX: CG) (NYSE: CGAU) announces its 2025 year-end estimates for mineral reserves and mineral resources. Proven and probable gold mineral reserves increased 58% year-over-year to 5.5 million ounces, and proven and probable copper mineral reserves increased 49% year-over-year to 1.7 billion pounds, as of December 31, 2025. Measured and indicated gold mineral resources inclusive of reserves were 10.8 million ounces and measured and indicated copper mineral resources inclusive of reserves were 3.6 billion pounds, as of December 31, 2025.
In 2025, Centerra continued to advance its organic growth pipeline and updated its mineral reserves and mineral resources estimates for the Goldfield project, the Mount Milligan mine and the Kemess project. As a result, the 2025 year-end mineral reserve and mineral resource estimates for these assets are consistent with the figures disclosed in those respective technical updates with minor adjustments to Mount Milligan related to depletion in 2025 since the Pre-Feasibility Study.
Centerra Year-End Gold Mineral Reserves and Mineral Resources(1)
| 2025 | 2024(2) | |||||
| Property | Tonnes (kt) |
Grade (g/t) |
Contained Gold (koz) |
Tonnes (kt) |
Grade (g/t) |
Contained Gold (koz) |
| Total Proven and Probable Gold Mineral Reserves | ||||||
| Mount Milligan | 470,332 | 0.28 | 4,294 | 264,512 | 0.33 | 2,826 |
| Öksüt | 15,355 | 1.02 | 503 | 20,080 | 1.03 | 662 |
| Goldfield | 33,348 | 0.66 | 706 | – | – | – |
| Total | 519,034 | 0.33 | 5,504 | 284,591 | 0.38 | 3,488 |
| Total Measured and Indicated Gold Mineral Resources, Inclusive of Reserves | ||||||
| Mount Milligan | 714,992 | 0.27 | 6,262 | 467,510 | 0.30 | 4,457 |
| Öksüt | 16,769 | 0.98 | 530 | 22,947 | 0.99 | 734 |
| Kemess Main – Open Pit | 170,513 | 0.30 | 1,668 | 111,682 | 0.27 | 980 |
| Kemess South – Open Pit | 13,204 | 0.37 | 158 | – | – | – |
| Kemess UG – Underground | 33,223 | 0.82 | 877 | 139,920 | 0.50 | 2,265 |
| Kemess East – Underground | 27,491 | 0.64 | 565 | 93,454 | 0.39 | 1,182 |
| Goldfield | 37,034 | 0.67 | 794 | 30,833 | 0.71 | 706 |
| Total | 1,013,225 | 0.33 | 10,855 | 866,346 | 0.37 | 10,324 |
| Inferred Gold Mineral Resources | ||||||
| Mount Milligan | 27,901 | 0.37 | 334 | 27,924 | 0.44 | 395 |
| Öksüt | – | – | – | 236 | 0.88 | 7 |
| Kemess Main – Open Pit | 237,050 | 0.30 | 2,299 | 13,691 | 0.26 | 116 |
| Kemess South – Open Pit | 198 | 0.34 | 2 | – | – | – |
| Kemess UG – Underground | 20,094 | 0.74 | 481 | – | – | – |
| Kemess East – Underground | 42,252 | 0.57 | 772 | – | – | – |
| Goldfield | 2,121 | 0.33 | 23 | 2,267 | 0.41 | 30 |
| Total | 329,616 | 0.37 | 3,911 | 44,118 | 0.38 | 548 |
(1) As of December 31, 2025. Refer to the Table “Centerra Gold 2025 Year-End Mineral Reserve Summary” and “Centerra Gold 2025 Year-End Mineral Resource Summary” including their respective footnotes and the “Additional Footnotes” section below.
(2) Mineral resources inclusive of mineral reserves, as of December 31, 2024, is for comparative purposes only. See 2024 year-end mineral reserves and resources news release dated February 20, 2025, for mineral resources exclusive of mineral reserves as of December 31, 2024.
Centerra Year-End Copper Mineral Reserves and Mineral Resources(1)
| 2025 | 2024(2) | |||||
| Property | Tonnes (kt) |
Grade (% Copper) |
Contained Copper (Mlbs) |
Tonnes (kt) |
Grade (% Copper) |
Contained Copper (Mlbs) |
| Proven and Probable Copper Mineral Reserves | ||||||
| Mount Milligan | 470,332 | 0.17 | 1,716 | 264,512 | 0.20 | 1,150 |
| Total | 470,332 | 0.17 | 1,716 | 264,512 | 0.20 | 1,150 |
| Measured and Indicated Copper Mineral Resources, Inclusive of Reserves | ||||||
| Mount Milligan | 714,992 | 0.15 | 2,411 | 467,510 | 0.19 | 1,915 |
| Kemess Main – Open Pit | 170,513 | 0.15 | 575 | 111,682 | 0.14 | 337 |
| Kemess South – Open Pit | 13,204 | 0.13 | 38 | – | – | – |
| Kemess UG – Underground | 33,223 | 0.36 | 265 | 139,920 | 0.25 | 779 |
| Kemess East – Underground | 27,491 | 0.44 | 268 | 93,454 | 0.30 | 628 |
| Total | 959,422 | 0.17 | 3,556 | 812,566 | 0.21 | 3,659 |
| Inferred Copper Mineral Resources | ||||||
| Mount Milligan | 27,901 | 0.08 | 50 | 27,924 | 0.12 | 74 |
| Kemess Main – Open Pit | 237,050 | 0.13 | 682 | 13,691 | 0.16 | 48 |
| Kemess South – Open Pit | 198 | 0.08 | 0 | – | – | – |
| Kemess Underground – UG | 20,094 | 0.33 | 148 | – | – | – |
| Kemess Underground – East | 42,252 | 0.42 | 393 | – | – | – |
| Total | 327,495 | 0.18 | 1,273 | 41,615 | 0.13 | 122 |
(1) As of December 31, 2025. Refer to the Table “Centerra Gold 2025 Year-End Mineral Reserve Summary” and “Centerra Gold 2025 Year-End Mineral Resource Summary” including their respective footnotes and the “Additional Footnotes” section below.
(2) Mineral resources inclusive of mineral reserves, as of December 31, 2024, is for comparative purposes only. See 2024 year-end mineral reserves and resources news release dated February 20, 2025, for mineral resources exclusive of mineral reserves as of December 31, 2024.
Exploration Update
Exploration activities in the fourth quarter of 2025 included drilling, surface rock and soil sampling, geological mapping, and geophysical surveying, targeting gold and copper mineralization at the Company’s projects and properties in Canada, Türkiye, and the United States.
2025 Exploration Highlights
2026 Exploration Outlook
Mount Milligan
Figure 1: Plan view of the Mount Milligan deposit showing the 2025 resource shell and reserve pit with planned 2026 drillholes
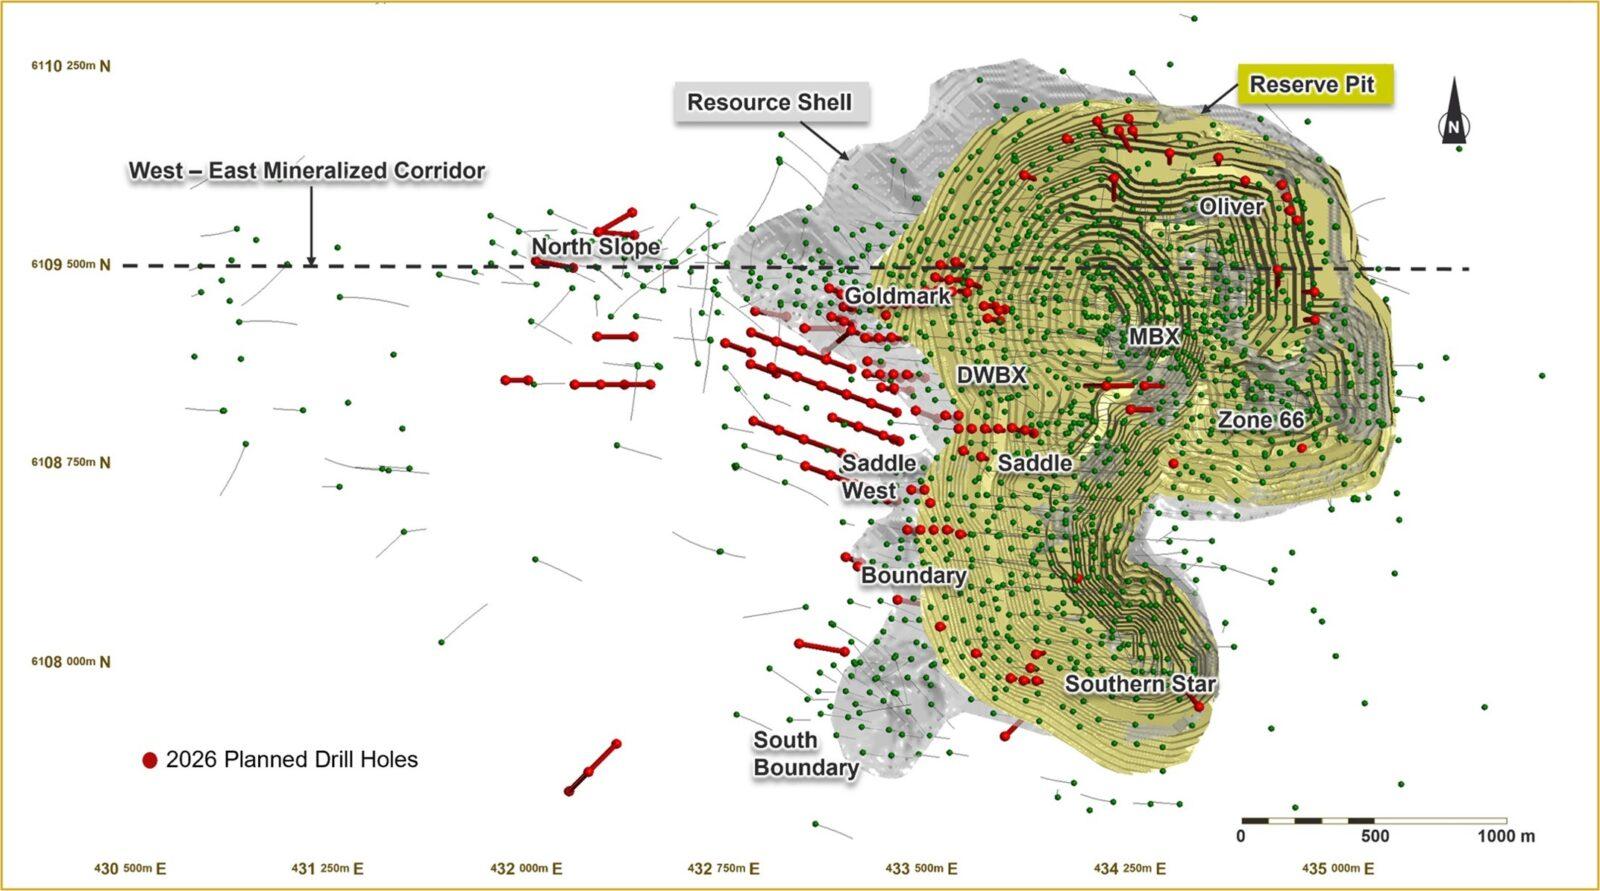
Figure 2: East-West cross section of the Mount Milligan 2025 resource shells and reserve pit (looking north), showing gold modeled blocks
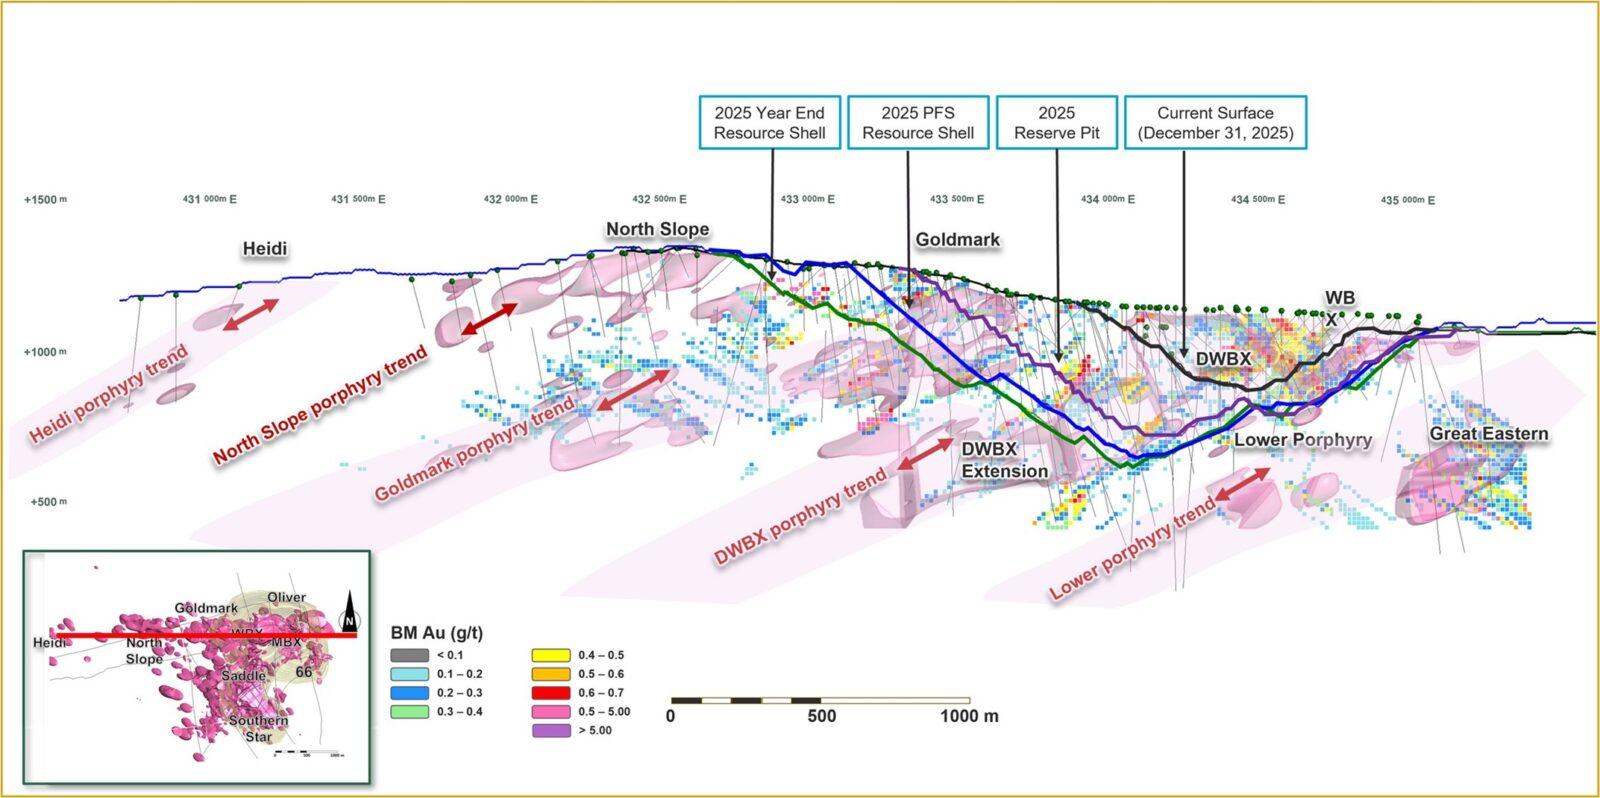
The Goldmark zone is directly west of the current Mount Milligan pit design, situated above the high grade DWBX zone. In 2025, drilling continued to test and infill the western extent of the Goldmark mineralization that had been intersected in previous drill programs. Shallow porphyry-style gold and copper mineralization is hosted at the margins of dykes and the Goldmark stock. High gold-low copper (“HGLC”) style mineralization occurs throughout the zone above the gold-copper porphyry mineralization. The results show potential for shallow resource additions and the extension of mineralization west of the existing pit boundary. Significant results include:
Hole #25-1706: 17.0m @ 9.39 g/t gold, 0.132% copper from 72 metres
Hole #25-1706: 42.0m @ 1.95 g/t Au, 0.154% Cu from 186m
Hole #25-1705: 48.3m @ 2.60 g/t Au, 0.176% Cu from 66.7m
Hole #25-1701: 42.0m @ 1.39 g/t Au, 0.100% Cu from 121m
Hole #25-1692: 24.0m @ 1.60 g/t Au, 0.142% Cu from 236m
Hole #25-1725: 2.4m @ 15.97 g/t Au, 0.075% Cu from 69.6m
Hole #25-1746: 12.0m @ 3.08 g/t Au, 0.184% Cu from 27m
Hole #25-1715: 66.8m @ 0.53 g/t Au, 0.192% Cu from 241m
Hole #25-1685: 23.0m @ 1.45 g/t Au, 0.475% Cu from 123m
Hole #25-1710: 98.9m @ 0.23 g/t Au, 0.217% Cu from 185m
The North Slope zone lies approximately 300 to 800 metres west of the Mount Milligan pit design, adjacent to the Goldmark zone. Assays show multiple localized shallow zones of HGLC style mineralization, with higher-grade porphyry-style gold and copper mineralization related to the North Slope stock intersected at depth. Significant results include:
Hole #25-1750: 10.0m @ 3.93 g/t Au, 0.077% Cu from 99m
Hole #25-1733: 24.0m @ 1.47 g/t Au, 0.061% Cu from 158m
Hole #25-1750: 49.6m @ 0.67 g/t Au, 0.03% Cu from 114m
Hole #25-1749: 3.0m @ 9.00 g/t Au, 0.304% Cu from 90m
Hole #25-1751: 12.0m @ 1.89 g/t Au, 0.086% Cu from 35m
Hole #25-1756: 24.0m @ 0.55 g/t Au, 0.045% Cu from 74m
Hole #25-1737: 9.3m @ 1.63 g/t Au, 0.034% Cu from 140m
Hole #25-1751: 7.3m @ 2.03 g/t Au, 0.018% Cu from 176m
The Saddle West (including King Richard) zone extends to approximately 800 metres west of the existing Mount Milligan ultimate pit boundary and south of the Goldmark zone. It is interpreted to be the down-dip extension of the Saddle zone in the central part of the deposit. Mineralization is associated with margins of monzonite porphyry dykes, and with transitional to late-stage veins with sericite alteration overprinting early-stage potassic alteration. Results show potential for shallow resource additions and the extension of mineralization west of the existing pit boundary. Significant results include:
Hole #25-1717: 81.7m @ 0.13 g/t Au, 0.214% Cu from 174m
Hole #25-1717: 35.8m @ 0.12 g/t Au, 0.142% Cu from 297m
Hole #25-1724: 61.0m @ 0.16 g/t Au, 0.136% Cu from 345m
Hole #25-1711: 42.6m @ 0.17 g/t Au, 0.122% Cu from 178m
Hole #25-1771: 12.0m @ 0.54 g/t Au, 0.071% Cu from 20m
Hole #25-1771: 28.9m @ 0.21 g/t Au, 0.101% Cu from 38m
The Boundary zone is directly south of the Saddle West zone and west of the Mount Milligan pit design within 200 metres of the current pit operations. Assays show both shallow and deep porphyry-style gold and copper mineralization in the shallow Boundary zone and underlying northwestern extension of the Southern Star composite stock. Mineralization is hosted within dykes and at dyke margins in potassic and within inner propylitic altered andesite tuffs, often overprinted by quartz-sericite-pyrite alteration, with early quartz veins and chalcopyrite ± pyrite veins. Results show potential for shallow resource additions and the extension of mineralization west of the existing pit boundary. Significant results include:
Hole #25-1770: 64.5m @ 0.44 g/t Au, 0.224% Cu from 117m
Hole #25-1767: 27.4m @ 1.00 g/t Au, 0.134% Cu from 37m
Hole #25-1767: 4.8m @ 4.79 g/t Au, 0.153% Cu from 69m
Hole #25-1767: 20.8m @ 0.39 g/t Au, 0.118% Cu from 216m
Hole #25-1763: 8.0m @ 2.18 g/t Au, 0.054% Cu from 294m
Hole #25-1763: 1.6m @ 9.02 g/t Au, 0.114% Cu from 83m
Hole #25-1755: 101.5m @ 0.18 g/t Au, 0.224% Cu from 455m
Hole #25-1755: 39.1m @ 0.28 g/t Au, 0.158% Cu from 83m
Hole #25-1755: 30.0m @ 0.36 g/t Au, 0.048% Cu from 222m
Hole #25-1765: 43.9m @ 0.23 g/t Au, 0.162% Cu from 307m
Hole #25-1765: 26.4m @ 0.31 g/t Au, 0.050% Cu from 259m
Hole #25-1765: 32.9m @ 0.19 g/t Au, 0.109% Cu from 65m
The South Boundary zone is directly west of the current Mount Milligan Southern Star pit, extending up to 600 metres southwest of the current mining operations. Mineralization is associated with transitional to late-stage veins including pyrite stringers and semi-massive pyrite ± magnetite veins spatially related to narrow faults and breccia in volcanic rocks with quartz-sericite-pyrite-carbonate (“QSPC”) alteration. Mineralization is also hosted in narrow faulted and brecciated monzonite porphyry dykes with early stage potassic alteration and associated veins that have been overprinted by the QSPC assemblage and later stage veins. Drill results at the South Boundary zone show series of high-grade gold values. This relatively shallow HGLC-style mineralization has the potential to support a satellite pit west of the current operation. Significant results include:
Hole #25-1604: 13.8m @ 7.19 g/t Au, 0.162% Cu from 192m
Hole #25-1604: 5.0m @ 3.59 g/t Au, 0.013% Cu from 316m
Hole #25-1604: 15.2m @ 0.72 g/t Au, 0.060% Cu from 156m
Hole #25-1597: 24.7m @ 1.29 g/t Au, 0.020% Cu from 13m
Hole #25-1579: 13.7m @ 1.36 g/t Au, 0.038% Cu from 8m
Hole #25-1579: 6.6m @ 1.85 g/t Au, 0.070% Cu from 48m
Hole #25-1601: 13.0m @ 1.62 g/t Au, 0.041% Cu from 163m
Hole #25-1590: 18.0m @ 1.02 g/t Au, 0.017% Cu from 238m
Hole #25-1644: 14.0m @ 1.27 g/t Au, 0.081% Cu from 226m
Hole #25-1644: 5.0m @ 2.45 g/t Au, 0.073% Cu from 207m
Hole #25-1595: 55.0m @ 0.27 g/t Au, 0.086% Cu from 20m
Hole #25-1595: 33.9m @ 0.36 g/t Au, 0.031% Cu from 173m
Hole #25-1647: 35.2m @ 0.39 g/t Au, 0.060% Cu from 69m
Hole #25-1592: 5.0m @ 2.69 g/t Au, 0.013% Cu from 131m
Hole #25-1582: 11.9m @ 1.10 g/t Au, 0.097% Cu from 18m
Hole #25-1639: 24.0m @ 0.48 g/t Au, 0.021% Cu from 283m
Hole #25-1639: 7.5m @ 1.38 g/t Au, 0.023% Cu from 52m
Hole #25-1587: 18.4m @ 0.56 g/t Au, 0.071% Cu from 24m
The plan for 2026 is to continue to infill the northern and western rims of the reserve pit and explore the western margins of the resource shell to upgrade inferred resources to indicated between Goldmark and North Slope and to expand resources at Goldmark, Saddle West and Boundary areas.
Kemess Project
Figure 3: A long sectional view of the Kemes deposit showing a 0.2 g/t Au shell. The dotted line in the figure represents approximately 47% of the total resource that used for the Kemess PEA
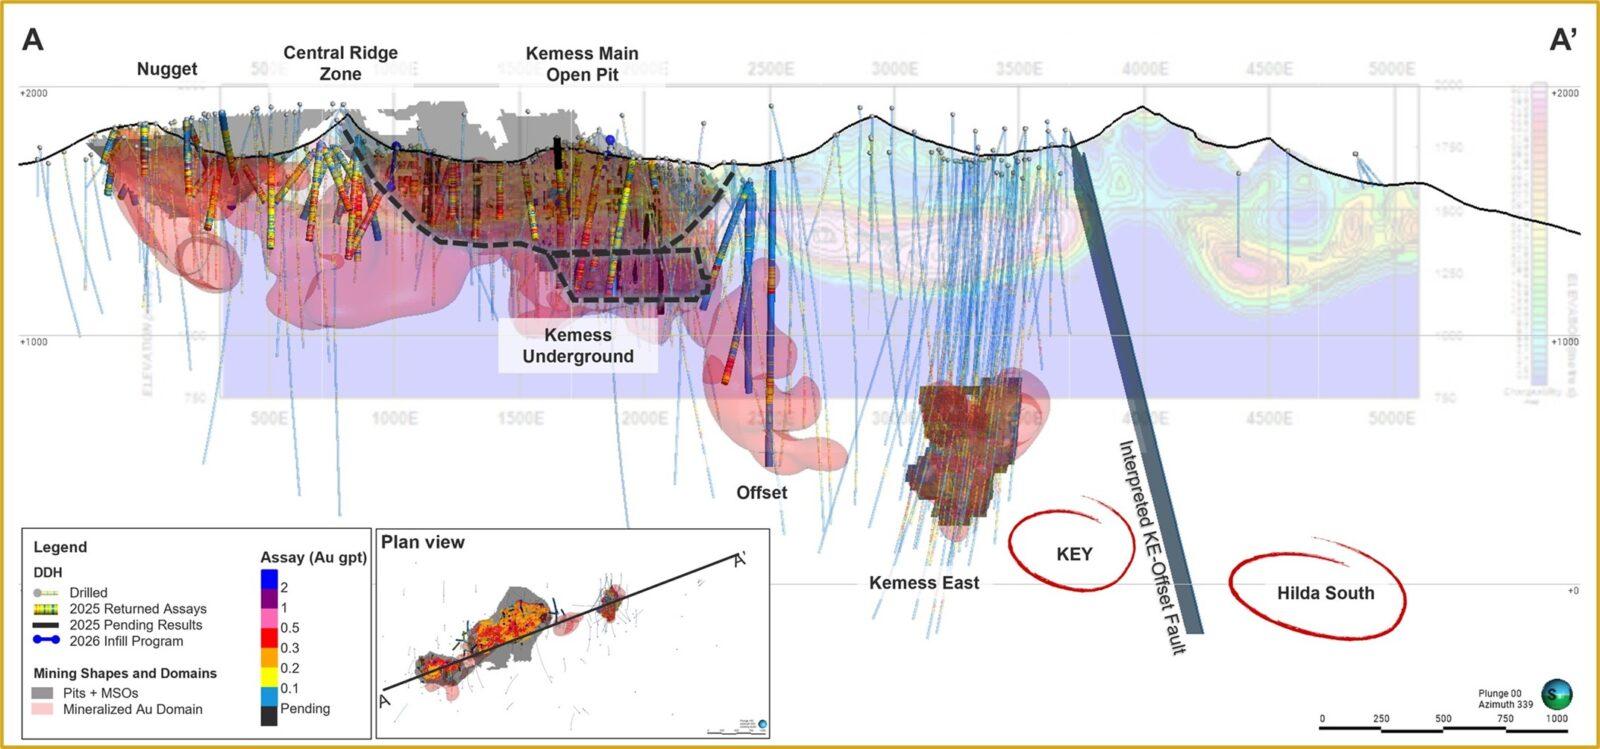
The Kemess Main Open Pit and Kemess Underground areas extend over 2.5 kilometres east-west, and 600 metres north-south. The deposit consists of a low-grade mineralized zone that extends from surface to a depth of zero to 300 metres below the surface on its western flank, including the Nugget zone and Kemess Open Pit, and a higher-grade zone with values greater than 0.5% grams gold per tonne and 0.5% copper from 300 to 550 metres below surface on the eastern side, which is the focus of the Kemess Underground deposit. The highest-grade mineralization of the Kemess Underground deposit is centered on a Black Lake suite porphyritic monzodiorite to diorite intrusion that dips shallow to moderately south. Assay results from 2025 infill drilling show wide intervals of shallow gold and copper mineralization. In the western portion of the deposit, the upper approximately 300 metres comprises phyllic altered volcanic rocks with underlying potassically altered volcanic rocks, both domains host copper-gold mineralization. Significant results received from the 2025 drilling include:
Hole #KN-25-011: 297.0m @ 0.33 g/t Au, 0.154% Cu from 5m
Hole #KN-25-014: 225.0m @ 0.39 g/t Au, 0.169% Cu from 2m
Hole #KN-25-016: 222.1m @ 0.42 g/t Au, 0.210% Cu from 5m
Hole #KN-25-020: 267.0m @ 0.49 g/t Au, 0.234% Cu from 8m
Hole #KN-25-023: 222.0m @ 0.32 g/t Au, 0.163% Cu from 5m
Hole #KN-25-026: 273.0m @ 0.32 g/t Au, 0.146% Cu from 5m
Hole #KN-25-027: 264.0m @ 0.24 g/t Au, 0.132% Cu from 12m
Hole #KN-25-029: 597.0m @ 0.34 g/t Au, 0.189% Cu from 5m
Hole #KN-25-042: 549.0m @ 0.41 g/t Au, 0.207% Cu from 2m
Hole #KN-25-045: 425.1m @ 0.39 g/t Au, 0.152% Cu from 10m
Hole #KN-25-048: 384.0m @ 0.28 g/t Au, 0.148% Cu from 18m
Hole #KN-25-049: 394.4m @ 0.33 g/t Au, 0.157% Cu from 6m
Hole #KN-25-053: 319.0m @ 0.30 g/t Au, 0.151% Cu from 6m
Hole #KN-25-055: 200.7m @ 0.36 g/t Au, 0.155% Cu from 140m
Hole #KN-25-056: 195.0m @ 0.33 g/t Au, 0.140% Cu from 5m
Hole #KN-25-057: 452.1m @ 0.29 g/t Au, 0.185% Cu from 59m
Hole #KN-25-061: 300.4m @ 0.25 g/t Au, 0.167% Cu from 81m
Hole #KN-25-081: 241.0m @ 0.27 g/t Au, 0.160% Cu from 5m
The Nugget zone is located along the Kemess Main trend, approximately 1.5 kilometres west of the Kemess Underground deposit. The more distal, lower-temperature gold ± copper mineralization is hosted by Takla rocks that were intruded by dykes belonging to the Black Lake intrusive suite. Dykes are between 10 to 100 metres wide and are generally associated with weaker alteration of the host rocks than alteration at Kemess Underground. The 2025 exploration drilling at Nugget continued to expand shallow porphyry mineralization, with varying gold to copper ratios, typically high gold to low copper hosted in volcanic rocks, with an increasing gold to copper ratio moving west. Significant results include:
Hole #KN-25-001: 120.9m @ 0.46 g/t Au, 0.092% Cu from 180m
Hole #KN-25-003: 110.0m @ 0.35 g/t Au, 0.113% Cu from 192m
Hole #KN-25-005: 206.5m @ 0.36 g/t Au, 0.077% Cu from 170m
Hole #KN-25-007: 214.0m @ 0.46 g/t Au, 0.089% Cu from 92m
Hole #KN-25-012: 217.4m @ 0.27 g/t Au, 0.033% Cu from 69m
Hole #KN-25-025: 166.6m @ 0.39 g/t Au, 0.072% Cu from 4m
Hole #KN-25-028: 215.7m @ 0.45 g/t Au, 0.072% Cu from 6m
Hole #KN-25-031: 166.0m @ 0.44 g/t Au, 0.088% Cu from 6m
Hole #KN-25-034: 243.0m @ 0.27 g/t Au, 0.129% Cu from 164m
Hole #KN-25-036: 180.0m @ 0.27 g/t Au, 0.098% Cu from 131m
Hole #KN-25-039: 163.2m @ 0.40 g/t Au, 0.108% Cu from 27m
Hole #KN-25-040: 399.0m @ 0.30 g/t Au, 0.095% Cu from 101m
Hole #KN-25-043: 132.0m @ 0.47 g/t Au, 0.101% Cu from 21m
Hole #KN-25-044: 330.0m @ 0.32 g/t Au, 0.103% Cu from 138m
Hole #KN-25-047: 289.8m @ 0.36 g/t Au, 0.080% Cu from 18m
Hole #KN-25-050: 271.9m @ 0.24 g/t Au, 0.052% Cu from 16m
Hole #KN-25-060: 379.5m @ 0.38 g/t Au, 0.148% Cu from 16m
During 2026, Centerra is expected to complete the infill drilling in the Kemess Main zone, as well as at the Kemess Offset zone to help bridge the mineralization gap between Kemess Underground and Kemess East. Beyond Kemess East, additional exploration potential exists along the eastern extension of the Kemess Main mineralization trend, including the KEY and Hilda South targets.
The KEY zone is interpreted to represent an eastern extension of the Kemess East system. Historic shallow drilling at Hilda South has intersected anomalous arsenic, zinc, and lead values which mirror the geochemical signature found above the main mineralized zone at Kemess East. Step-out drilling along this trend, extending eastward from Kemess East, could define better future exploration targets.
Goldfield and Oakley
Öksüt and Türkiye
A full listing of the drill results has been filed on SEDAR+ at www.sedarplus.ca, EDGAR at www.sec.gov/edgar, and is available on the Company’s website at www.centerragold.com.
Centerra Gold 2025 Year-End Mineral Reserve Summary(1) as at December 31, 2025
(see additional footnotes below)
| Centerra Gold Inc. Mineral Reserve Summary | ||||||||||
| Mass | Grade | Contained Metal | ||||||||
| Tonnes (kt) | Au g/t | Ag g/t | Cu % | Mo % | Au koz | Ag koz | Cu Mlbs | Mo Mlbs | ||
| Mount Milligan(2) | ||||||||||
| Proven | 179,919 | 0.31 | 0.17 | 1,773 | 666 | |||||
| Probable | 290,413 | 0.27 | 0.16 | 2,522 | 1,050 | |||||
| Proven + Probable | 470,332 | 0.28 | 0.17 | 4,294 | 1,716 | |||||
| Öksüt | ||||||||||
| Proven | 827 | 0.73 | 20 | |||||||
| Probable | 14,527 | 1.04 | 484 | |||||||
| Proven + Probable | 15,355 | 1.02 | 503 | |||||||
| Goldfield | ||||||||||
| Proven | 9,944 | 1.04 | 334 | |||||||
| Probable | 23,404 | 0.49 | 372 | |||||||
| Proven + Probable | 33,348 | 0.66 | 706 | |||||||
| Thompson Creek | ||||||||||
| Proven | 44,885 | 0.076 | 75 | |||||||
| Probable | 68,104 | 0.057 | 86 | |||||||
| Proven + Probable | 112,989 | 0.065 | 161 | |||||||
(1) Centerra’s equity interests as of this news release are as follows: Mount Milligan 100%, Öksüt 100%, Goldfield 100% and Thompson Creek 100%. Mineral reserves and resources for these properties are presented on a 100% basis. Numbers may not add up due to rounding.
(2) Production at Mount Milligan is subject to a streaming agreement with RGLD Gold AG and Royal Gold, Inc. (collectively, “Royal Gold”) which entitles Royal Gold to 35% of gold sales and 18.75% of copper sales from Mount Milligan. Under the stream arrangement, Royal Gold will pay a reduced price per ounce of gold delivered. Mineral reserves and resources for the Mount Milligan property are presented on a 100% basis.
Centerra Gold 2025 Year-End Mineral Resource Summary(1,2,3) as at December 31, 2025
(see additional footnotes below)
| Centerra Gold Inc. Mineral Resource Summary | ||||||||||
| Mass | Grade | Contained Metal | ||||||||
| Tonnes (kt) | Au g/t | Ag g/t | Cu % | Mo % | Au koz | Ag koz | Cu Mlbs | Mo Mlbs | ||
| Mount Milligan(4) | ||||||||||
| Measured | 360,446 | 0.27 | 0.17 | 3,116 | 1,352 | |||||
| Indicated | 354,545 | 0.28 | 0.14 | 3,146 | 1,058 | |||||
| Measured + Indicated | 714,992 | 0.27 | 0.15 | 6,262 | 2,411 | |||||
| Inferred | 27,901 | 0.37 | 0.08 | 334 | 50 | |||||
| Öksüt | ||||||||||
| Measured | 11,773 | 1.02 | 385 | |||||||
| Indicated | 4,996 | 0.91 | 146 | |||||||
| Measured + Indicated | 16,769 | 0.98 | 530 | |||||||
| Inferred | 0 | 0.00 | 0 | |||||||
| Kemess Main – Open Pit | ||||||||||
| Measured | ||||||||||
| Indicated | 170,513 | 0.30 | 1.12 | 0.15 | 1,668 | 6,155 | 575 | |||
| Measured + Indicated | 170,513 | 0.30 | 1.12 | 0.15 | 1,668 | 6,155 | 575 | |||
| Inferred | 237,050 | 0.30 | 1.06 | 0.13 | 2,299 | 8,108 | 682 | |||
| Kemess South – Open Pit | ||||||||||
| Measured | ||||||||||
| Indicated | 13,204 | 0.37 | 0.68 | 0.13 | 158 | 289 | 38 | |||
| Measured + Indicated | 13,204 | 0.37 | 0.68 | 0.13 | 158 | 289 | 38 | |||
| Inferred | 198 | 0.34 | 0.42 | 0.08 | 2 | 3 | 0 | |||
| Kemess UG – Underground | ||||||||||
| Measured | ||||||||||
| Indicated | 33,223 | 0.82 | 2.48 | 0.36 | 877 | 2,652 | 265 | |||
| Measured + Indicated | 33,223 | 0.82 | 2.48 | 0.36 | 877 | 2,652 | 265 | |||
| Inferred | 20,094 | 0.74 | 2.22 | 0.33 | 481 | 1,433 | 148 | |||
| Kemess East – Underground | ||||||||||
| Measured | ||||||||||
| Indicated | 27,491 | 0.64 | 1.91 | 0.44 | 565 | 1,684 | 268 | |||
| Measured + Indicated | 27,491 | 0.64 | 1.91 | 0.44 | 565 | 1,684 | 268 | |||
| Inferred | 42,252 | 0.57 | 1.92 | 0.42 | 772 | 2,602 | 393 | |||
| Goldfield | ||||||||||
| Measured | 10,418 | 1.08 | 363 | |||||||
| Indicated | 26,616 | 0.50 | 432 | |||||||
| Measured + Indicated | 37,034 | 0.67 | 794 | |||||||
| Inferred | 2,121 | 0.33 | 23 | |||||||
| Thompson Creek | ||||||||||
| Measured | 50,522 | 0.074 | 83 | |||||||
| Indicated | 112,892 | 0.058 | 143 | |||||||
| Measured + Indicated | 163,415 | 0.063 | 226 | |||||||
| Inferred | 18,327 | 0.075 | 30 | |||||||
| Endako | ||||||||||
| Measured | 47,100 | 0.050 | 48 | |||||||
| Indicated | 122,175 | 0.040 | 118 | |||||||
| Measured + Indicated | 169,275 | 0.043 | 166 | |||||||
| Inferred | 47,325 | 0.040 | 44 | |||||||
(1) Centerra’s equity interests as of this news release are as follows: Mount Milligan 100%, Öksüt 100%, Kemess Main – Open Pit, Kemess South – Open Pit, Kemess UG – Underground, Kemess East – Underground 100%, Goldfield 100%, Thompson Creek 100% and Endako 75%. Mineral reserves and resources for these properties are presented on a 100% basis. Numbers may not add up due to rounding.
(2) Mineral resources are inclusive of mineral reserves. Mineral resources do not have demonstrated economic viability.
(3) Inferred mineral resources have a great amount of uncertainty as to their existence and as to whether they can be mined economically. It cannot be assumed that all or part of the inferred mineral resources will ever be upgraded to a higher category.
(4) Production at Mount Milligan is subject to a streaming agreement with Royal Gold which entitles Royal Gold to 35% of gold sale and 18.75% of copper sales from Mount Milligan. Under the stream arrangement, Royal Gold will pay a reduced price per ounce of gold delivered. Mineral reserves and resources for the Mount Milligan property are presented on a 100% basis.
Additional Footnotes
General
Mount Milligan
Öksüt
Kemess
Thompson Creek
Endako
Goldfield
Goldfield Reserves
Goldfield Resources
Qualified Person – Mineral Reserves and Resources
Christopher Richings, Professional Engineer, member of the Professional Engineers of Ontario and Engineers and Geoscientists British Columbia and Centerra’s Vice President, Technical Services, has reviewed and approved the scientific and technical information contained in this news release. Mr. Richings is a “qualified person” within the meaning of the Canadian Securities Administrator’s NI 43-101 Standards of Disclosure for Mineral Projects.
All mineral reserve and resources have been estimated in accordance with the standards of the Canadian Institute of Mining, Metallurgy and Petroleum and NI 43-101.
Mineral reserve and mineral resource estimates are forward-looking information and are based on key assumptions and are subject to material risk factors. If any event arising from these risks occurs, the Company’s business, prospects, financial condition, results of operations or cash flows, and the market price of Centerra’s shares could be adversely affected. Additional risks and uncertainties not currently known to the Company, or that are currently deemed immaterial, may also materially and adversely affect the Company’s business operations, prospects, financial condition, results of operations or cash flows, and the market price of Centerra’s shares. See the section entitled “Risk That Can Affect Centerra’s Business” in the Company’s annual Management’s Discussion and Analysis (MD&A) for the quarter-ended March 31, 2025, available on SEDAR+ at www.sedarplus.ca and EDGAR at www.sec.gov/edgar and see also the discussion below under the heading “Caution Regarding Forward-looking Information”.
Qualified Person & QA/QC – Exploration
Exploration information and related scientific and technical information in this document regarding the Mount Milligan Mine were prepared, reviewed, verified, and compiled in accordance with the standards of NI 43-101 by Cheyenne Sica, Member of the Association of Professional Geoscientists Ontario and Member of Engineers and Geoscientists British Columbia, and Exploration Manager at Centerra’s Mount Milligan Mine, who is the qualified person for the purpose of NI 43-101. Sample preparation, analytical techniques, laboratories used, and quality assurance and quality control protocols used during the exploration drilling programs are done consistent with industry standards while independent certified assay labs are used.
Exploration information and related scientific and technical information in this document regarding the Öksüt Mine, the Goldfield District Project, Oakley Project, and all other exploration projects were prepared, reviewed, verified, and compiled in accordance with the standards of NI 43-101 by Richard Adofo, Member of the Professional Association of Geoscientists Ontario and Vice President, Exploration & Resource at Centerra, who is the qualified person for the purpose of NI 43-101. Sample preparation, analytical techniques, laboratories used, and quality assurance and quality control protocols used during the exploration drilling programs are done consistent with industry standards while independent certified assay labs are used.
All other scientific and technical information presented in this document were prepared in accordance with the standards of the Canadian Institute of Mining, Metallurgy and Petroleum and NI 43-101 and were reviewed, verified, and compiled by Centerra’s geological and mining staff under the supervision of Christopher Richings, Professional Engineer, member of the Engineers and Geoscientists British Columbia and Centerra’s Vice President, Technical Services who is a qualified person for the purpose of NI 43-101.
About Centerra Gold
Centerra Gold Inc. is a Canadian-based gold mining company focused on operating, developing, exploring and acquiring gold and copper properties in North America, Türkiye, and other markets worldwide. Centerra operates two mines: the Mount Milligan Mine in British Columbia, Canada, and the Öksüt Mine in Türkiye. The Company also owns the Kemess Project in British Columbia, Canada, the Goldfield Project in Nevada, United States, and owns and operates the Molybdenum Business Unit in the United States and Canada. Centerra’s shares trade on the Toronto Stock Exchange under the symbol CG and on the New York Stock Exchange under the symbol CGAU. The Company is based in Toronto, Ontario, Canada.
CPM Group’s 10-Year Copper Outlook are now available. ... READ MORE
Arizona Gold and Silver Inc. (TSX-V: AZS) (OTCQB: AZASF) is ple... READ MORE
Brixton Metals Corporation (TSX-V: BBB) (OTCQX: BBBXF) is pleased... READ MORE
Valkea Resources Corp. (TSX-V: OZ) is pleased to announce the clo... READ MORE
Tiger Gold Corp. (TSX-V: TIGR) (FSE: D150) (OTCQB: TGRGF) is plea... READ MORE


