


Centerra Gold Inc. (TSX: CG) (NYSE: CGAU) announces its 2024 year-end estimates for mineral reserves and mineral resources. Proven and probable gold mineral reserves were 3.5 million ounces and proven and probable copper mineral reserves were 1,150 million pounds, as of December 31, 2024. Measured and indicated gold mineral resources were 6.8 million ounces as of December 31, 2024, which includes the initial gold mineral resource at the Goldfield Project of 706 thousand ounces.
Centerra Year-End Gold Mineral Reserves and Mineral Resources(1)
| 2024 | 2023 | |||||
| Property | Tonnes (kt) |
Grade (g/t) |
Contained Gold (koz) |
Tonnes (kt) |
Grade (g/t) |
Contained Gold (koz) |
| Total Proven and Probable Gold Mineral Reserves | ||||||
| Mount Milligan Mine | 264,512 | 0.33 | 2,826 | 250,025 | 0.35 | 2,822 |
| Öksüt Mine | 20,080 | 1.03 | 662 | 25,255 | 1.01 | 819 |
| Total | 284,591 | 0.38 | 3,488 | 275,280 | 0.41 | 3,641 |
| Total Measured and Indicated Gold Mineral Resources | ||||||
| Mount Milligan Mine | 183,971 | 0.26 | 1,566 | 259,860 | 0.27 | 2,333 |
| Öksüt Mine | 2,617 | 0.69 | 58 | 6,752 | 0.55 | 119 |
| Kemess Open Pit | 111,682 | 0.27 | 980 | 111,682 | 0.27 | 980 |
| Kemess Underground | 139,920 | 0.50 | 2,265 | 139,920 | 0.50 | 2,265 |
| Kemess East | 93,454 | 0.39 | 1,182 | 93,454 | 0.39 | 1,182 |
| Goldfield | 30,833 | 0.71 | 706 | – | – | – |
| Total | 562,476 | 0.37 | 6,759 | 611,668 | 0.35 | 6,880 |
| Inferred Gold Mineral Resources | ||||||
| Mount Milligan Mine | 27,924 | 0.44 | 395 | 7,795 | 0.34 | 84 |
| Öksüt Mine | 130 | 1.06 | 4 | 348 | 0.78 | 9 |
| Kemess Open Pit | 13,691 | 0.26 | 116 | 13,691 | 0.26 | 116 |
| Goldfield | 2,267 | 0.41 | 30 | – | – | – |
| Total | 44,012 | 0.39 | 547 | 21,833 | 0.30 | 209 |
(1) As of December 31, 2024. Refer to Tables “Centerra Gold Inc. 2024 Year-End Mineral Reserve and Resource Summary – Gold” and “Centerra Gold Inc. 2024 Year-End Mineral Reserve and Resource Summary – Other Metals”, including their respective footnotes and the “Additional Footnotes” section below.
Centerra Year-End Copper Mineral Reserves and Mineral Resources(1)
| 2024 | 2023 | |||||
| Property | Tonnes (kt) |
Grade (%Copper) |
Contained Copper (Mlbs) |
Tonnes (kt) |
Grade (% Copper) |
Contained Copper (Mlbs) |
| Proven and Probable Copper Mineral Reserves | ||||||
| Mount Milligan Mine | 264,512 | 0.20 | 1,150 | 250,025 | 0.17 | 961 |
| Total | 264,512 | 0.20 | 1,150 | 250,025 | 0.17 | 961 |
| Measured and Indicated Copper Mineral Resources | ||||||
| Mount Milligan Mine | 183,971 | 0.18 | 732 | 259,860 | 0.15 | 851 |
| Kemess Open Pit | 111,682 | 0.14 | 337 | 111,682 | 0.14 | 337 |
| Kemess Underground | 139,920 | 0.25 | 779 | 139,920 | 0.25 | 779 |
| Kemess East | 93,454 | 0.30 | 628 | 93,454 | 0.30 | 628 |
| Total | 529,027 | 0.21 | 2,476 | 604,916 | 0.19 | 2,595 |
| Inferred Copper Mineral Resources | ||||||
| Mount Milligan Mine | 27,924 | 0.12 | 74 | 7,795 | 0.14 | 24 |
| Kemess Open Pit | 13,691 | 0.16 | 48 | 13,691 | 0.16 | 48 |
| Total | 41,615 | 0.13 | 121 | 21,486 | 0.15 | 72 |
(1) As of December 31, 2024. Refer to Tables “Centerra Gold Inc. 2024 Year-End Mineral Reserve and Resource Summary – Gold” and “Centerra Gold Inc. 2024 Year-End Mineral Reserve and Resource Summary – Other Metals”, including their respective footnotes and the “Additional Footnotes” section below.
Exploration Update
Exploration activities in the fourth quarter of 2024 included drilling, surface rock and soil sampling, geological mapping, and geophysical surveying, targeting gold and copy mineralization at the Company’s projects and properties in Canada, Türkiye, and the United States.
2024 Exploration Highlights
2025 Exploration Outlook
Mount Milligan
Mount Milligan Brownfield Drilling and Exploration
Figure 1: Plan view of Mount Milligan deposit showing 2024 resource shell.
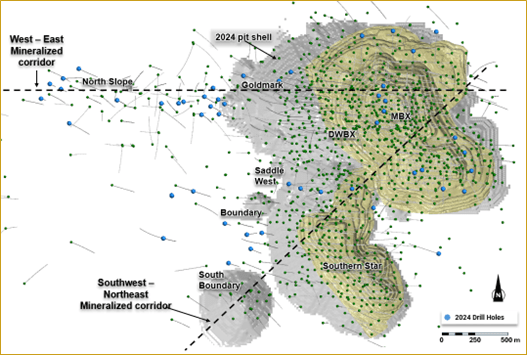
Figure 2: Plan view of Mount Milligan deposit showing major porphyry trends.
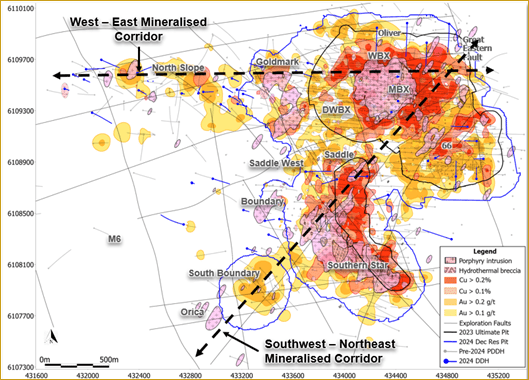
Figure 3: East-West cross section of the Mount Milligan 2024 resource pit (looking north), showing gold and copper grade contours. The circled area is the 2025 target for infill drilling.

Figure 4: Long section view of Mount Milligan (looking northwest), showing gold and copper grade contours. Circled areas represent target areas for the 2025 infill drill program.
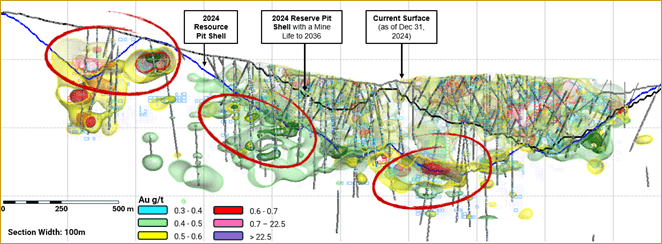
Figure 5: Plan view of Mt. Milligan showing the 2025 planned drilling program. Bright red holes are phase 1 priority holes intended to be completed by the end of the first quarter 2025. Drilling started in January 2025.

The DWBX zone is the depth extension of the WBX porphyry-style gold-copper mineralisation currently mined in the pit. Mineralization is associated with potassic alteration and early quartz veins within the DWBX stock and stock margins. Near surface and south of the DWBX is the King Richard zone. Results received to-date show the potential to extend the open pit to mine DWBX, King Richard, and DWBX Extension. Some selected significant results received during the year include:
Hole #24-1531: 26.0m @ 0.71 g/t Au, 0.188% Cu from 58m
Hole #24-1569: 37.8m @ 0.48 g/t Au, 0.229% Cu from 115m
Hole #24-1572: 30.3m @ 0.55 g/t Au, 0.176% Cu from 83m
Hole #24-1556: 48.4m @ 0.32 g/t Au, 0.204% Cu from 139m
Hole #24-1571: 58.0m @ 0.24 g/t Au, 0.068% Cu from 68m
Hole #24-1556: 83.8m @ 0.15 g/t Au, 0.127% Cu from 214m
Hole #24-1554: 73.0m @ 0.16 g/t Au, 0.168% Cu from 248m
Hole #24-1564: 18.7m @ 0.60 g/t Au, 0.161% Cu from 21m
The Goldmark zone is directly west of the current Mount Milligan pit design, situated above the high grade DWBX zone. In 2024, drilling continued to test the western extent of the Goldmark mineralisation that had been intersected in previous drill programs. Shallow porphyry-style gold and copper mineralisation is hosted at the margins of dykes and the Goldmark stock. High gold-low copper style mineralisation occurs throughout the zone. The results show potential for shallow resource additions and the extension of mineralisation west of the existing pit boundary. Significant results include:
Hole #24-1529: 65.0m @ 0.22 g/t Au, 0.191% Cu from 497m
Hole #24-1529: 19.2m @ 0.41 g/t Au, 0.038% Cu from 370m
Hole #24-1532: 20.0m @ 0.28 g/t Au, 0.030% Cu from 34m
Hole #24-1532: 11.5m @ 0.32 g/t Au, 0.205% Cu from 275m
The North Slope zone is approximately 1.5 kilometres west of the western margins of the existing pit boundary. Assays show multiple localized shallow zones of mineralisation related to the North Slope stock, with higher-grade porphyry-style gold and copper mineralization intersected near surface and at depth. Significant results include:
Hole #24-1533: 42.3m @ 0.41 g/t Au, 0.241% Cu from 25m
Hole #24-1533: 3.0m @ 4.47 g/t Au, 0.078% Cu from 448m
Hole #24-1536: 41.8m @ 0.33 g/t Au, 0.144% Cu from 244m
Hole #24-1536: 68.6m @ 0.16 g/t Au, 0.172% Cu from 305m
Hole #24-1536: 64.9m @ 0.29 g/t Au, 0.173% Cu from 378m
Hole #24-1543: 85.8m @ 0.24 g/t Au, 0.173% Cu from 336m
Hole #24-1543: 101.3m @ 0.20 g/t Au, 0.179% Cu from 451m
Hole #24-1563: 7.1m @ 2.21 g/t Au, 0.142% Cu from 81m
Hole #24-1563: 13.5m @ 1.09 g/t Au, 0.086% Cu from 32m
Hole #24-1566: 4.9m @ 8.11 g/t Au, 0.024% Cu from 238m
Hole #24-1566: 40.0m @ 0.33 g/t Au, 0.012% Cu from 136m
Hole #24-1567: 23.5m @ 4.27 g/t Au, 0.183% Cu from 160m
Hole #24-1567: 5.0m @ 5.01 g/t Au, 0.147% Cu from 291m
Hole #24-1567: 27.0m @ 2.83 g/t Au, 0.143% Cu from 342m
Hole #24-1567: 27.7m @ 3.63 g/t Au, 0.129% Cu from 483m
Kemess Project
Some of the significant 2024 results include:
Hole #KN-24-013: 435m @ 0.43g/t Au, 0.23% Cu from 172m
Hole #KN-24-013: 402m @ 0.42g/t Au, 0.20% Cu from 47m
Hole #KN-24-017: 382m @ 0.38g/t Au, 0.19% Cu from 8m
Hole #KN-24-014: 342m @ 0.35g/t Au, 0.07% Cu from 56m
Hole #KN-24-019: 341m @ 0.34g/t Au, 0.16% Cu from 4m
Hole #KN-24-021: 311m @ 0.37g/t Au, 0.18% Cu from 0m
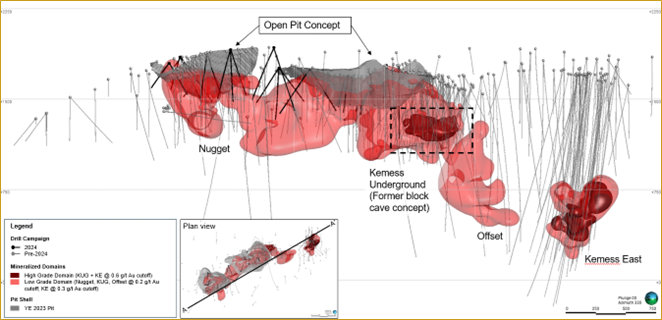
Figure 6: A long sectional view of the Kemes deposit showing a 0.2 g/t Au shell. The areas previously studied for a potential block cave mining scenario are shown within the dotted areas. The 2023 conceptual optimized pit is shown in grey.
Goldfield Project
The Jupiter prospect exploration program focused on oxidized mineralization with an up-dip projection trending shallower on the eastern portion of the prospect. The Jupiter prospect is the northerly extension of the Gemfield deposit. Drilling was facilitated by land agreements and drill permits completed in late 2023. Results proved the up-dip projection of oxide mineralization in the prospect, however, the grades and thickness are uneconomic to include an appreciable amount of material into an optimized pit shell when the prevailing economic parameters were applied. A series of small satellite pits were delineated to be included in the Goldfield initial resource. Some of the significant results received for Jupiter include:
Hole #GEM24R279: 19.8m @ 2.55 g/t Au, 16.38 g/t Ag from 87m
Hole #GEM24R256: 36.6m @ 1.04 g/t Au, 1.09 g/t Ag from 20m
Hole #GEM24R319: 6.1m @ 5.36 g/t Au, 5.50 g/t Ag from 0m
Hole #GEM24R286: 24.4m @ 1.09 g/t Au, 1.96 g/t Ag from 23m
Hole #GEM24R249: 35.1m @ 0.41 g/t Au, 0.66 g/t Ag from 40m
Hole #GEM24R291: 30.5m @ 0.46 g/t Au, 0.70 g/t Ag from 15m
Hole #GEM24R289: 30.5m @ 0.40 g/t Au, 0.91 g/t Ag from 15m
Hole #GEM24R239: 32.0m @ 0.38 g/t Au, 1.04 g/t Ag from 11m
Oakley Project
At the Cold Hill target, four holes encountered significant mineralization, primarily represented by silicified pebble to cobble conglomerate and silicified volcanic ash, and with minor intersections within the underlying Paleozoic limestone, represented by decalcification and silicification. These intersections continue to define the lateral extent and width of the mineralization at Cold Hill. Some of the significant results received for Cold Hill include:
Hole #CC-24-04: 20.3m @ 0.24 g/t Au, 1.47 g/t Ag from 8m
Hole #CC-24-04: 20.9m @ 0.50 g/t Au, 4.00 g/t Ag from 37m
Hole #CC-24-07: 9.9m @ 0.69 g/t Au, 1.19 g/t Ag from 192m
Hole #CC-24-07: 1.0m @ 4.54 g/t Au, 0.90 g/t Ag from 200m
Drilling at the Blue Hill prospect focused on testing the margins of the known mineralization and following up on the higher-grade intersections identified in historic drilling. Mineralization was encountered in the most southwestern drillholes in the prospect, which shows the potential for additional mineralization towards the southwest. The mineralization is associated with strong silicification of the pebble to cobble conglomerate and silicification of the volcanic ash beds. Significant intersections are listed below.
Hole #BHC24R001: 19.8m @ 0.42 g/t Au, 4.19 g/t Ag from 24m
Hole #BHC24R003: 24.4m @ 0.45 g/t Au, 4.73 g/t Ag from 84m
Hole #BHC24R005: 64.0m @ 0.31 g/t Au, 2.74 g/t Ag from 50m
Hole #BHC24R005: 28.9m @ 0.25 g/t Au, 6.88 g/t Ag from 131m
Hole #BHC24R007: 21.4m @ 0.35 g/t Au, 3.11 g/t Ag from 90m
Hole #BHC24R007: 67.0m @ 0.50 g/t Au, 5.83 g/t Ag from 162m
Öksüt Mine
Drilling started during December 2024, with a total of 431 metres completed at the Güneytepe pit to test for potential deep porphyry mineralization. The exploration for deep porphyry deposits was initiated in 2023, based on historical drillholes confirming potassic alteration related to porphyry intrusive rocks on the Öksüt license. In 2024, a detailed alteration analysis and modelling was completed, using data from historical and recent (2023) deep holes drilled in and around the Öksüt deposit. The analysis of these drillholes pointed to the presence of a large pyrophyllite alteration zone, which is an indicator for the presence of the upper parts of a porphyry system. The porphyry system was tested in 2024 by drilling additional deep holes under the Güneytepe pit. In 2025, Centerra expects to continue to explore for near surface oxide mineralization southeast of the Öksüt pit.
A full listing of the drill results has been filed on SEDAR+ at www.sedarplus.ca, EDGAR at www.sec.gov/edgar, and is available on the Company’s website at www.centerragold.com.
| Centerra Gold Inc. 2024 Year-End Mineral Reserve and Resources Summary – Gold(1) | |||||||||
| as of December 31, 2024 (see additional footnotes below) | |||||||||
| Proven and Probable Gold Mineral Reserves | |||||||||
| Proven | Probable | Total Proven and Probable | |||||||
| Property | Tonnes | Grade | Contained Gold (koz) |
Tonnes | Grade | Contained Gold (koz) |
Tonnes | Grade | Contained Gold (koz) |
| (kt) | (g/t) | (kt) | (g/t) | (kt) | (g/t) | ||||
| Mount Milligan(4) | 187,961 | 0.34 | 2,056 | 76,551 | 0.31 | 770 | 264,512 | 0.33 | 2,826 |
| Öksüt | 475 | 0.63 | 10 | 19,604 | 1.04 | 653 | 20,080 | 1.03 | 662 |
| Total | 188,436 | 0.34 | 2,065 | 96,155 | 0.46 | 1,423 | 284,591 | 0.38 | 3,488 |
| Measured and Indicated Gold Mineral Resources(2) | |||||||||
| Measured | Indicated | Total Measured and Indicated | |||||||
| Property | Tonnes | Grade | Contained Gold (koz) |
Tonnes | Grade | Contained Gold (koz) |
Tonnes | Grade | Contained Gold (koz) |
| (kt) | (g/t) | (kt) | (g/t) | (kt) | (g/t) | ||||
| Mount Milligan(4) | 91,827 | 0.25 | 743 | 92,144 | 0.28 | 824 | 183,971 | 0.26 | 1,566 |
| Öksüt | 393 | 0.55 | 7 | 2,224 | 0.72 | 51 | 2,617 | 0.69 | 58 |
| Kemess Open Pit | – | – | – | 111,682 | 0.27 | 980 | 111,682 | 0.27 | 980 |
| Kemess Underground | – | – | – | 139,920 | 0.50 | 2,265 | 139,920 | 0.50 | 2,265 |
| Kemess East | – | – | – | 93,454 | 0.39 | 1,182 | 93,454 | 0.39 | 1,182 |
| Goldfield | 9,729 | 1.08 | 339 | 21,103 | 0.54 | 368 | 30,833 | 0.71 | 706 |
| Total | 101,949 | 0.33 | 1,088 | 460,527 | 0.38 | 5,670 | 562,476 | 0.37 | 6,759 |
| Inferred Gold Mineral Resources (3) | |||||||||
| Property | Tonnes | Grade | Contained Gold (koz) |
||||||
| (kt) | (g/t) | ||||||||
| Mount Milligan (4) | 27,924 | 0.44 | 395 | ||||||
| Öksüt | 130 | 1.06 | 4 | ||||||
| Kemess Open Pit | 13,691 | 0.26 | 116 | ||||||
| Kemess Underground | – | – | – | ||||||
| Kemess East | – | – | – | ||||||
| Goldfield | 2,267 | 0.41 | 30 | ||||||
| Total | 44,012 | 0.39 | 546 | ||||||
1) Centerra’s equity interests as of this news release are as follows: Mount Milligan 100%, Öksüt 100%, Kemess Open Pit, Kemess Underground and Kemess East 100%, Goldfield 100%. Mineral reserves and resources for these properties are presented on a 100% basis. Numbers may not add up due to rounding.
2) Mineral resources are in addition to mineral reserves. Mineral resources do not have demonstrated economic viability.
3) Inferred mineral resources have a great amount of uncertainty as to their existence and as to whether they can be mined economically. It cannot be assumed that all or part of the inferred mineral resources will ever be upgraded to a higher category.
4) Production at Mount Milligan is subject to a streaming agreement with RGLD Gold AG and Royal Gold, Inc. which entitles Royal Gold to 35% of gold sales from the Mount Milligan Mine. Under the stream arrangement, Royal Gold will pay a reduced price per ounce of gold delivered. Mineral reserves and resources for the Mount Milligan property are presented on a 100% basis.
| Centerra Gold Inc. 2024 Year-End Mineral Reserve and Resources Summary – Other Metals(1) | |||||||
| as of December 31, 2024 (see additional footnotes below) | |||||||
| Tonnes (kt) |
Copper Grade (%) |
Contained Copper (Mlbs) |
Molybdenum Grade (%) |
Contained Molybdenum (Mlbs) |
Silver Grade (g/t) |
Contained Silver (koz) |
|
| Proven Mineral Reserves | |||||||
| Mount Milligan(4) | 187,961 | 0.19 | 808 | – | – | – | – |
| Thompson Creek | 44,885 | – | – | 0.076 | 75 | – | |
| Probable Mineral Reserves | |||||||
| Mount Milligan(4) | 76,551 | 0.20 | 342 | – | – | – | – |
| Thompson Creek | 68,104 | – | – | 0.057 | 86 | – | |
| Total Proven and Probable Mineral Reserves | |||||||
| Mount Milligan(4) | 264,512 | 0.20 | 1,150 | – | – | – | – |
| Thompson Creek | 112,989 | – | – | 0.065 | 161 | – | |
| Total Copper and Molybdenum | 377,501 | 0.20 | 1,150 | 0.065 | 161 | – | – |
| Measured Mineral Resources(2) | |||||||
| Mount Milligan(4) | 91,827 | 0.19 | 384 | – | – | – | – |
| Thompson Creek | 5,009 | – | – | 0.059 | 7 | – | – |
| Endako | 47,100 | – | – | 0.050 | 48 | – | – |
| Indicated Mineral Resources(2) | |||||||
| Mount Milligan(4) | 92,144 | 0.17 | 348 | – | – | – | – |
| Kemess Open Pit | 111,682 | 0.14 | 337 | – | – | 1.19 | 4,262 |
| Kemess Underground | 139,920 | 0.25 | 779 | – | – | 1.90 | 8,544 |
| Kemess East | 93,454 | 0.30 | 628 | – | – | 1.66 | 5,000 |
| Thompson Creek | 45,178 | – | – | 0.057 | 57 | – | – |
| Endako | 122,175 | – | – | 0.040 | 118 | – | – |
| Total Measured and Indicated Mineral Resources(2) | |||||||
| Mount Milligan(4) | 183,971 | 0.18 | 732 | – | – | – | – |
| Kemess Open Pit | 111,682 | 0.14 | 337 | – | – | 1.19 | 4,262 |
| Kemess Underground | 139,920 | 0.25 | 779 | – | – | 1.90 | 8,544 |
| Kemess East | 93,454 | 0.30 | 628 | – | – | 1.66 | 5,000 |
| Total Copper and Silver | 529,027 | 0.21 | 2,476 | – | – | 1.61 | 17,806 |
| Thompson Creek | 50,187 | – | – | 0.057 | 63 | – | – |
| Endako | 169,275 | – | – | 0.043 | 166 | – | – |
| Total Molybdenum | 219,462 | – | – | 0.046 | 229 | – | – |
| Inferred Mineral Resources(3) | |||||||
| Mount Milligan(4) | 27,924 | 0.12 | 74 | – | – | – | – |
| Kemess Open Pit | 13,691 | 0.16 | 48 | – | – | 1.40 | 615 |
| Total Copper and Silver | 41,615 | 0.13 | 121 | – | – | 1.40 | 615 |
| Thompson Creek | 10,523 | – | – | 0.072 | 17 | – | – |
| Endako | 47,325 | – | – | 0.040 | 44 | – | – |
| Total Molybdenum | 57,848 | – | – | 0.046 | 61 | – | – |
1) Centerra’s equity interests as of this news release are as follows: Mount Milligan 100%, Kemess Underground and Kemess East 100%, Thompson Creek 100%, and Endako 75%. Mineral reserves and resources for these properties are presented on a 100% basis. Numbers may not add up due to rounding.
2) Mineral resources are in addition to mineral reserves. Mineral resources do not have demonstrated economic viability.
3) Inferred mineral resources have a great amount of uncertainty as to their existence and as to whether they can be mined economically. It cannot be assumed that all or part of the inferred mineral resources will ever be upgraded to a higher category.
4) Production at Mount Milligan is subject to a streaming agreement which entitles Royal Gold to 18.75% of copper sales from the Mount Milligan Mine. Under the stream arrangement, Royal Gold will pay a reduced percentage of the spot price per metric tonne of copper delivered. Mineral reserves and resources for the Mount Milligan property are presented on a 100% basis.
Additional Footnotes
General
Mount Milligan Mine
Öksüt Mine
Kemess Open Pit and Underground
Kemess East
Thompson Creek Mine
Endako Mine
Goldfield
Gemfield: 0.10 g/t for oxide, transition, and sulphide
Jupiter: 0.10 g/t for oxide, transition, and sulphide
Goldfield Main: 0.14 g/t for oxide, 0.21 g/t for transition, 0.24 g/t for sulphide
McMahon Ridge: 0.14 g/t for oxide, 0.21 g/t for transition, 0.24 g/t for sulphide
Qualified Person – Mineral Reserves and Resources
Christopher Richings, Professional Engineer, member of the Engineers and Geoscientists British Columbia (EGBC) and Centerra’s Vice President, Technical Services, has reviewed and approved the scientific and technical information related to mineral reserves at Mount Milligan and Thompson Creek contained in this news release. Mr. Richings is a Qualified Person within the meaning of Canadian Securities Administrator’s NI 43-101 Standards of Disclosure for Mineral Projects.
Lars Weiershäuser, PhD and PGeo., and Centerra’s Director, Geology, has reviewed and approved the scientific and technical information related to mineral resource estimates contained in this news release related to Öksüt, Kemess Open Pit, Kemess Underground, Kemess East, Thompson Creek, and Endako. Dr. Weiershäuser is a Qualified Person within the meaning of NI 43-101.
Andrey Shabunin, Professional Engineer, member of Professional Engineers of Ontario (PEO) and General Manager of Öksüt Mine, has reviewed and approved the scientific and technical information related to mineral reserves at Öksüt contained in this news release. Mr. Shabunin is a Qualified Person within the meaning of NI 43-101.
AC (Chris) Hunter, Professional Geoscientist, member of the Engineers and Geoscientists of British Columbia (EGBC) and Centerra’s Senior Geologist, has reviewed and approved the scientific and technical information related to mineral resources estimates at Mount Milligan contained in this news release. Mr. Hunter is a Qualified Person within the meaning of NI 43-101.
Karen Chiu, MSc., PGeo, and Centerra’s Corporate Geologist, has reviewed and approved the scientific and technical information related to mineral resource estimates contained in this news release related to Goldfield. Ms. Chiu is a Qualified Person within the meaning of NI 43-101.
All other scientific and technical information presented in this document were prepared in accordance with the standards of the Canadian Institute of Mining, Metallurgy and Petroleum and NI 43-101 and were reviewed, verified, and compiled by Centerra’s geological and mining staff under the supervision of W. Paul Chawrun, Professional Engineer, member of the Professional Engineers of Ontario (PEO) and Centerra’s Executive Vice President and Chief Operating Officer whom is a qualified person for the purpose of NI 43-101.
All mineral reserve and resources have been estimated in accordance with the standards of the Canadian Institute of Mining, Metallurgy and Petroleum and NI 43-101.
Mineral reserve and mineral resource estimates are forward-looking information and are based on key assumptions and are subject to material risk factors. If any event arising from these risks occurs, the Company’s business, prospects, financial condition, results of operations or cash flows, and the market price of Centerra’s shares could be adversely affected. Additional risks and uncertainties not currently known to the Company, or that are currently deemed immaterial, may also materially and adversely affect the Company’s business operations, prospects, financial condition, results of operations or cash flows, and the market price of Centerra’s shares. See the section entitled “Risk That Can Affect Centerra’s Business” in the Company’s annual Management’s Discussion and Analysis (MD&A) for the year-ended December 31, 2024, available on SEDAR+ at www.sedarplus.ca and EDGAR at www.sec.gov/edgar and see also the discussion below under the heading “Caution Regarding Forward-looking Information”.
Qualified Person & QA/QC – Exploration
Exploration information and related scientific and technical information in this document regarding the Mount Milligan Mine were prepared, reviewed, verified, and compiled in accordance with the standards of NI 43-101 by Cheyenne Sica, Member of the Association of Professional Geoscientists Ontario and Member of Engineers and Geoscientists British Columbia, and Exploration Manager at Centerra’s Mount Milligan Mine, who is the qualified person for the purpose of NI 43-101. Sample preparation, analytical techniques, laboratories used, and quality assurance and quality control protocols used during the exploration drilling programs are done consistent with industry standards while independent certified assay labs are used.
Exploration information and related scientific and technical information in this document regarding the Öksüt Mine, the Goldfield District Project, Oakley Project, and all other exploration projects were prepared, reviewed, verified, and compiled in accordance with the standards of NI 43-101 by Richard Adofo, Member of the Professional Association of Geoscientists Ontario and Vice President, Exploration & Resource at Centerra, who is the qualified person for the purpose of NI 43-101. Sample preparation, analytical techniques, laboratories used, and quality assurance and quality control protocols used during the exploration drilling programs are done consistent with industry standards while independent certified assay labs are used.
All other scientific and technical information presented in this document were prepared in accordance with the standards of the Canadian Institute of Mining, Metallurgy and Petroleum and NI 43-101 and were reviewed, verified, and compiled by Centerra’s geological and mining staff under the supervision of W. Paul Chawrun, Professional Engineer, member of the Professional Engineers of Ontario (PEO), who is a qualified person for the purpose of NI 43-101.
About Centerra Gold
Centerra Gold Inc. is a Canadian-based gold mining company focused on operating, developing, exploring and acquiring gold and copper properties in North America, Türkiye, and other markets worldwide. Centerra operates two mines: the Mount Milligan Mine in British Columbia, Canada, and the Öksüt Mine in Türkiye. The Company also owns the Kemess Project in British Columbia, Canada, the Goldfield Project in Nevada, United States, and owns and operates the Molybdenum Business Unit in the United States and Canada. Centerra’s shares trade on the Toronto Stock Exchange (“TSX”) under the symbol CG and on the New York Stock Exchange (“NYSE”) under the symbol CGAU. The Company is based in Toronto, Ontario, Canada.
Falco Resources Ltd. (TSX-V:FPC) is pleased to announce the resul... READ MORE
TDG Gold Corp. (TSX-V: TDG) (OTCQX: TDGGF) is pleased to provide ... READ MORE
Extension drilling extended mineralization beyond the current pit... READ MORE
Abcourt Mines Inc. (TSX-V: ABI) (OTCQB: ABMBF) continues its work... READ MORE
Premier American Uranium Inc. (TSX-V: PUR) (OTCQB: PAUIF) is plea... READ MORE


