








“With a significantly expanded resource at Lundberg and now high-grade results from Lemarchant, we are beginning to demonstrate the broader opportunity across our consolidated Buchans District.” – Chris Pennimpede, President and CEO
Highlights – 2026 Lemarchant Drill Program
Canterra Minerals Corporation (TSX-V: CTM) (OTCQB: CTMCF) (FSE: DXZB) is pleased to announce assay results from seven diamond drill holes at the Lemarchant Deposit, including 18.75 m of 5.35% CuEq in hole LM-26-172. Lemarchant is the largest known satellite deposit within Canterra’s Buchans District portfolio in central Newfoundland (Figure 1) and hosts a 2018 historical mineral resource estimate of 2.42 million tonnes Indicated at 4.89% CuEq and 0.56 million tonnes Inferred at 3.66% CuEq (Table 2).
Following the recently announced 55% increase in Indicated Mineral Resource tonnage at its cornerstone Lundberg Deposit to 26.1 Mt (October 6, 2026 news release), Canterra is advancing the next stage of its district strategy: demonstrating the potential for additional high-grade mineralization across its surrounding satellite deposits to contribute to the scale and value of the broader Buchans District. Lemarchant is located approximately 20 km southwest of Teck Resources’ former Duck Pond VMS Mine.
Chris Pennimpede, President and CEO of Canterra, commented:
“Our investment thesis at Buchans has always been about more than one deposit. We have now grown the Indicated resource at Lundberg by 55%, and these first results from Lemarchant demonstrate the high grades that make our surrounding satellite deposits so compelling.
“Nearly 19 metres exceeding 5% copper equivalent, including more than 5 metres approaching 9% copper equivalent, reinforces why we believe Lemarchant could become an important contributor to the broader Buchans District opportunity. With additional assays pending from step-outs and new exploration targets, we have more opportunities ahead.
“Our focus is on building scale around an established resource base while demonstrating the high-grade potential of the surrounding deposits. That’s how we intend to unlock the broader value of the district for shareholders.”
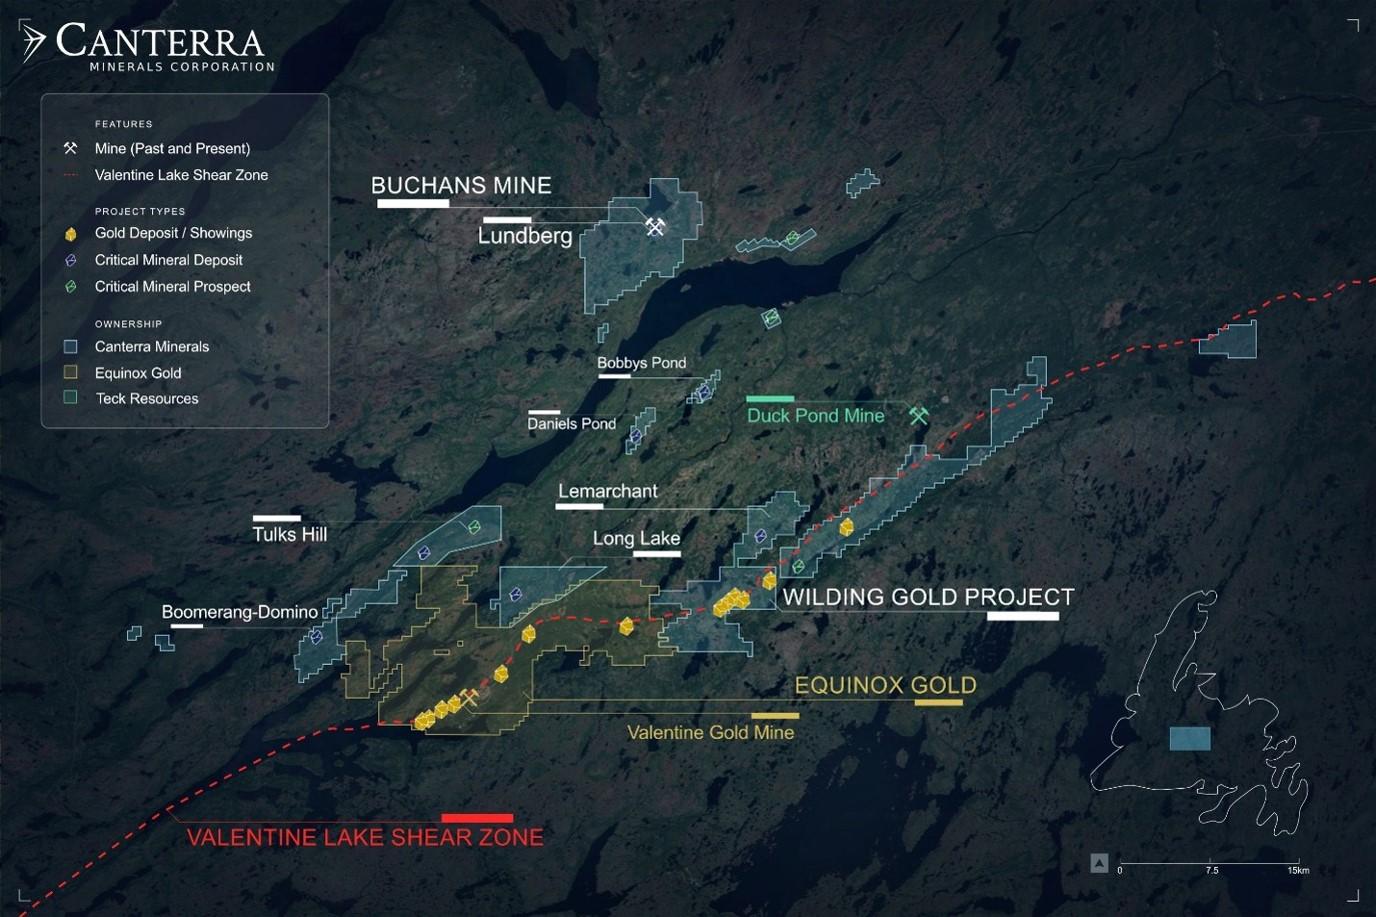
Figure 1. Canterra’s Buchans District properties, showing the Lemarchant Deposit relative to the Company’s other critical mineral deposits (Lundberg, Bobbys Pond, Daniels Pond, Long Lake, Tulks Hill & Boomerang-Domino) and the past-producing Buchans and Duck Pond mines. The figure also shows Canterra’s Wilding gold project relative to Equinox Gold’s Valentine Gold Mine along the Valentine Lake Shear Zone.
Lemarchant Drill Results (Figure 2)
Table 1. Lemarchant Deposit drill results, holes LM-26-171 to LM-26-176 and LM-11-049EXT
| Hole ID | From | To | Length | Cu | Zn | Pb | Ag | Au | CuEq | ||||||||||||||||||||||||||||
| (m) | (m) | (m) | (%) | (%) | (%) | (g/t) | (g/t) | (%) | |||||||||||||||||||||||||||||
| LM-26-171 | 56.95 | 57.40 | 0.45 | 0.17 | 1.50 | 0.40 | 7.4 | 0.44 | 1.25 | ||||||||||||||||||||||||||||
| and | 61.00 | 64.00 | 3.00 | 0.29 | 2.16 | 0.04 | 1.4 | 0.04 | 1.03 | ||||||||||||||||||||||||||||
| LM-26-172 | 238.00 | 256.75 | 18.75 | 0.61 | 6.00 | 1.45 | 77.2 | 1.72 | 5.35 | ||||||||||||||||||||||||||||
| including | 240.85 | 246.00 | 5.15 | 1.03 | 7.89 | 2.65 | 165.4 | 2.98 | 8.83 | ||||||||||||||||||||||||||||
| and | 275.00 | 284.00 | 9.00 | 0.11 | 0.09 | 0.00 | 5.1 | 0.46 | 0.66 | ||||||||||||||||||||||||||||
| LM-26-173 | 153.00 | 159.00 | 6.00 | 0.05 | 0.07 | 0.10 | 5.1 | 0.17 | 0.32 | ||||||||||||||||||||||||||||
| including | 158.00 | 159.00 | 1.00 | 0. | .03 | 0.01 | 11.3 | 0.13 | 0.53 | ||||||||||||||||||||||||||||
| LM-26-174 | No significant assays | ||||||||||||||||||||||||||||||||||||
| LM-26-175 | 144.60 | 166.60 | 22.00 | 0.07 | 0.23 | 0.05 | 1.2 | 0.05 | 0.21 | ||||||||||||||||||||||||||||
| including | 144.60 | 145.60 | 1.00 | 0.40 | 0.16 | 0.06 | 8.4 | 0.47 | 1.03 | ||||||||||||||||||||||||||||
| including | 165.60 | 166.60 | 1.00 | 0.21 | 0.95 | 0.02 | 2.7 | 0.06 | 0.60 | ||||||||||||||||||||||||||||
| LM-26-176 | 190.90 | 204.00 | 13.10 | 0.18 | 1.62 | 0.18 | 9.9 | 0.37 | 1.21 | ||||||||||||||||||||||||||||
| including | 190.90 | 193.00 | 2.10 | 0.61 | 3.61 | 0.44 | 26.2 | 1.72 | 3.86 | ||||||||||||||||||||||||||||
| and | 205.00 | 206.00 | 1.00 | 0.15 | 1.30 | 0.02 | 7.6 | 0.04 | 0.68 | ||||||||||||||||||||||||||||
| and | 226.95 | 227.90 | 0.95 | 0.06 | 2. | .02 | 1.4 | 0.04 | 0.85 | ||||||||||||||||||||||||||||
| LM-11-049EXT | No significant assays | ||||||||||||||||||||||||||||||||||||
Lengths are core lengths. True widths are estimated at approximately 80% of core length for LM-26-172, 90% for LM-26-171, 90 to 95% for LM-26-173 and LM-26-175, and 85 to 90% for LM-26-176. All assays are uncut. CuEq (%) = Cu (%) + [(Pb (%) × 22.046 × Pb rec. × Pb price) + (Zn (%) × 22.046 × Zn rec. × Zn price) + (Ag (g/t) ÷ 31.10348 × Ag rec. × Ag price) + (Au (g/t) ÷ 31.10348 × Au rec. × Au price)] ÷ (Cu price × 22.046 × Cu rec.), using metal prices of US$4.97/lb Cu, US$1.35/lb Zn, US$0.95/lb Pb, US$42.30/oz Ag and US$3,285/oz Au (CTM Lundberg 2026 MRE prices, see CTM news release dated October 6, 2026) and Lemarchant metallurgical recoveries of 79.50% Cu, 91.46% Zn, 82.42% Pb, 68.22% Ag and 84.23% Au (Thibault & Associates Inc., 2017). Payability and smelter terms have not been applied.
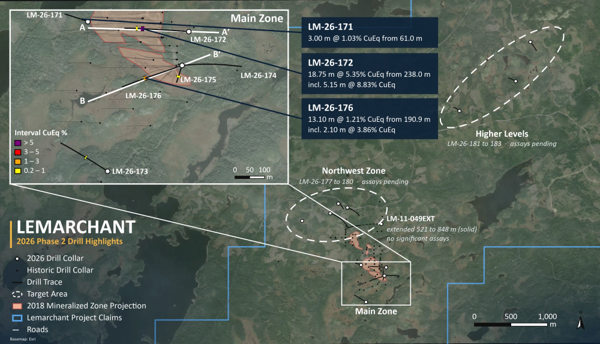
Figure 2. Plan view of the Lemarchant Deposit showing the traces of holes LM-26-171 to LM-26-176, the projected outline of the massive sulphide horizon and the 2026 Phase 2 drill holes.
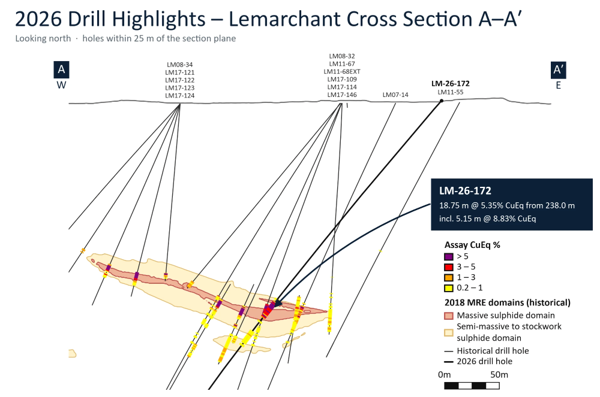
Figure 3. Cross-section through hole LM-26-172 looking north, showing the 18.75 m intercept relative to the Lemarchant massive sulphide horizon. Holes within 25 m of the section plane are shown.
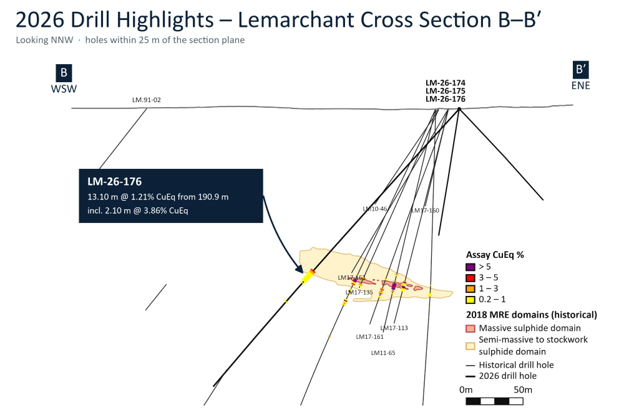
Figure 4. Cross-section B–B′ looking north-northwest through holes LM-26-174 to LM-26-176, showing the 13.10 m intercept grading 1.21% CuEq (including 2.10 m of 3.86% CuEq) in LM-26-176 relative to the 2018 historical massive sulphide and semi-massive to stockwork sulphide domains. Holes within 25 m of the section plane are shown.
Lemarchant Deposit and Historical Resource Estimate
The Lemarchant Deposit hosts a historical mineral resource estimate from 2018 (Table 2), reported at a 4.0% zinc equivalent cut-off, as set out in the Technical Report titled “NI 43-101 Technical Report and Updated Mineral Resource Estimate on the Lemarchant Deposit, South Tally Pond Property, Central Newfoundland, Canada”. A Qualified Person has not done sufficient work to classify the historical estimate as current Mineral Resources or Mineral Reserves, and Canterra is not treating the historical estimate as current Mineral Resources or Mineral Reserves.
Table 2. Lemarchant Deposit historical mineral resource estimate (effective date September 20, 2018)
| Category | Tonnes | Cu | Zn | Pb | Ag | Au | CuEq | ZnEq |
| (Mt) | (%) | (%) | (%) | (g/t) | (g/t) | (%) | (%) | |
| Indicated | 2.42 | 0.68 | 6.15 | 1.60 | 64.04 | 1.22 | 4.89 | 12.40 |
| Inferred | 0.56 | 0.45 | 4.68 | 1.08 | 44.67 | 1.06 | 3.66 | 9.31 |
ZnEq grades are as reported in the 2018 Technical Report (ZnEq (%) = Zn (%) + [(Pb (%) × 22.046 × 0.8242 × 1.00) + (Cu (%) × 22.046 × 0.795 × 3.21) + (Ag (g/t) ÷ 31.10348 × 0.6822 × 19) + (Au (g/t) ÷ 31.10348 × 0.8423 × 1,351)] ÷ (1.10 × 22.046 × 0.9146)), using metal prices of US$1.10/lb Zn, US$1.00/lb Pb, US$3.21/lb Cu, US$1,351/oz Au and US$19/oz Ag and the metallurgical recoveries stated above. CuEq grades have been calculated by Canterra from the reported grades using the same 2018 metal prices and recoveries. Tonnages are rounded to the nearest 10,000 tonnes.
Table 3. Drill collar information, holes LM-26-171 to LM-26-176 and LM-11-049EXT
| Hole ID | Easting | Northing | Elevation (m) | Azimuth (°) | Dip (°) | Length (m) |
| LM-26-171 | 520,884 | 5,374,981 | 336 | 290 | −65 | 196.0 |
| LM-26-172 | 521,227 | 5,374,947 | 334 | 272 | −48 | 348.0 |
| LM-26-173 | 520,951 | 5,374,473 | 336 | 305 | −55 | 338.3 |
| LM-26-174 | 521,204 | 5,374,832 | 330 | 084 | −45 | 301.0 |
| LM-26-175 | 521,204 | 5,374,832 | 330 | 201 | −77 | 229.0 |
| LM-26-176 | 521,204 | 5,374,832 | 330 | 249 | −48 | 325.0 |
| LM-11-049EXT | 521,162 | 5,375,541 | 343 | 270 | −55 | 848.0 |
Coordinates are UTM NAD83 Zone 21N. All holes were drilled at NQ core diameter; LM-26-171 and LM-26-172 by Springdale Forest Resources and LM-26-173 to LM-26-176 and LM-11-049EXT by Trust Drilling.
QA/QC Protocols
Core samples, together with standards, blanks and duplicates, were submitted to Eastern Analytical Ltd. in Springdale, Newfoundland, for preparation and analysis. All samples were taken from saw-cut NQ drill core, with one half retained for reference and one half submitted for analysis. Samples were delivered in sealed bags by Canterra personnel to Eastern, an accredited assay laboratory conforming to ISO/IEC 17025 requirements. Samples were analyzed by 30 g gold fire assay with atomic absorption finish and by four-acid ICP-OES multi-element analysis (ICP-34), with over-limit Cu, Pb, Zn and Ag determined by atomic absorption.
For the seven drill holes reported in this news release, 23 control samples were inserted among 201 core samples, representing approximately 10% of the sample stream, comprising certified reference materials CDN-ME-1806, CDN-ME-2310, CDN-SE-1 and CDN-FCM-4, blanks and field duplicates. The Qualified Person reviewed the QA/QC results and determined the results to be within accepted limits for the reference and blank materials.
Qualified Person
Paul Moore, M.Sc., P.Geo. (NL), Vice President of Exploration, is the Qualified Person for the Company as defined under National Instrument 43-101 and has reviewed and approved the scientific and technical information in this news release.
Newfoundland and Labrador Junior Exploration Assistance
Canterra would like to acknowledge financial support it received from the Government of Newfoundland and Labrador’s Junior Exploration Assistance Program related to the completion of its 2024 and 2025 programs, and any support it may receive for its 2026 exploration programs in the Buchans District.
About Canterra Minerals
Canterra is a diversified minerals exploration company focused on critical minerals and gold in central Newfoundland. The Company’s projects include seven mineral deposits located in close proximity to the world-renowned, past-producing Buchans Mine and Teck Resources’ Duck Pond Mine, which collectively produced copper, zinc, lead, silver and gold. Several of Canterra’s deposits support current and historical Mineral Resource Estimates prepared in accordance with National Instrument 43-101 and the Canadian Institute of Mining, Metallurgy and Petroleum Definition Standards for Mineral Resources and Mineral Reserves. Canterra’s gold projects are located on trend of Equinox Gold’s Valentine Mine and cover an approximately 55 km extension of the same structural corridor that hosts gold mineralization within Equinox Gold’s mine. Past drilling by Canterra and others within the Company’s gold projects intersected multiple occurrences of orogenic-style gold mineralization within a large land position that remains underexplored.
Highlights: Strong project economics: After-tax NPV₈ of C$13.49... READ MORE
NexGold Mining Corp. (TSX-V: NEXG) (OTCQX: NXGCF) is pleased to ... READ MORE
Premier American Uranium Inc. (TSX-V: PUR) (OTCQB: PAUIF) is plea... READ MORE
Copper-bearing mineralization logged in all eight holes along an ... READ MORE