


Bravo Mining Corp. (TSX-V: BRVO) (OTCQX: BRVMF), is pleased to announce results of an independent Preliminary Economic Assessment on its 100% owned Luanga palladium + platinum + rhodium + gold + nickel deposit located in the Carajás Mineral Province, Pará State, Brazil.
Highlights of Bravo’s 2025 PEA:
“As we approach the third anniversary of our IPO, I’m delighted to mark the occasion with a key milestone: the delivery of a solid PEA for the Luanga Project. The high margin and low CAPEX to NPV ratio in the PEA is a testament to what can be achieved when careful drilling and strategic planning are applied to a richly endowed geological setting that is also exceptionally well-suited for mine development”, said Luis Azevedo, Chairman and CEO. “Further, our team has years of exploration experience coupled with a proven track record of mining permitting, building and operating in the Carajás. This wealth of experience positions us to continue to advance the Luanga Project.”
“Importantly, the preliminary economics outlined in the PEA suggest that Luanga – with its large-scale, long-life and open-pit production profile – should be well positioned to withstand commodity cycles and to capitalize on the improving fundamentals of the PGM markets like those we are now experiencing.
“In addition, Luanga’s scale and suite of commodities, all deemed critical to Brazil, mean that the Project could potentially benefit from the support of Brazil’s Government and associated agencies. We are therefore pleased that Luanga has been shortlisted by the BNDES/FINEP for potential access to funding made available for the in-country development of strategic minerals and sustainable materials. Potential access to such funding has enabled us to explore additional options that could enhance Luanga’s Base Case economics, such as vertical integration of the operations to produce the final products within Brazil.
“The PEA does not include any mineral inventory that exists below the pit generated in this preliminary assessment or take into account the exploration potential below the current MRE, along the 8.1km strike length of the deposit. These opportunities offer additional potential to expand the size and/or increase the life of the Project.
“In my opinion, these factors establish Luanga as one of the most compelling undeveloped PGM projects globally.
“Bravo’s multidisciplinary approach has been successful in demonstrating Luanga’s potential and illustrating how much more value there is yet to be unlocked, including our continued pursuit of copper-gold IOCG targets. All of this has been achieved while maintaining financial discipline and a strong treasury.
“At this milestone, I’d like to acknowledge the dedication of our team and thank our stakeholders and investors for their support over the three years since our IPO. I am looking forward to the next chapters of our journey”.
PEA Overview
Once filed (on SEDAR+), readers are encouraged to read the Company’s PEA Technical Report prepared in accordance with National Instrument 43-101 – Standards of Disclosure for Mineral Projects (“43-101”) in its entirety. The Technical Report contains all qualifications, assumptions and exclusions that relate to the PEA and Mineral Resource Estimate (“MRE”) upon which the PEA is based. The Technical Report is intended to be read as a whole, and sections should not be read or relied upon out of context. Further, the PEA represents a point in time estimate and is only a window into the long-term potential of the asset given the indications of continued mineralization at depth.
The Company retained GE21 Consultoria Mineral Ltda. as Bravo’s independent engineering consultants (with offices located in Belo Horizonte, Minas Gerais, Brazil), to prepare the PEA in accordance with NI 43-101.
The PEA is based on the most recent (2025) MRE for the Luanga Project (see later section: Luanga Project 2025 MRE and press release published on February 18, 2025).
Approximately 67% of mineralized material assumed to be processed in the PEA comes from mineral resources that are currently classified as Measured and Indicated. The PEA is preliminary in nature and includes inferred mineral resources (approximately 33% of total mineral resources) that are considered too speculative geologically to have the economic considerations applied to them that would enable them to be categorized as mineral reserves. It is uncertain but reasonably expected that further exploration would convert Inferred mineral resources to Indicated mineral resources. There is no certainty that the outcome of the PEA will be realized.
1Note on Palladium Equivalent – For grades by individual metals, see Table 11 under Luanga Project 2025 MRE section, where the footnotes also detail the basis of the Palladium Equivalent calculation.
The Luanga Deposit is assumed to be developed as a conventional open pit mining and milling operation, with on-site treatment of the mined mineralized material. The Base Case scenario considers processing through a conventional froth flotation plant with a nameplate processing capacity of 27,700 tonnes per day or 10 million tonnes per annum at full scale, producing a single saleable concentrate to be transported and sold to a third-party smelter. The Alternate Case (vertically-integrated) scenario considers the same Base Case scenario, but with the addition of onsite downstream processing to produce a highly concentrated metal matte for sale directly to a refinery to produce LME grade final metals, resulting in higher payabilities for the metals produced.
Table 1 presents the financial highlights from the PEA, over the LOM.
| Base Case
(Concentrate Sales) |
Alternate Case
(Vertical Integration) |
||
| Item | Unit | Value | Value |
| Total Site Costs* | US$/oz PdEq1 | 608.6 | 663.4 |
| Government Royalties | US$/oz PdEq1 | 20.8 | 24.9 |
| Total Operating Costs* | US$/oz PdEq1 | 629.4 | 688.3 |
| All in Sustaining Costs* | US$/oz PdEq1 | 638.1 | 697.1 |
| Capital Costs | |||
| Total Initial Capital Cost | US$ Million | 496.0 | 677.6 |
| Sustaining Capital Cost | US$ Million | 97.1 | 97.1 |
| Closure Costs | US$ Million | 17.9 | 17.9 |
| Life-of-Mine Total Capital Cost | US$ Million | 611.0 | 792.6 |
| Financial evaluation | |||
| Average Annual Net Revenue* | US$ Million | 643.7 | 788.7 |
| Average Annual Free Cashflow* | US$ Million | 143.1 | 216.8 |
| After-tax NPV @ 8% discount | US$ Million | 1,249 | 1,861 |
| After-tax IRR | % | 49.7 % | 49.6 % |
| CAPEX/NPV Ratio* | 0.40 | 0.36 | |
| Payback** | Years | 2.4 | 2.4 |
| *See Non-IFRS Measures below; ** Post-construction payback | |||
| Table 1: PEA Highlights | |||
PEA Summary
Mining
Luanga is characterized by consistent geological continuity, near-surface mineralization, and steeply dipping mineralised zones. The shape of the mineralisation makes it highly amenable to open-pit extraction.
The PEA contemplates conventional OP mining using a truck-and-shovel operation. Over the period under study (a preliminary estimate of a 17-year mine life), mineralized material would be sourced from three open cuts, following an initial pre-strip and stockpiling ahead of plant commissioning. The mining sequence would utilize 10-metre-high benches. Drilling, blasting, loading, and hauling are assumed to be performed by contractors.
The contemplated primary loading fleet includes 539-tonne hydraulic shovels with 29 m³ buckets and front-end wheel loaders with 19 m³ capacity buckets, paired with 246-tonne haul trucks. Additional fleet components, including 90-tonne and 45-tonne excavators, are envisaged for waste removal and mining of any narrower zones.
Maximum material movement is projected to peak at 103.6 Mtpa (approximately 284,000 tpd). Over the LOM, a total of 1,308 million tonnes should be extracted, including 165 million tonnes of mineralised material.
Waste rock would be placed in a designated storage facility. Tailings would be directed to a dry-stack storage near the plant, with capacity for LOM tailings impoundment. For the sake of simplicity and focus on value, the current PEA does not contemplate processing the Oxide component of the MRE. Oxide mineralisation will require additional plant design and expenditures and is considered best re-visited at a later date. In the interim and for this study, mineralized oxide material would be stockpiled. See the “Opportunities” section below.
Processing
The PEA assumes a process plant ramping up from 5.0 Mtpa of throughput capacity, or approximately 13,700 tpd, following construction and commissioning, to 10.0 Mtpa (27,400 tpd full capacity) within 24 months.
The contemplated traditional flotation plant is designed to produce a nickel–gold-platinum group metals (Ni-Au-PGM) concentrate containing palladium, platinum, rhodium, gold, and nickel. The flowsheet incorporates a conventional comminution circuit consisting of a semi-autogenous grinding (SAG) mill followed by a ball mill (SAB circuit).
Beneficiation of the mineral products would be undertaken by conventional froth flotation. The circuit is a conventional one, including rougher, scavenger, and cleaner flotation units. Based on average feed grades, the plant would be expected to achieve average metallurgical recoveries (into a flotation concentrate) of 77% for palladium, 81% for platinum, 52% for rhodium, 50% for gold, and 62% for nickel.
The circuit flowsheet would also include concentrate thickening, filtration as well as tailings thickening, filtration and dry stacking. The incorporation of dry stacking and water reclaim facilities demonstrates that Bravo is proposing to use best industry standards in plant design.
The vertically-integrated Alternate Case has also been investigated, whereby the final metal products are produced by Bravo locally rather than the flotation concentrate being exported to third party refineries.
This integrated scenario considers the possible treatment of flotation concentrates through conventional calcination/roasting for sulphur extraction, followed by a well established reductive pyrometallurgical process. Pre-removal of sulphur and sulphuric acid production would ensure compliance to local SO2 emissions standards and provide addition revenue stream through the sale of acid to locally based fertilizer producers, where there is high demand due to a reliance on imported acid to produce fertilizer. As part of the PEA, sulphuric acid generation volumes were calculated based on average expected concentrate quality. A sulphuric acid sales credit of $160/t of acid produced was assumed as part of the vertical integration scenario.
Mine Production Plan
The assumed LOM production is summarized in Table 2.
| Units | Value | |
| LOM Throughput | ||
| Peak Process Plant Throughput | tpd | 27,700 |
| Mt/year | 10.1 | |
| Peak Mining Rate | tpd | 283,900 |
| Mt/year | 103.6 | |
| Mine Production (LOM) | ||
| Total Mined | Mt | 1,319 |
| Total Waste Mined | Mt | 1,153 |
| Total Run-of-Mine (“ROM“) Mined | Mt | 165 |
| Strip Ratio | t/t (Waste/ROM) | 7.0 |
| Payable Metal (LOM) | ||
| Palladium | Thousands of ounces (“kOz“) | 4,337 |
| Platinum | kOz | 2,689 |
| Rhodium | kOz | 254 |
| Gold | kOz | 145 |
| Nickel | Tonnes | 145,336 |
| Table 2: Production Summary | ||
The production schedule assumes a 17-year LOM, where Figures 2 and 3 illustrate the annual metal production by contained metal.
Capital Costs
The estimated initial CAPEX for construction and ramp-up, together with expected sustaining capital and closure costs, are presented in Table 3 below. These estimates are to an AACE Class 4 estimate (-30%/+50%). The capital cost estimate includes a 20% contingency factored in each appropriate CAPEX item.
| Concentrate Sales Scenario
(Base Case) |
Vertical Integration Scenario
(Alternate Case) |
|||||
| CAPEX | Initial CAPEX | Sustaining | Total CAPEX | Initial CAPEX | Sustaining | Total CAPEX |
| Mining Preparation | 4.1 | 4.2 | 8.3 | 4.1 | 4.2 | 8.3 |
| Accesses | 1.5 | 0.0 | 1.5 | 1.5 | 0.0 | 1.5 |
| Equipment Mob/Demobilization | 1.1 | 13.7 | 14.8 | 1.1 | 13.7 | 14.8 |
| Pre Stripping | 25.0 | 0.0 | 25.0 | 25.0 | 0.0 | 25.0 |
| Waste Dump Preparation | 5.0 | 4.8 | 9.8 | 5.0 | 4.8 | 9.8 |
| Dry Stacking Facility | 8.3 | 0.0 | 8.3 | 8.3 | 0.0 | 8.3 |
| Ancillary Facilities | 17.4 | 0.0 | 17.4 | 17.4 | 0.0 | 17.4 |
| Construction site | 2.0 | 0.0 | 2.0 | 2.0 | 0.0 | 2.0 |
| Transmission Line and Electric Substation | 17.3 | 0.0 | 17.3 | 17.3 | 0.0 | 17.3 |
| Mine Closure | 0.0 | 17.9 | 17.9 | 0.0 | 17.9 | 17.9 |
| Concentration Plant | 283.2 | 0.0 | 283.2 | 283.2 | 0.0 | 283.2 |
| Plant Infrastructure | 36.0 | 74.4 | 110.4 | 36.0 | 74.4 | 110.4 |
| Pyrometallurgical Plant (Incl. Indirect Costs) | – | – | – | 181.9 | – | 181.9 |
| Indirect (EPCM, Consultants, etc.) | 94.8 | 0.0 | 94.8 | 94.8 | 0.0 | 94.8 |
| Total | 495.8 | 115.0 | 610.8 | 677.6 | 115.0 | 792.6 |
| Table 3: CAPEX Estimates | ||||||
Operating Costs
The Luanga Project operating costs (“OPEX”) are presented in Table 4.
| Description | Unit | OPEX |
| – Mine OPEX | US$/t processed | 22.80 |
| – Process OPEX | US$/t processed | 12.12 |
| – Freight | US$/t processed | 0.94 |
| – OPEX G&A | US$/t processed | 5.00 |
| Total OPEX: | US$/t processed | 40.86 |
| Table 4: OPEX Estimates | ||
The average life-of-mine US$/t cost of material moved is $2.85. The vertical integrated model assumes an additional US$4.62 per tonne processed operating expenditure, offset materially by increased payabilities and credits from sulphuric acid.
Economic Analysis
The cash flow model was based on the assumed production schedule, associated metal grades, metallurgical recoveries and capital and operating costs outlined in this news release.
Table 5 shows the Luanga Project’s PEA highlights.
| Concentrate Sales
Scenario (Base Case) |
Vertical Integration
Scenario (Alternate Case) |
||
| Item | Unit | Value | Value |
| Total Site Costs* | US$/oz PdEq1 | 608.6 | 663.4 |
| Government Royalties | US$/oz PdEq1 | 20.8 | 24.9 |
| Total Operating Costs* | US$/oz PdEq1 | 629.4 | 688.3 |
| All in Sustaining Cost* | US$/oz PdEq1 | 638.1 | 697.1 |
| Capital Costs | |||
| Total Initial Capex | M US$ | 496 | 677.6 |
| Sustaining Capital | M US$ | 97.1 | 97.1 |
| Closure Costs | M US$ | 17.9 | 17.9 |
| Life-of-Mine Total Capital Cost | M US$ | 611 | 792.6 |
| Financial evaluation | |||
| Average Annual Net Revenue* | M US$ | 643.7 | 788.7 |
| Average Annual Free Cashflow* | M US$ | 143.1 | 216.8 |
| After-tax NPV @ 8% | M US$ | 1,249 | 1,861 |
| After-tax IRR | % | 49.7 | 49.6 |
| CAPEX/NPV Ratio* | 1:1 | 0.40 | 0.36 |
| Payback** | Years | 2.4 | 2.4 |
| *See non-IFRS measures below; ** Post-construction payback | |||
| Table 5: PEA Highlights | |||
The payabilities applied to the Concentrate Sales Base Case economic model were benchmarked from publicly available data from various other mines selling PGM concentrates through a third-party refiner, inclusive of treatment charges. The economic analysis assumes all handling and logistics costs associated with shipping of concentrates to a Southern African smelter. Payabilities used in the PEA Base Case are detailed in Table 6. For the Alternate Case, sales prices are assumed at LME pricing.
| Metal | Payability (%) |
| Pd | 85 |
| Pt | 85 |
| Rh | 84 |
| Au | 84 |
| Ni | 72 |
| Table 6: Base Case Payabilities by metal | |
Sensitivity Analysis
Sensitivity analysis considered variations to metal pricing, CAPEX, OPEX, and NPV Discount Rate for both the Base Case (Concentrate Sales) scenario and the Alternate Case (Vertical Integration) scenario.
Figures 4, 5, and Table 7 present the Sensitivity Analyses for the Luanga Project PEA.
| NPV Sensitivity to Discount Rate | |||
| Discount Rate | Unit | Base Case Scenario
(Concentrate Sales) |
Alternate Case Scenario
(Vertical Integration) |
| 6 % | US$ Million | 1,487 | 2,223 |
| 8% (Base Case) | US$ Million | 1,249 | 1,861 |
| 10 % | US$ Million | 1,055 | 1,568 |
| Table 7: Base & Alternate Case Scenario Sensitivity Analysis of Discount Rate | |||
The PEA is based on the Company’s MRE with an effective date of February 18, 2025. The effective date of the PEA is July 7, 2025. A NI 43-101 compliant technical report summarizing the results of the PEA will be filed on the Company’s website and under its SEDAR+ profile within 45 days of this news release.
Mine Production Schedule
Tables 8 and 9 below set out the projected LOM annual production schedules.
| Year | ROM | Pd | Pt | Rh | Au | Ni | Waste* | Strip | Total
Moved |
||||||
| (Mt) | (g/t) | (g/t) | (g/t) | (g/t) | ( %) | (Mt) | (t/t) | (Mt) | |||||||
| 0 | – | – | – | – | – | – | 10.0 | – | 10.0 | ||||||
| 1 | 5.1 | 1.09 | 0.63 | 0.10 | 0.07 | 0.14 | 25.6 | 5.1 | 30.7 | ||||||
| 2 | 10.0 | 1.10 | 0.63 | 0.09 | 0.07 | 0.15 | 31.1 | 3.1 | 41.1 | ||||||
| 3 | 10.0 | 1.28 | 0.63 | 0.09 | 0.07 | 0.20 | 33.7 | 3.4 | 43.7 | ||||||
| 4 | 10.0 | 1.32 | 0.64 | 0.10 | 0.06 | 0.18 | 32.4 | 3.2 | 42.4 | ||||||
| 5 | 10.1 | 1.02 | 0.69 | 0.11 | 0.05 | 0.14 | 33.4 | 3.3 | 43.5 | ||||||
| 6 | 10.0 | 1.00 | 0.60 | 0.09 | 0.05 | 0.13 | 93.6 | 9.3 | 103.6 | ||||||
| 7 | 10.0 | 1.00 | 0.60 | 0.09 | 0.05 | 0.13 | 93.6 | 9.3 | 103.6 | ||||||
| 8 | 10.0 | 1.00 | 0.60 | 0.09 | 0.05 | 0.13 | 93.6 | 9.3 | 103.6 | ||||||
| 9 | 10.0 | 1.00 | 0.60 | 0.09 | 0.05 | 0.13 | 93.6 | 9.3 | 103.6 | ||||||
| 10 | 10.0 | 1.00 | 0.60 | 0.09 | 0.05 | 0.13 | 93.6 | 9.3 | 103.6 | ||||||
| 11 | 10.0 | 1.03 | 0.65 | 0.10 | 0.05 | 0.14 | 84.0 | 8.4 | 94.0 | ||||||
| 12 | 10.0 | 1.03 | 0.65 | 0.10 | 0.05 | 0.14 | 84.0 | 8.4 | 94.0 | ||||||
| 13 | 10.0 | 1.03 | 0.65 | 0.10 | 0.05 | 0.14 | 84.0 | 8.4 | 94.0 | ||||||
| 14 | 10.0 | 1.03 | 0.65 | 0.10 | 0.05 | 0.14 | 84.0 | 8.4 | 94.0 | ||||||
| 15 | 10.0 | 1.03 | 0.65 | 0.10 | 0.05 | 0.14 | 84.0 | 8.4 | 94.0 | ||||||
| 16 | 9.9 | 1.09 | 0.59 | 0.09 | 0.05 | 0.14 | 49.6 | 5.0 | 59.5 | ||||||
| 17 | 9.9 | 1.09 | 0.59 | 0.09 | 0.05 | 0.14 | 49.6 | 5.0 | 59.5 | ||||||
| Total | 165.3 | 1.06 | 0.63 | 0.09 | 0.06 | 0.14 | 1,153 | 7.0 | 1,319 | ||||||
| Table 8: Mine Plan – Production Schedule. | |||||||||||||||
Notes:
|
|||||||||||||||
| Year | ROM | Pd | Pt | Rh | Au | Ni | |||||||||
| (Mt) | (kOz) | (kOz) | (kOz) | (kOz) | (kt) | ||||||||||
| 0 | – | – | – | – | – | – | |||||||||
| 1 | 5.1 | 178 | 103 | 17 | 11 | 7 | |||||||||
| 2 | 10.0 | 352 | 202 | 30 | 24 | 15 | |||||||||
| 3 | 10.0 | 412 | 204 | 30 | 22 | 20 | |||||||||
| 4 | 10.0 | 424 | 207 | 32 | 19 | 18 | |||||||||
| 5 | 10.1 | 332 | 224 | 35 | 16 | 14 | |||||||||
| 6 | 10.0 | 321 | 194 | 28 | 16 | 13 | |||||||||
| 7 | 10.0 | 321 | 194 | 28 | 16 | 13 | |||||||||
| 8 | 10.0 | 321 | 194 | 28 | 16 | 13 | |||||||||
| 9 | 10.0 | 321 | 194 | 28 | 16 | 13 | |||||||||
| 10 | 10.0 | 321 | 194 | 28 | 16 | 13 | |||||||||
| 11 | 10.0 | 331 | 208 | 31 | 17 | 14 | |||||||||
| 12 | 10.0 | 331 | 208 | 31 | 17 | 14 | |||||||||
| 13 | 10.0 | 331 | 208 | 31 | 17 | 14 | |||||||||
| 14 | 10.0 | 331 | 208 | 31 | 17 | 14 | |||||||||
| 15 | 10.0 | 331 | 208 | 31 | 17 | 14 | |||||||||
| 16 | 9.9 | 347 | 189 | 28 | 17 | 14 | |||||||||
| 17 | 9.9 | 347 | 189 | 28 | 17 | 14 | |||||||||
| Total | 165.3 | 5,652 | 3,328 | 491 | 293 | 237 | |||||||||
| Table 9: Production Schedule by Metal. | |||||||||||||||
Metallurgy Recoveries
Metallurgical recoveries used in the 2025 MRE and, where applicable, the PEA are as follows:
Fresh rock recoveries used in the 2025 MRE calculation are based on results generated from multiple phases of laboratory flotation testwork performed by Bravo (117 flotation tests) and three programs of historical flotation testwork, including two historical pilot plant tests. Results indicate that Luanga mineralization has the metallurgical character to potentially produce saleable PGM + sulphide Ni concentrates at grades in line with grades achieved for PGM operators in established jurisdictions around the world, including concentrate grades of ≥80g/t PGM, 5-10% Ni + Sulphur of 15–20%, at the feed grade range of 2g/t PGM.
Bravo testwork considered geospatially representative samples with feed grades ranging from 0.9 – 7.0 g/t PdEq1. Final concentrate grades produced in the Bravo test work ranged from 37–475 g/t PGM. Metallurgical recovery assumptions are based on target concentrate grade of 80g/t PGM.
Input assumptions for the generation of the MRE constraining pit were derived from a grade-recovery curve based on relevant results generated from the 2022 – 2024 test work programs. Where applicable, specific recoveries have been assigned to geological domains that demonstrate materially different metallurgical character and performance relative to the general mineralization observed across the Luanga deposit.
Mini plant tests were also conducted to generate a wide spectrum of concentrate chemistries for pyrometallurgical evaluation. Metallurgical data generated from the mini plant tests were further incorporated into the MRE assumptions. The sample source for the mini plant were inherited, historical, large diameter diamond cores, drilled into a localized, high talc zone in the SW sector of the Luanga deposit. Recoveries achieved were broadly in line with current assumptions (73% combined PGM+Au) but, due to high talc contamination (0.85% of MRE), target concentrate grade was not achieved under the utilised circuit configuration (35g/t). Recovery assumptions for the high talc zone were domained separately, while recoveries for all other zones are based on an 80g/t concentrate. The resultant reduced metallurgical recovery assumption of 51% (4E PGM) was assigned to the high talc domain for pit selection.
Metal Price Assumptions
Metal prices for the preliminary economic assessment were assumed on a long term, real basis.
Assumed platinum, palladium and nickel long prices are based on the long term, real forecast provided by Investec, through Consensus Economics Inc., as published in June 2025. Investec is a UK and South African based financial institution with extensive experience in the PGM mining sector. No long term, real forecasts are available for rhodium; a review was conducted of peer economic study forecasts, as well as recent market trends and pricing behaviour in order to determine the appropriate pricing for rhodium. The gold price assumption is based on Consensus Economics long term, real forecast as of June 2025. In the PEA economic analysis, the platinum price assumption was reduced from Investec’s forecast of $1,600/oz to $1,500/oz as a conservative adjustment in the light of recent market and price volatility in the platinum market, albeit in a current upward trend.
Metal Price Assumptions are shown in Table 10.
| Commodity | Luanga 2025 PEA Price
Deck, US$ |
Source | Spot price at time of
determination, US$ |
| Palladium | 1,271 | Investec LT Real June 2025 | 1,172 |
| Platinum | 1,500 | Investec LT Real June 2025 | 1,444 |
| Rhodium | 6,000 | GE21 | 5,540 |
| Gold | 3,251 | Consensus Economics LT
Real June 2025 |
3,336 |
| Nickel | 17,637 | Investec LT Real June 2025 | 15,100 |
| Table 10: Metal Price Assumptions. | |||
Based on the assumed PEA Production Schedule and the metal price deck in Table 10, the pie chart, Figure 6, shows the value contribution to Revenue by metal produced.
Vertical Integration Optionality
Due to the anticipated production scale and long LOM which the Luanga deposit may support, and with potential support of the National Bank for Economic and Social Development and the Brazilian Financial Agency for Studies and Project initiatives to provide access to a low cost of capital for in-country development of strategic minerals and sustainable materials, vertical integration has been considered as an Alternate Case for the potential future operation.
Luanga is located distal to major downstream processing centres globally and the Project could potentially benefit from the maximisation of net returns on metal sales and savings in logistics costs if vertical integration were adopted.
Furthermore, according to the ANM (Brazil’s National Mining Agency) and COMEXStat (Brazil’s official foreign trade statistics system), Brazil imported approximately 460,000 ounces of PGMs in 2024 to support its automotive, chemical, and manufacturing industries.
Significant local demand for refined metal therefore exists locally and could potentially be supplied directly in-country.
The vertical integration study has assumed a conventional roasting and reductive pyrometallurgical process to treat flotation concentrates producing individual element precious metals and nickel.
The Company completed an extensive review of options for downstream processing with key factors including technology appropriateness, technology risk, performance, capital and operating costs, and environmental considerations. Based on this review, Bravo has initiated the process of seeking technological and commercial partners for the downstream processing facility.
The PEA is prepared on a 100% equity funding basis and does not assume any funding from BNDES or FINEP.
Project Opportunities
Project Risks
Luanga Project 2025 MRE
The PEA is based upon the Company’s 2025 pit constrained MRE (Table 11), which has an effective date of February 18, 2025. The PEA does not contemplate processing the Oxide component of the MRE, which would require an additional processing plant, configured for oxide material. Mineralized Oxide material would be removed and stockpiled as part of the pre-stripping stage of the open pits, for which material movement costs are assumed in this PEA.
The MRE comprises of 158 Mt grading 2.04 g/t PdEq1 (“Palladium Equivalent”) for a total of 10.4 Moz of PdEq1 in the Measured + Indicated category, and 78 Mt grading 2.01 g/t PdEq1 for 5.0 Moz PdEq1 in the Inferred category. Table 8 shows a breakdown of the MRE by tonnage, grade and metal content for each metal, weathering type, and resource classification category.
1 Note on Palladium Equivalent – For grades by individual metals, see Table 11 below, where the footnotes also detail the basis of the Palladium Equivalent calculation.
Mineral resources that are not mineral reserves do not have demonstrated economic viability. There is no certainty that all mineral resources would be converted into mineral reserves. This MRE includes Inferred Mineral Resources which have not had sufficient work to classify them as Indicated mineral resources. It is uncertain but reasonably expected that inferred mineral resources could be upgraded to indicated mineral resources with continued exploration. For further information please refer to the 2025 MRE NI 43-101 Independent Technical Report (SEDAR+) with an effective date of February 18, 2025.
Note that the assumed PEA production schedule is based on a subset of this 2025 MRE and uses a higher cut-off grade (0.87g/t PdEq for the PEA versus 0.5g/t PdEq for the MRE) to provide what Bravo deems to be an optimal return in the PEA economic model, which also excludes consideration of Oxide material at this point in time.
| Resource
Classification |
Weathering | Average Grades and Contained Metal Estimates | |||||||||||||
| Tonnes | PdEq | Pd | Pt | Rh | Au | Ni | |||||||||
| Mt | g/t | Oz | g/t | Oz | g/t | Oz | g/t | Oz | g/t | Oz | % | Tonnes | |||
| Measured | Oxide | 4 | 1.51 | 197 | 0.90 | 117 | 0.88 | 115 | 0.12 | 15 | 0.05 | 7 | — | — | |
| High talc | — | — | — | — | — | — | — | — | — | — | — | — | — | ||
| Fresh Rock | 32 | 2.06 | 2,144 | 0.97 | 1,009 | 0.67 | 694 | 0.08 | 88 | 0.04 | 46 | 0.11 | 35,282 | ||
| Total | 36 | 2.00 | 2,340 | 0.96 | 1,126 | 0.69 | 809 | 0.09 | 104 | 0.04 | 53 | 0.10 | 35,282 | ||
| Indicated | Oxide | 6 | 1.51 | 314 | 0.97 | 200 | 0.73 | 151 | 0.11 | 23 | 0.04 | 9 | — | — | |
| High talc | 2 | 1.83 | 146 | 1.12 | 89 | 0.54 | 43 | 0.08 | 6 | 0.11 | 9 | 0.13 | 3,160 | ||
| Fresh Rock | 113 | 2.09 | 7,599 | 0.99 | 3,583 | 0.59 | 2,133 | 0.09 | 318 | 0.05 | 193 | 0.14 | 156,406 | ||
| Total | 122 | 2.06 | 8,058 | 0.99 | 3,872 | 0.59 | 2,326 | 0.09 | 348 | 0.05 | 210 | 0.13 | 159,566 | ||
| Measured + Indicated | Oxide | 10 | 1.51 | 510 | 0.94 | 317 | 0.79 | 266 | 0.11 | 38 | 0.04 | 15 | — | — | |
| High talc | 2 | 1.83 | 146 | 1.12 | 89 | 0.54 | 43 | 0.08 | 6 | 0.11 | 9 | 0.13 | 3,160 | ||
| Fresh Rock | 145 | 2.08 | 9,743 | 0.98 | 4,592 | 0.60 | 2,827 | 0.09 | 407 | 0.05 | 239 | 0.13 | 191,688 | ||
| Total | 158 | 2.04 | 10,399 | 0.98 | 4,998 | 0.62 | 3,135 | 0.09 | 451 | 0.05 | 262 | 0.12 | 194,848 | ||
| Inferred | Oxide | 3 | 1.57 | 130 | 0.88 | 73 | 1.04 | 86 | 0.13 | 11 | 0.05 | 4 | — | — | |
| High talc | 0.1 | 1.76 | 5 | 1.08 | 3 | 0.53 | 2 | 0.07 | 0 | 0.10 | 0 | 0.14 | 133 | ||
| Fresh Rock | 75 | 2.02 | 4,878 | 0.97 | 2,344 | 0.58 | 1,389 | 0.08 | 191 | 0.05 | 123 | 0.13 | 97,586 | ||
| Total | 78 | 2.01 | 5,013 | 0.97 | 2,421 | 0.59 | 1,476 | 0.08 | 202 | 0.05 | 128 | 0.13 | 97,719 | ||
| Table 8: MRE Declaration at a Cut-off of 0.5g/t PdEq* | |||||||||||||||
| Table 11: Luanga Project 2025 MRE | |||||||||||||||
| Notes to the MRE: | |||||||||||||||
| 1. | The 2025 MRE was prepared by Bernardo Horta de Cerqueira Viana, Geologist, BSc (Geology), FAIG, CEO of GE21 Consultoria Mineral Ltda. and Porfírio Cabaleiro Rodriguez, Mining Engineer, BSc (Mine Eng), FAIG, CKO of GE21 Consultoria Mineral Ltda., both independent Qualified Person (“QP”) for the purposes of National Instrument 43-101 Standards of Disclosure for Mineral Projects (“NI 43-101”). The effective date of the MRE is 18 February 2025. | ||||||||||||||
| 2. | Mineral resources are reported using the 2014 CIM Definition Standards and were estimated in accordance with the CIM 2019 Best Practices Guidelines, as required by National Instrument 43-101 Standards of Disclosure for Mineral Projects (“NI 43-101”). | ||||||||||||||
| 3. | The MRE Estimate is reported/confined within an economic pit shell generated by Dassault Geovia Whittle software, using the following assumptions: | ||||||||||||||
|
|||||||||||||||
| 4. | The 2025 MRE supersedes and replaces the Previous Estimate (2023), which should be no longer relied upon. | ||||||||||||||
| 5. | The QP is not aware of political, environmental, or other risks that could materially affect the potential development of the Mineral Resources other than those typical for mining projects at this stage of development, including those listed in the Technical Report dated October 22nd, 2023, and in the Company’s Annual Information Form dated April 22nd, 2024. | ||||||||||||||
| 6. | Totals may not sum due to rounding. | ||||||||||||||
Permitting
On March 3, 2025, the Pará State Environmental Agency (Secretaria de Estado de Meio Ambiente e Sustentabilidade – SEMAS) granted the preliminary license (“LP”) to the Luanga Project.
The Brazilian mine permitting process consists of three key stages: the preliminary license which has been granted, followed by the installation license and, finally, the license to operate. The LP is the most critical, time-consuming and challenging to secure, as it defines the project’s fundamental parameters and requires both environmental feasibility and social acceptance – both of which were affirmed during the successful public hearing in December 2024. See news release dated March 3, 2025 for additional information.
The granted LP provides for the extraction and processing of metallic minerals, including platinum group metals as well as for nickel, copper and gold. The subsequent LI is applied for as a prerequisite for the commencement of construction activities, while the final license (LO) is granted upon completion of construction and the start of operations.
SUDAM Taxation Benefit
Companies located in the Amazon region may benefit from certain tax incentives. SUDAM is an administratively and financially independent federal government agency that oversees development in the Amazon region. The region includes the state of Pará in which the Project is located. Under the concession program, companies can receive either partial or complete tax exemption on income taxes for Brazilian companies.
The tax exemption applies only to income from facilities operating in the designated region and consists of a reduction of 75% off the regular corporate income tax (25%). For the purposes of the PEA, the financial model factors in a reduction of the corporate income tax rate plus social contribution of 34% (25% + 9%) to the 15.25% (25% * 0.25% + 9%) rate available under the SUDAM regime for the Project. The concession is available for an initial period of 10 years of operation.
The PEA assumes that the Luanga Project would be eligible for SUDAM tax exemption, but this can only be confirmed once an application has been submitted and approved.
About Bravo Mining Corp.
Bravo is a Canadian and Brazil-based mineral exploration and development company focused on advancing its PGM+Au+Ni Luanga Project, as well as our Cu-Au exploration opportunities in the world-class Carajás Mineral Province, Para State, Brazil.
Bravo is one of the most active explorers in Carajás. The team, comprising of local and international geologists and engineers, has a proven track record of PGM, nickel, and copper discoveries in the region and elsewhere. The individuals in the team have successfully taken a past IOCG greenfield project from discovery to development and production in the Carajás.
The Luanga Project is situated on mature freehold farming land and benefits from being located close to operating mines and a mining-experienced workforce, with excellent access and proximity to existing infrastructure, including road, rail, ports, and hydroelectric grid power. Bravo’s current Environmental, Social and Governance activities include planting more than 30,000 high-value trees in and around the project area in the past 30 months, while hiring personnel and contracting services locally.
Technical Disclosure
Technical Disclosure and Qualified Persons
Bernardo Horta de Cerqueira Viana, Geologist, BSc (Geology), FAIG, CEO of GE21 Consultoria Mineral Ltda. and Porfírio Cabaleiro Rodriguez, Mining Engineer, BSc (Mine Eng), FAIG, CKO of GE21 Consultoria Mineral Ltda., both are an Independent QP as defined in NI 43-101 and are responsible for the PEA. Independent peer reviews were carried out internally within the GE21 Group, over the complete PEA process.
Mr. Cabaleiro has reviewed and approved the scientific and technical information related to the PEA contained in this news release.
Technical information in this news release has been reviewed and approved by Simon Mottram, F.AusIMM (Fellow Australia Institute of Mining and Metallurgy), President of Bravo Mining Corp. who serves as the Company’s “qualified person” as defined in NI 43-101. Mr. Mottram has verified the technical data and opinions contained in this news release.
Details of the PEA will be provided in a technical report with an effective date of July 7, 2025, prepared in accordance with NI 43-101, which will be filed under the Company’s SEDAR+ profile within 45 days of this news release.
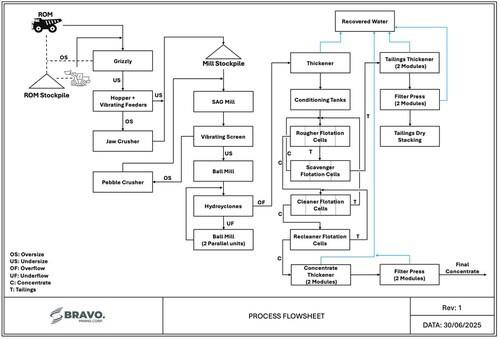
Figure 1: Process Plant Flow Sheet (CNW Group/Bravo Mining Corp.)
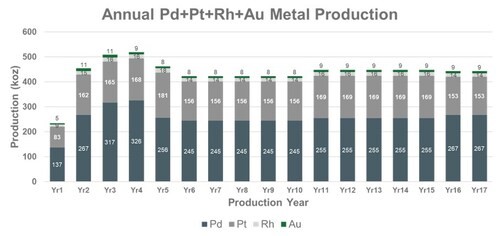
Figure 2: Annual Precious Metal Production – Contained Metal (CNW Group/Bravo Mining Corp.)
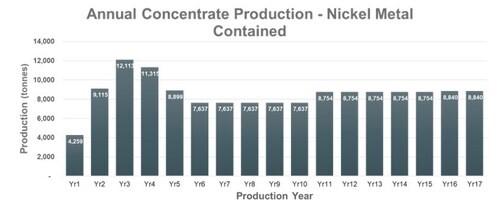
Figure 3: Annual Base Metal Production – Nickel Contained Metal (CNW Group/Bravo Mining Corp.)
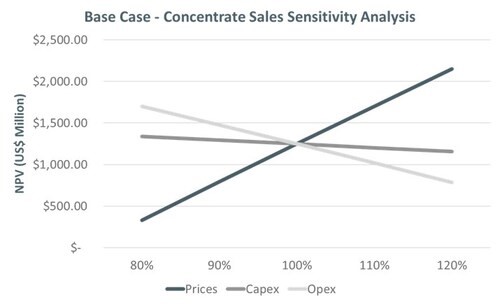
Figure 4: Base Case (concentrate sales) Sensitivity Analysis (CNW Group/Bravo Mining Corp.)
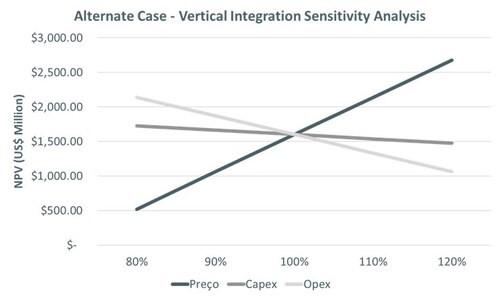
Figure 5: Alternate Case (vertical integration) Sensitivity Analysis (CNW Group/Bravo Mining Corp.)
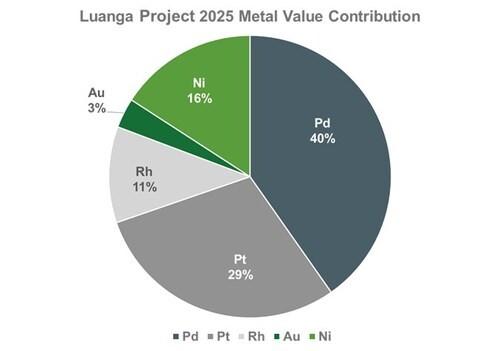
Figure 6: Luanga Project PEA Metal Value Contribution. (CNW Group/Bravo Mining Corp.)
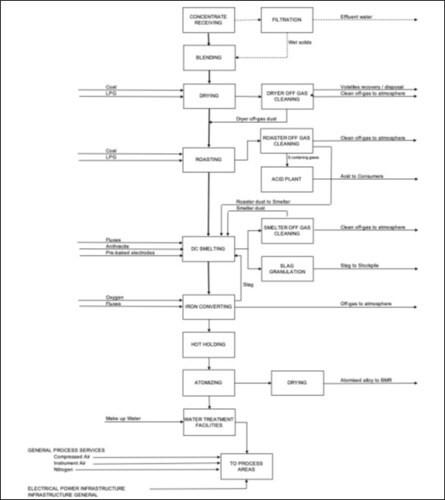
Figure 7: Alternate Case – Vertical Integration Flow Sheet (CNW Group/Bravo Mining Corp.)
Falco Resources Ltd. (TSX-V:FPC) is pleased to announce the resul... READ MORE
TDG Gold Corp. (TSX-V: TDG) (OTCQX: TDGGF) is pleased to provide ... READ MORE
Extension drilling extended mineralization beyond the current pit... READ MORE
Abcourt Mines Inc. (TSX-V: ABI) (OTCQB: ABMBF) continues its work... READ MORE
Premier American Uranium Inc. (TSX-V: PUR) (OTCQB: PAUIF) is plea... READ MORE


