


With the end of July I thought it was important to take a look at the monthly charts which carry more significance than weekly and daily charts. Visible trends on the monthly charts obviously carry greater weight than those on the weekly and daily charts. Monthly charts can also simplify and clarify sector relationships. While the broader trend for precious metals is lower, there are some slight differences as evidenced by the monthly charts.
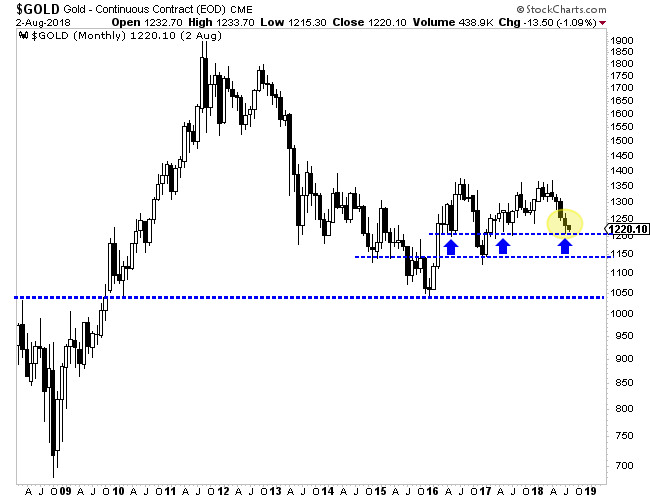
The monthly chart for Gold shows good support around $1200. Gold has struggled to sustain a rebound but it has not penetrated $1200 to the downside. Because this is a monthly support level, look for it to hold on a monthly basis for a few months and perhaps into October.
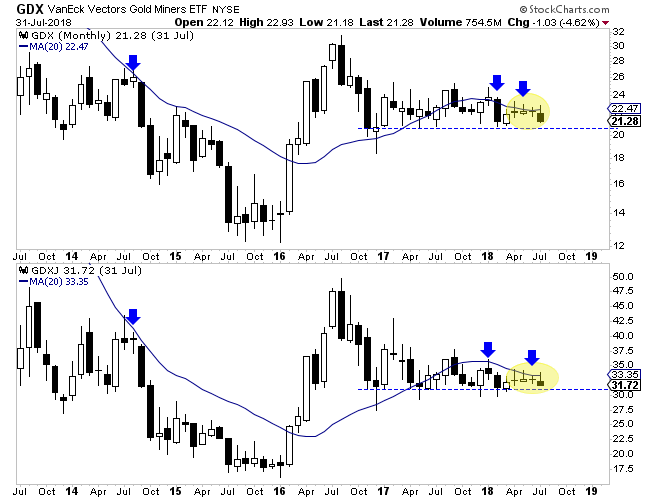
The gold stocks (GDX, GDXJ) are very close to breaking support. We know that from the daily and weekly charts but it’s quite apparent from the monthly charts as well. A monthly close below $20.70 in GDX and a monthly close below $31.00 in GDXJ would put the miners at +2 year lows.
Silver, unlike Gold and gold stocks has already broken down and lost support from its December 2016 low. Its July close was its lowest monthly close in more than two years. The next strong support level is the previous major low in the $13s.
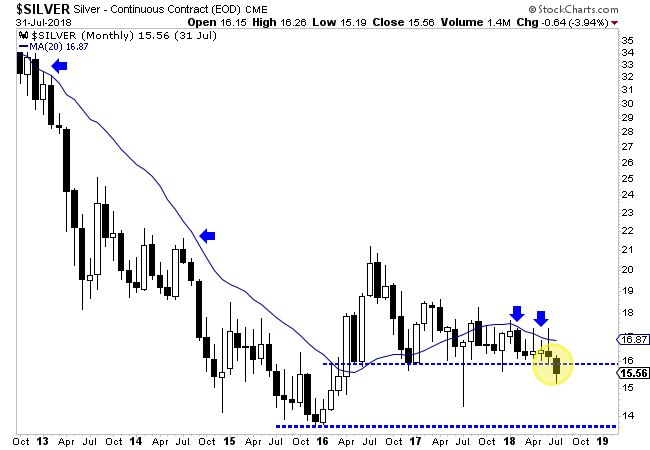
The primary trend for precious metals is lower but the monthly charts show that Gold, Silver and the gold stocks are in different positions. For example, Gold remains comfortably above its December 2016 low and because of good support at $1200, could hold the recent low for a few months. The gold stocks are in a different position because they are dangerously close to breaking support which has been tested numerous times over the past 18 months. It’s possible a rebound in Gold could prevent a breakdown but it’s also possible the miners could crack as Gold struggles to show any strength, albeit while holding support. Silver, which is often a leading indicator for the sector has already broken down. To navigate the volatility ahead and prepare for an epic buying opportunity in 2019, consider learning more about our premium service.
Significant copper and molybdenum intersections include: HM09: 13... READ MORE
Aya Gold & Silver Inc. (TSX: AYA) (OTCQX: AYASF) is pleased t... READ MORE
Key Highlights – Preliminary Economic Assessment Pre-Tax Net Pr... READ MORE
Aris Mining Corporation (TSX: ARIS) (NYSE-A: ARMN) announces its ... READ MORE
Orla Mining Ltd. (TSX: OLA) (NYSE: ORLA) announces the results fo... READ MORE


