Silverco Mining Ltd. (TSX-V: SICO) (OTCQB: SICOF) is pleased to announce the results of an independent Preliminary Economic Assessment completed for its 100%-owned La Negra Mine located in Querétaro, Mexico. The PEA and supporting Mineral Resource Estimate were prepared in accordance with National Instrument 43-101 – Standards of Disclosure for Mineral Projects by independent Qualified Persons from SGS Canada Inc.. All dollar amounts referenced in this news release are in United States dollars unless otherwise noted.
Key Highlights:
Mark Ayranto, President and CEO, commented:
“La Negra has a long history of reliable silver production, and this PEA lays out a clear, low-capital path to return to historic production levels with opportunities identified to optimize and extend the mine life through expansion and conversion of our new Indicated Resource of nearly 100 million silver equivalent2 ounces. In the short time that we have been operating La Negra, we have already begun to see notable improvements in mined silver grades and recoveries. With our new mining fleet beginning to arrive in late Q4 2026 and our dry-stack tailings project on track for completion and ramp-up in H1 2027, we expect to see a meaningful step-up in throughput in 2027, driving positive impacts to silver equivalent production and AISC.
Beyond the base case, we see considerable organic upside at La Negra through mine plan optimization and our recently announced 15,000 metre exploration program testing for high-grade extensions – the first large-scale exploration campaign at the property in two decades. Combined with the ongoing restart of Cusi, this PEA underscores Silverco’s rapid growth trajectory as a multi-asset Mexican silver producer and sets us well on our path to become a 10- million-ounce-per-year silver equivalent producer within three years.”
PEA Overview
The PEA outlines an 8.2-year mine life and steady-state throughput of 2,500 tonnes per day beginning in H2 2027, following arrival and commissioning of the new mining fleet and completion of the dry-stack tailings project, with average annual output of 4.1 million oz AgEq produced.
Table 1 – PEA Summary
| Units | Average LOM | |
| Mill Feed | ||
| Mine Life | years | 8.2 |
| Mine Throughput | Mt/year | 0.85 |
| Milling Throughput | t/d | 2,500 |
| Silver Recovery | % | 83.6 |
| Lead Recovery | % | 81.5 |
| Zinc Recovery | % | 81.9 |
| Copper Recovery | % | 77.8 |
| Average AgEq Produced(1) | M AgEqoz/year | 4.1 |
| Average AgEq Payable(1) | M AgEqoz/year | 3.6 |
| Metal Prices | ||
| Silver | $/oz | 50 |
| Copper | $/lb | 4.50 |
| Lead | $/lb | 0.88 |
| Zinc | $/lb | 1.30 |
| Financial Analysis – Base Case | ||
| Pre-Tax NPV(5%) | $M | 545 |
| Pre-Tax IRR | % | 227 |
| Pre-Tax Payback | years | 1.3 |
| After-Tax NPV(5%) | $M | 329 |
| After-Tax IRR | % | 131 |
| After-Tax Payback | years | 2.0 |
| Capital Costs | ||
| Initial | $M | 20.9 |
| Sustaining, including closure | $M | 82.0 |
| Operating Costs | ||
| Mining | $/t | 36.07 |
| Processing | $/t | 23.43 |
| G&A | $/t | 8.08 |
| Subtotal Operating Costs | $/t | 67.58 |
| TC/RCs & Royalties | $/t | 29.51 |
| Sustaining Capital | $/t | 9.90 |
| Total Operating Costs | $/t | 107.00 |
| Cash Operating Costs | $/AgEqoz payable | 15.70 |
| Site AISC Co-Product | $/AgEqoz payable | 24.86 |
| Site AISC By-Product | $/Ag | 11.41 |
Notes:
(1) Average Produced and Payable excludes production from 2026 half year.
The PEA is preliminary in nature, it includes Inferred Mineral Resources that are considered too speculative geologically to have the economic considerations applied to them that would enable them to be categorized as Mineral Reserves, and there is no certainty that the PEA will be realized. Mineral Resources that are not Mineral Reserves do not have demonstrated economic viability. The Company has no Mineral Reserves at La Negra.
The production schedule underlying the PEA includes approximately 79% Indicated and 21% Inferred Mineral Resources by tonnage. There is no certainty that Inferred Mineral Resources will be upgraded to Indicated or Measured Mineral Resources with further exploration, or that any Mineral Resource will be converted to a Mineral Reserve.
A report supporting this news release will be available on SEDAR+ (www.sedarplus.ca) and on the Company’s website (www.silvercomining.com) within the next 45 days.
Project Location
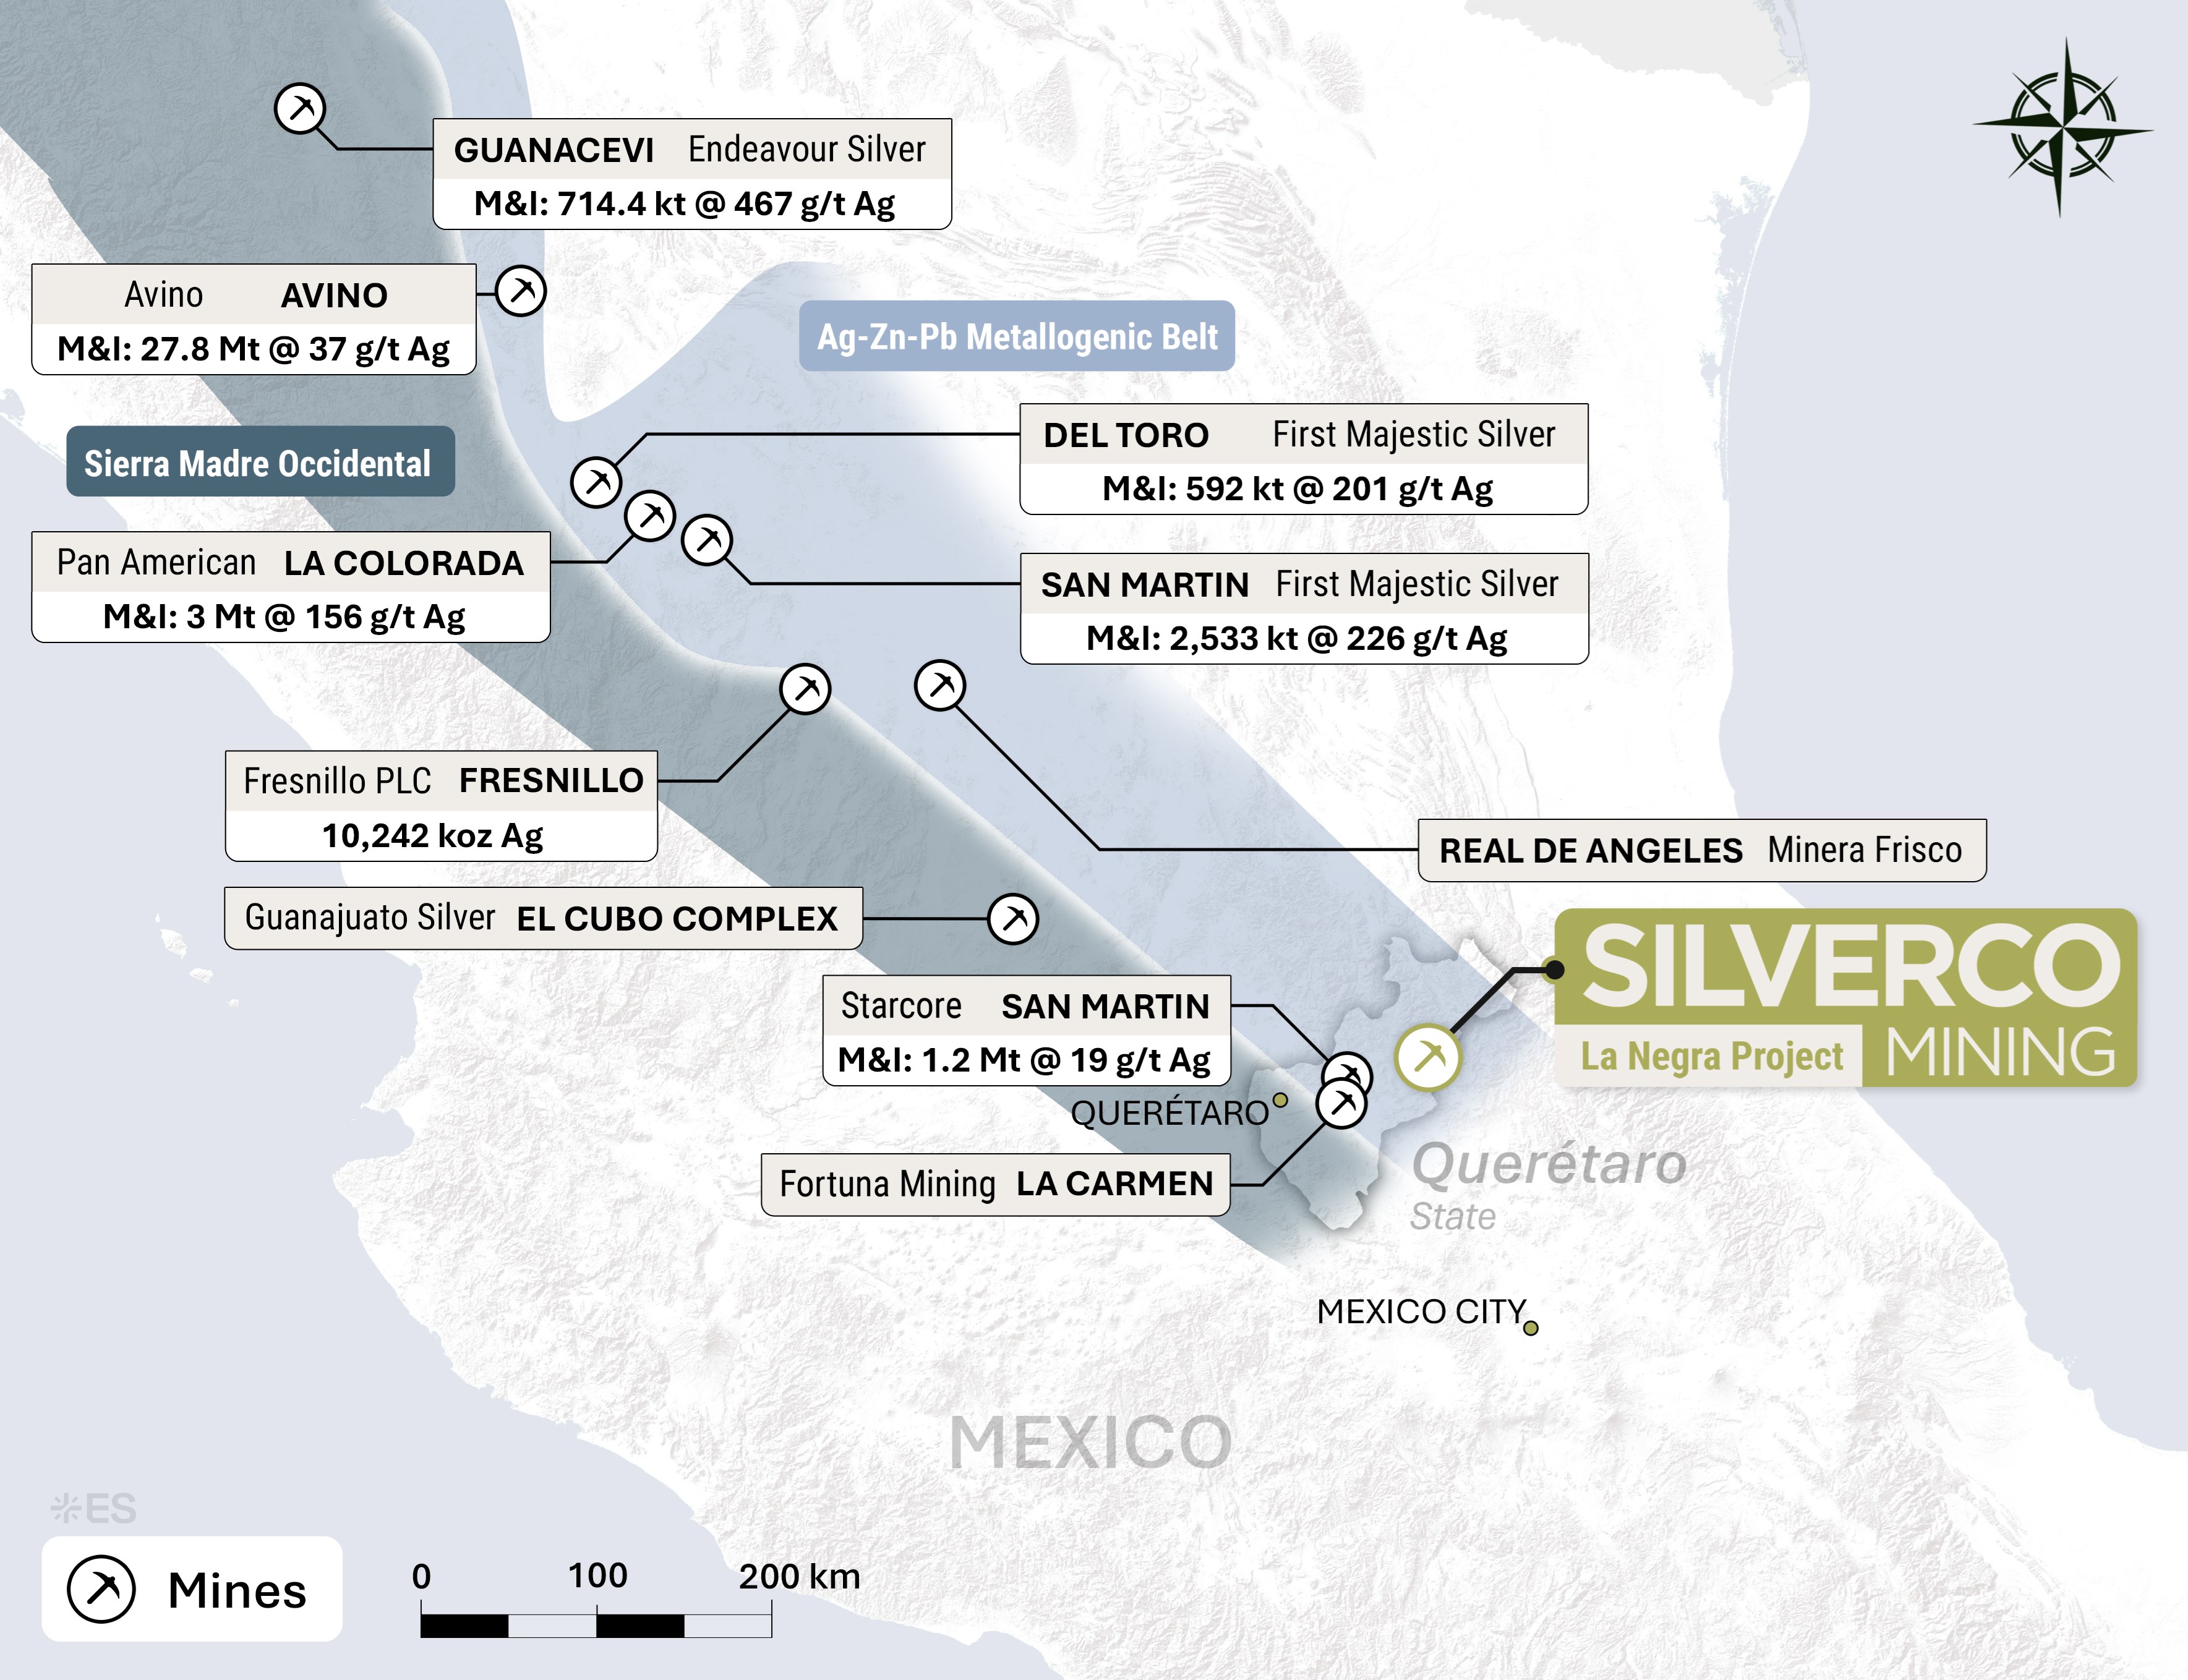
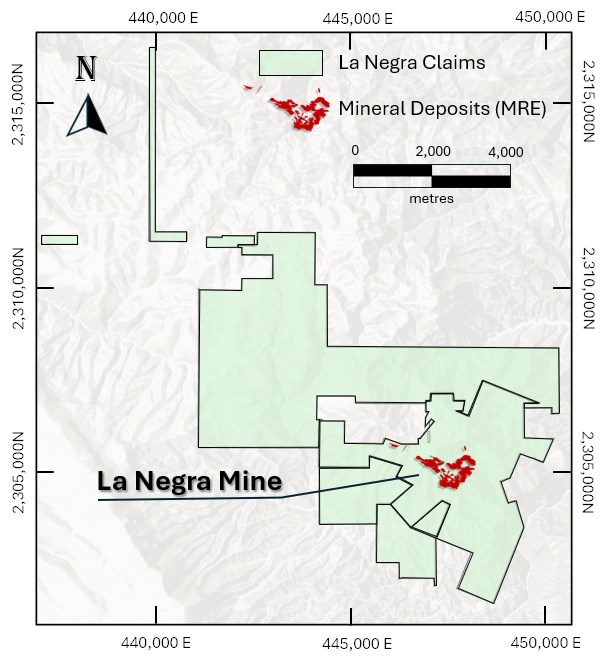
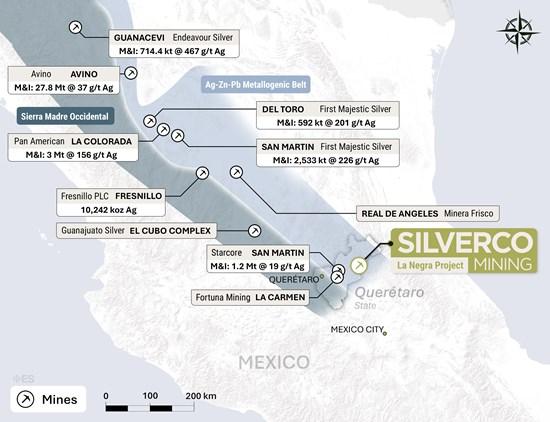
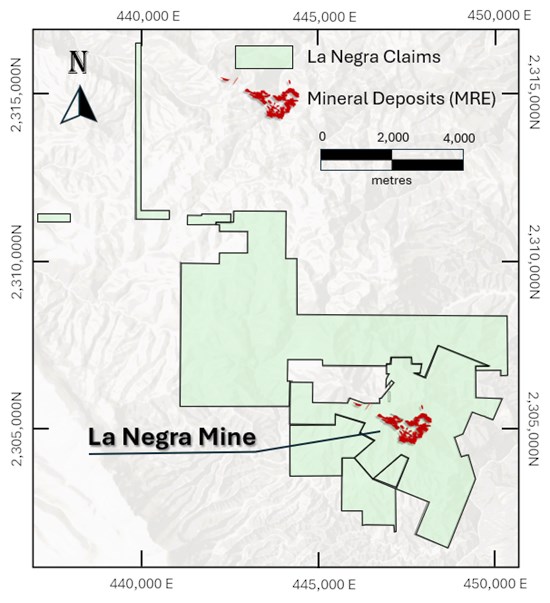
The La Negra underground mine is in Querétaro State, Mexico, approximately 150 kilometres from the city of Querétaro. The property encompasses a 2,157 hectare land package which includes an underground mine and on-site 2,500 tpd processing facility utilizing a conventional comminution and flotation circuit to produce three concentrates: lead-silver, copper-silver, and zinc. The project is fully permitted, and the Company is installing a filtered tailings facility, targeted for completion and ramp-up in H1 2027, to expand tailings capacity and reduce the operation’s water footprint.
Figure 1 – La Negra Property Location
To view an enhanced version of this graphic, please visit:
https://images.newsfilecorp.com/files/10393/315153_954029d394f4fa13_002full.jpg
Figure 2 – La Negra Property Claims
To view an enhanced version of this graphic, please visit:
https://images.newsfilecorp.com/files/10393/315153_954029d394f4fa13_003full.jpg
Mineral Resource Estimate
The La Negra MRE is based on a validated database which includes data from 39,471 surface and underground drill holes and channels totaling 320,458 m. The resource database totals 50,456 assay intervals representing 102,803 m.
The MRE is geologically and structurally controlled, allowing for enhanced geologic and grade continuity. Resource estimation was completed for each mineral domain using inverse distance squared (ID²) interpolation method on 2.00 m capped composites and considering as-built depletion models where available. The MRE is exclusive of mined out material.
Table 2 – La Negra Mine Underground Mineral Resource Estimate at a Base Case Cut-off Grade of 80 g/t AgEq
| Mine | Resource Class | Tonnes (MT) | Grade | Contained Metal | ||||||||
| Ag (g/t) | Pb (%) | Zn (%) | Cu (%) | AgEq (g/t) | Ag (Moz) | Pb (Mlbs) | Zn (Mlbs) | Cu (Mlbs) | AgEq (Moz) | |||
| La Negra Mine | Indicated | 15.23 | 106 | 0.59 | 1.81 | 0.47 | 201 | 51.9 | 199 | 608 | 158 | 98.2 |
| Inferred | 2.26 | 92 | 1.00 | 1.92 | 0.21 | 174 | 6.72 | 49.7 | 95.7 | 10.6 | 12.6 | |
Notes:
1) See notes below Table 3 which apply to this table.
Table 3 – Mineral Resource by Area, at a Base Case Cut-off Grade of 80 g/t AgEq
| Mine Area | Resource Class | Tonnes (MT) | Grade | Contained Metal | ||||||||
| Ag (g/t) | Pb (%) | Zn (%) | Cu (%) | AgEq (g/t) | Ag (Moz) | Pb (Mlbs) | Zn (Mlbs) | Cu (Mlbs) | AgEq (Moz) | |||
| Negra | Indicated | 5.34 | 158 | 1.04 | 2.27 | 0.39 | 264 | 27.1 | 121.8 | 267.4 | 46.2 | 45.3 |
| Inferred | 0.22 | 247 | 1.81 | 4.48 | 0.36 | 417 | 1.8 | 8.9 | 22.1 | 1.8 | 3.0 | |
| Cobriza | Indicated | 0.86 | 71 | 0.33 | 0.68 | 0.61 | 146 | 2.0 | 6.2 | 12.9 | 11.6 | 4.0 |
| Inferred | ||||||||||||
| Monica | Indicated | 1.71 | 93 | 0.53 | 1.20 | 0.28 | 155 | 5.1 | 20.0 | 45.2 | 10.6 | 8.5 |
| Inferred | ||||||||||||
| Bicentenario | Indicated | 1.09 | 61 | 0.22 | 1.41 | 0.48 | 141 | 2.2 | 5.3 | 33.9 | 11.6 | 5.0 |
| Inferred | ||||||||||||
| Maravillas | Indicated | 0.97 | 111 | 0.47 | 3.05 | 0.72 | 255 | 3.5 | 10.1 | 65.1 | 15.3 | 7.9 |
| Inferred | 0.05 | 48 | 0.14 | 1.75 | 0.29 | 119 | 0.1 | 0.2 | 2.0 | 0.3 | 0.2 | |
| Trinidad | Indicated | 2.82 | 71 | 0.26 | 1.33 | 0.66 | 165 | 6.5 | 16.4 | 83.0 | 40.8 | 14.9 |
| Inferred | ||||||||||||
| Gaby/Lupita | Indicated | 0.77 | 51 | 0.14 | 1.20 | 0.54 | 130 | 1.3 | 2.3 | 20.2 | 9.2 | 3.2 |
| Inferred | ||||||||||||
| Northwest | Indicated | 1.68 | 82 | 0.46 | 2.17 | 0.34 | 172 | 4.4 | 16.9 | 80.1 | 12.7 | 9.3 |
| Inferred | 1.70 | 73 | 0.88 | 1.71 | 0.20 | 146 | 4.0 | 32.9 | 64.1 | 7.4 | 8.0 | |
| Valenciana | Indicated | |||||||||||
| Inferred | 0.28 | 98 | 1.24 | 1.22 | 0.17 | 162 | 0.9 | 7.7 | 7.6 | 1.1 | 1.5 | |
Notes:
Mining
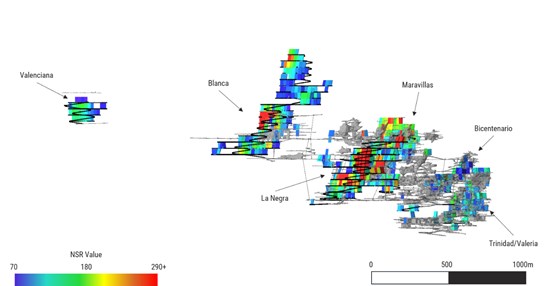
Mining activities will initially focus on the Valeria Zone within the existing La Negra underground workings. Ground conditions at La Negra are very favourable, allowing for bulk mining using long hole. Over the life of the mine, average mining rates, inclusive of waste, are targeted to be in the range of 2,648 tonnes per day and will be supported by the Company’s new mining fleet arriving through Q4 2026 and Q1 2027. To optimize grade delivery, the Company will continue to employ a stockpiling strategy for lower-grade material and enhance its mine planning, grade control, and dilution practices.
The mine plan and associated cost profile benefit from extensive underground development that is already in place, allowing for lower development needs, particularly in the initial years of the mine life. With production and development mining active at La Negra currently, many of the initial areas have been accessed and the existing underground development has been confirmed to be in good conditions with limited needs for rehabilitation. While the mine plan benefits from existing development, production is sourced from new, not remnant mining areas.
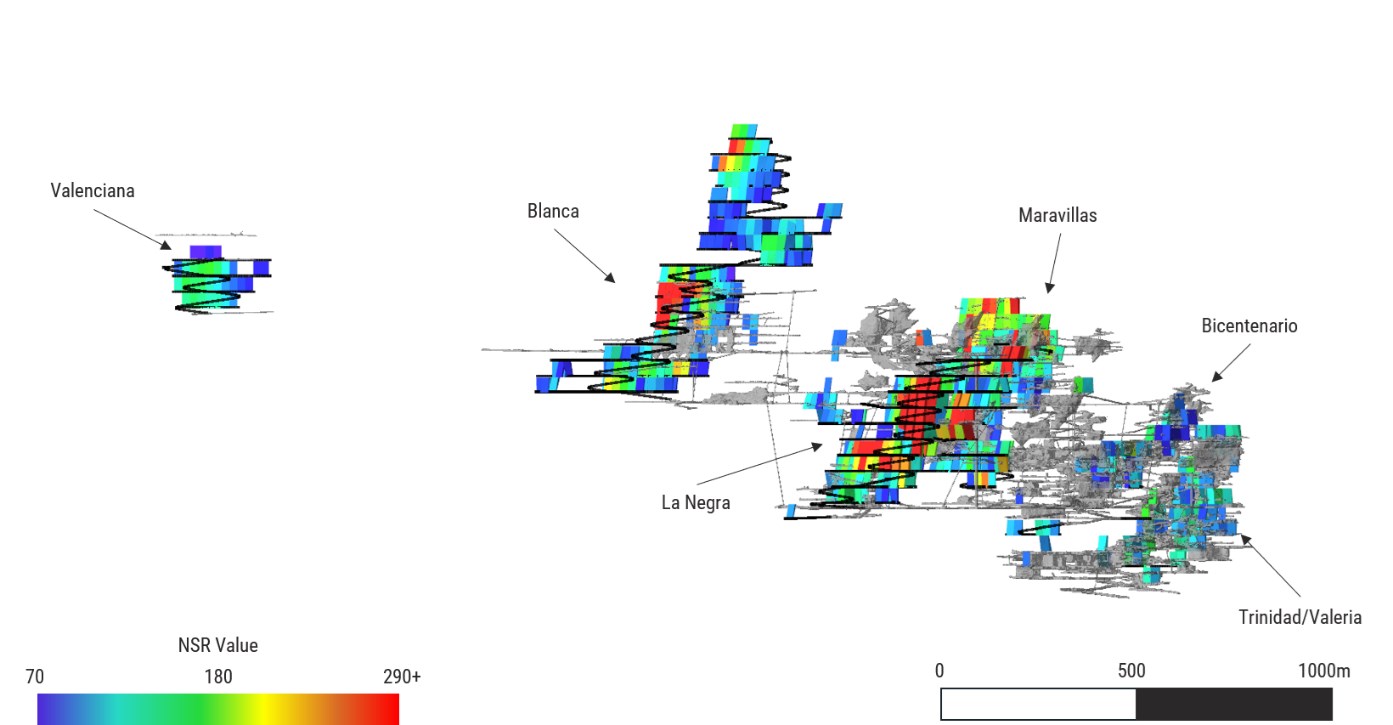
A significant contributor to mine production is the La Negra zone. This is one of the higher-grade areas of the mine, but production from this zone has been conservatively scheduled towards the end of the mine life to allow for additional underground surveys and infill drilling to be completed to further confirm historic workings in the area. This work may impact assumptions utilized in the MRE including the required depletion and buffer, which was conservatively assumed to be a two-meter buffer around existing workings during stope design. Once this work is complete, there may be an opportunity to optimize the mine plan to move production from La Negra forward, benefitting production and costs earlier in the mine life.
Figure 3- La Negra Mine Design – Long Section View, Looking North
To view an enhanced version of this graphic, please visit:
https://images.newsfilecorp.com/files/10393/315153_954029d394f4fa13_004full.jpg
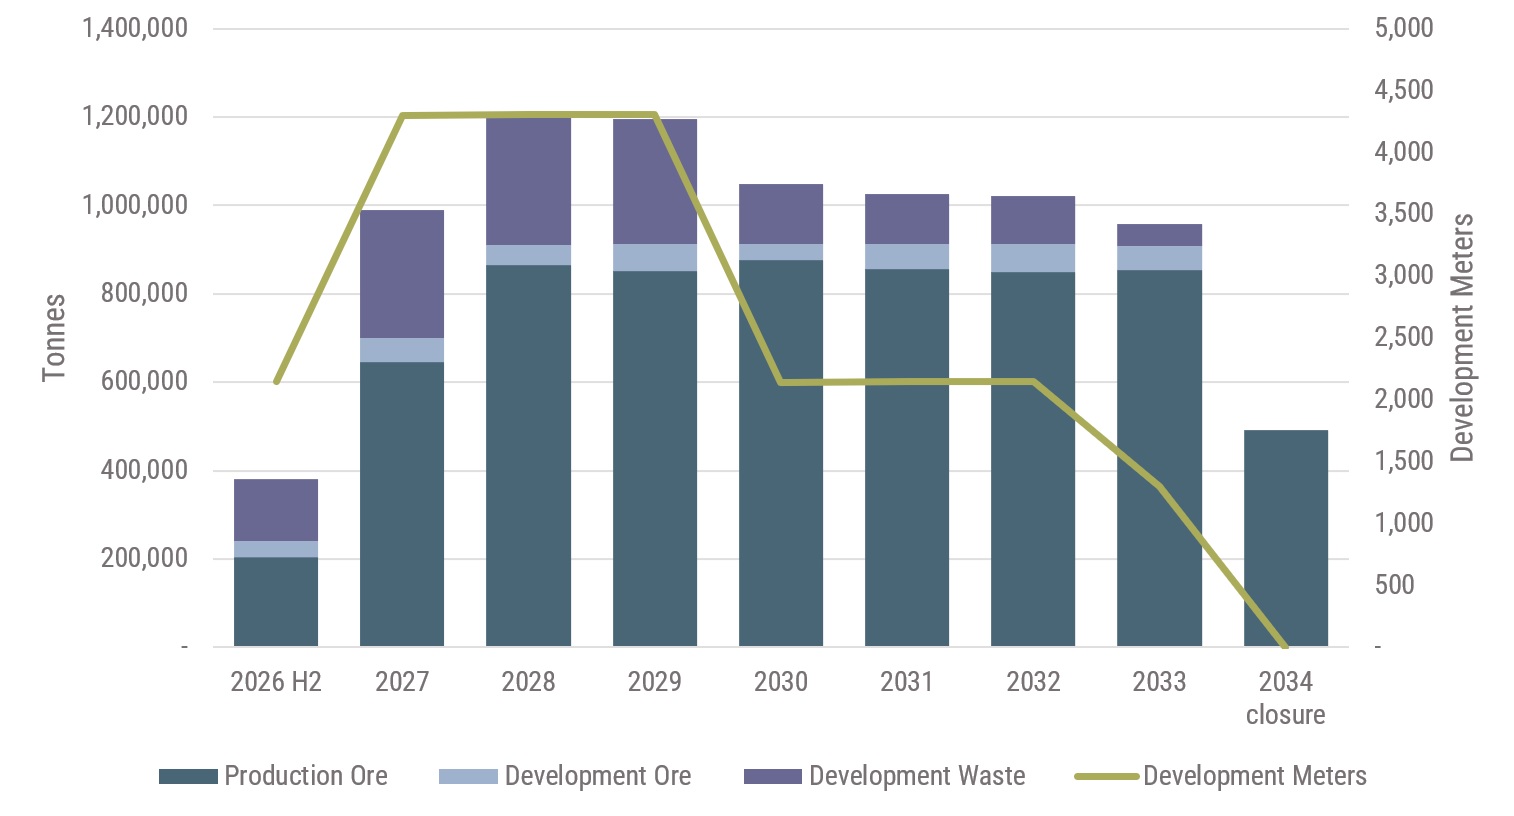
Figure 4 – Mine Schedule
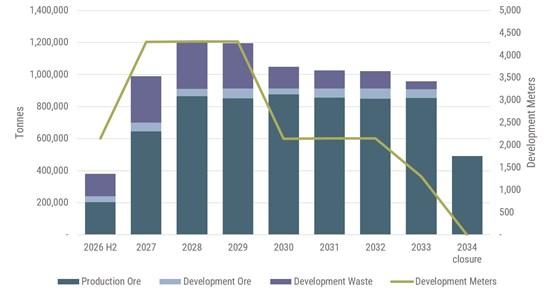
To view an enhanced version of this graphic, please visit:
https://images.newsfilecorp.com/files/10393/315153_silvercofig421092026.jpg
Processing and Metallurgy
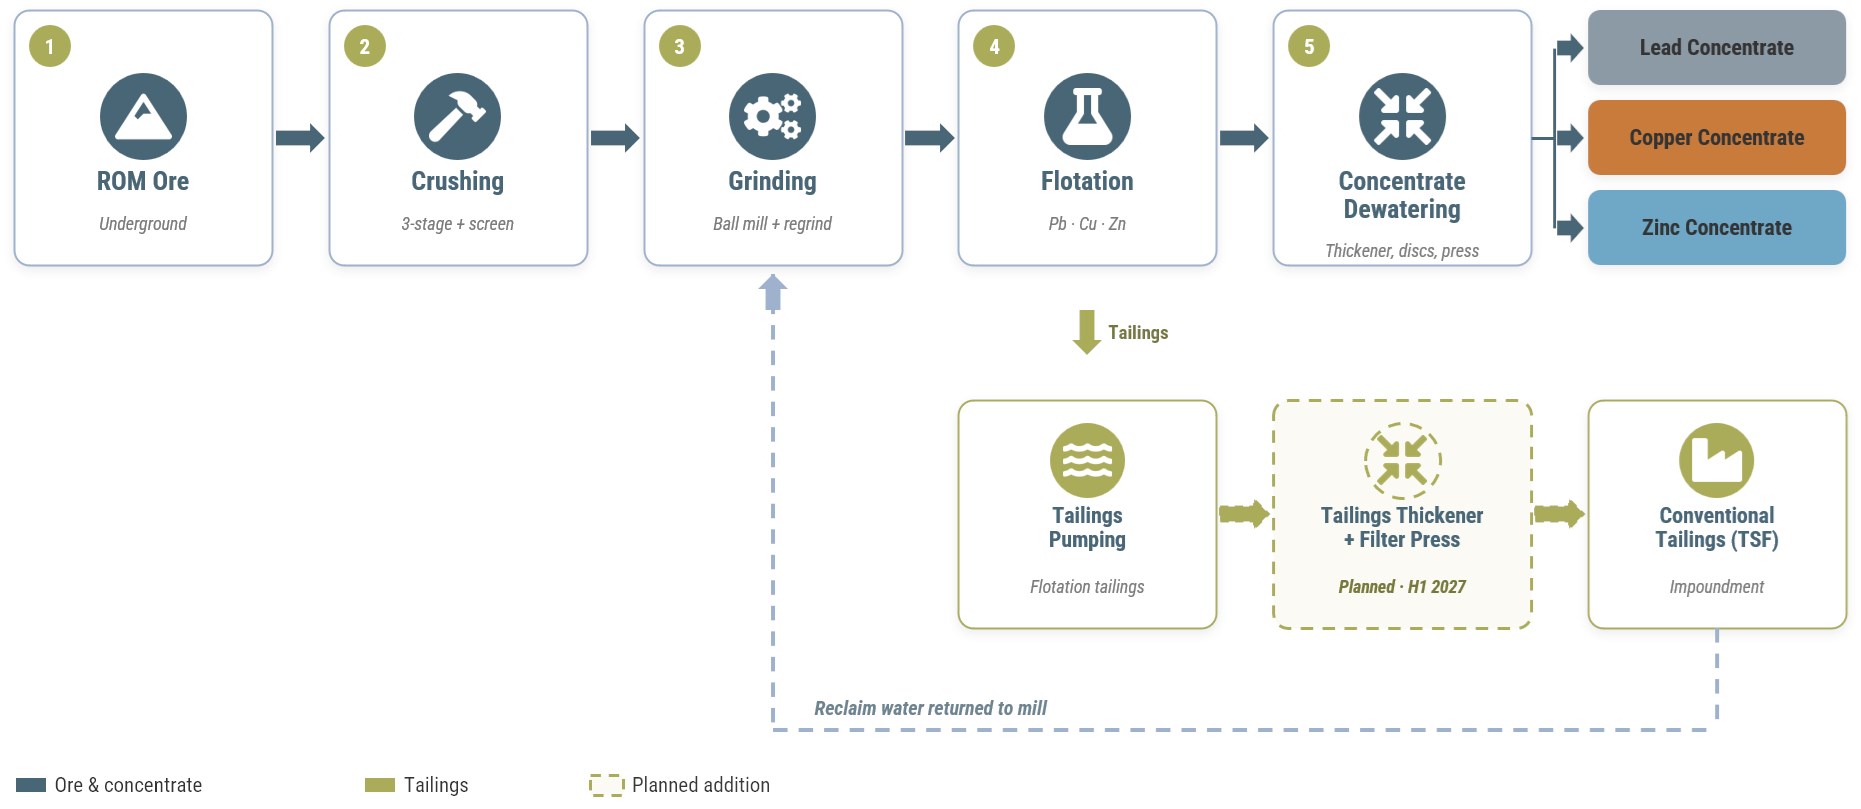
The processing facility at La Negra consists of a standard crushing, grinding, flotation, and filtration circuit producing lead-silver, copper-silver, and zinc concentrates. Crushing is completed using a primary jaw crusher with secondary and tertiary cone crushers, followed by two parallel ball milling lines for primary grinding with one additional mill for regrind. Flotation circuit is three stages to recover the different concentrates. The processing plant flowsheet has been well established and is little changed over the history of the operation, allowing for operating parameters and recoveries to be well understood.
Life-of-mine metallurgical recoveries average 83.6% for silver, 77.8% for copper, 81.5% for lead and 81.9% for zinc. Metallurgical recovery assumptions were developed off actual plant performance since restarting in 2024 up to Q1 2026. Recent optimization work on grade control, improved process controls and blending strategies suggest that there may be opportunities to optimize recoveries higher than assumed in the PEA.
Silver reports principally to the lead concentrate, with the balance to the copper and zinc concentrates. Silver recoveries benefit from higher grades, with the processing plant schedule seeing recovery rise through the mine life as head grades increases.
Figure 5 – La Negra Simplified Process Plant Circuit
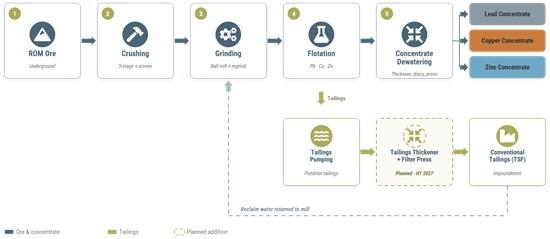
To view an enhanced version of this graphic, please visit:
https://images.newsfilecorp.com/files/10393/315153_954029d394f4fa13_006full.jpg
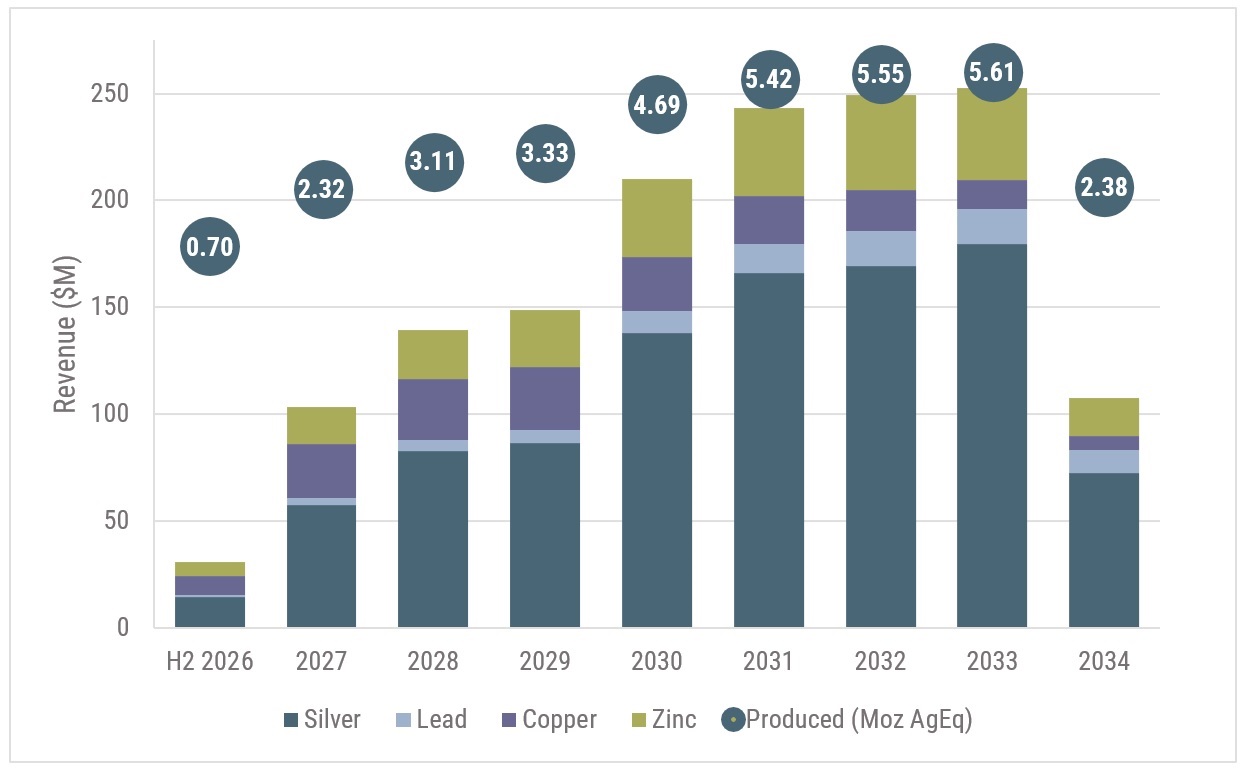
Average annual production over the LOM is forecasted to be 4.1 Moz AgEq produced for total production of 33.1 Moz AgEq over the LOM.
Table 4 – Production Schedule
| Units | 2026(3) | 2027 | 2028 | 2029 | 2030 | 2031 | 2032 | 2033 | 2034 | LOM | |
| Mill Feed | |||||||||||
| Milled (kt) | Kt | 240 | 700 | 912 | 912 | 912 | 912 | 912 | 909 | 492 | 6,902 |
| Ag Feed Grade | g/t | 55 | 71 | 77 | 80 | 123 | 146 | 149 | 157 | 118 | 114 |
| Cu Feed Grade | % | 0.50 | 0.47 | 0.42 | 0.43 | 0.37 | 0.34 | 0.29 | 0.21 | 0.19 | 0.35 |
| Pb Feed Grade | % | 0.17 | 0.33 | 0.39 | 0.45 | 0.76 | 0.98 | 1.18 | 1.19 | 1.48 | 0.80 |
| Zn Feed Grade | % | 1.48 | 1.34 | 1.33 | 1.54 | 2.07 | 2.30 | 2.46 | 2.40 | 1.88 | 1.92 |
| Recoveries | |||||||||||
| Ag | % | 78.8% | 81.1% | 81.8% | 82.1% | 84.6% | 85.3% | 85.4% | 85.6% | 84.4% | 83.6% |
| Cu | % | 80.3% | 80.0% | 79.4% | 79.5% | 78.7% | 78.1% | 77.2% | 74.4% | 73.0% | 77.8% |
| Pb | % | 74.7% | 79.4% | 80.2% | 80.7% | 82.2% | 82.7% | 83.0% | 83.0% | 83.3% | 81.5% |
| Zn | % | 80.6% | 79.9% | 79.8% | 80.9% | 82.6% | 83.2% | 83.5% | 83.4% | 82.1% | 81.9% |
| Metal Recovered to Concentrate | |||||||||||
| Ag | Koz | 335 | 1,293 | 1,850 | 1,936 | 3,052 | 3,654 | 3,721 | 3,932 | 1,575 | 21,349 |
| Cu | Mlbs | 2.1 | 5.8 | 6.6 | 6.8 | 5.8 | 5.3 | 4.5 | 3.2 | 1.5 | 41.8 |
| Pb | Mlbs | 0.7 | 4.1 | 6.4 | 7.3 | 12.7 | 16.4 | 19.9 | 20.0 | 13.5 | 99.9 |
| Zn | Mlbs | 6.3 | 16.6 | 21.4 | 25.2 | 34.5 | 38.7 | 41.5 | 40.3 | 16.8 | 240.0 |
| AgEq Produced (1) | koz | 702 | 2,319 | 3,111 | 3,330 | 4,691 | 5,416 | 5,548 | 5,609 | 2,377 | 33,108 |
| Payable Metals | |||||||||||
| Ag | Koz | 293 | 1,151 | 1,659 | 1,732 | 2,762 | 3,323 | 3,388 | 3,593 | 1,448 | 19,350 |
| Cu | Mlbs | 2.0 | 5.6 | 6.3 | 6.5 | 5.6 | 5.0 | 4.3 | 3.0 | 1.4 | 39.8 |
| Pb | Mlbs | 0.6 | 3.8 | 5.9 | 6.8 | 11.7 | 15.2 | 18.4 | 18.5 | 12.5 | 93.5 |
| Zn | Mlbs | 5.2 | 13.5 | 17.4 | 20.6 | 28.2 | 31.6 | 33.9 | 33.0 | 13.7 | 197.1 |
| AgEq Payable (2) | koz | 621 | 2,072 | 2,786 | 2,973 | 4,204 | 4,867 | 4,984 | 5,049 | 2,152 | 29,707 |
Notes:
Tailings Management
Tailings are currently deposited conventionally in the on-site tailings storage facility. The Company is installing a tailings thickener and filter press to move to filtered (dry-stack) deposition, targeted for commissioning and ramp-up in H1 2027. Filtered deposition is designed to increase operational flexibility, improve water recovery and reduce the operation’s freshwater draw. The improvement in water management through filtered tailings will allow for throughput to be increased to 2,500tpd. The PEA includes growth capital for the thickening and filtration plant as well as continued tailings dam expansions and a further tailings dam in year 2031 within sustaining capital.
Silver Revenue
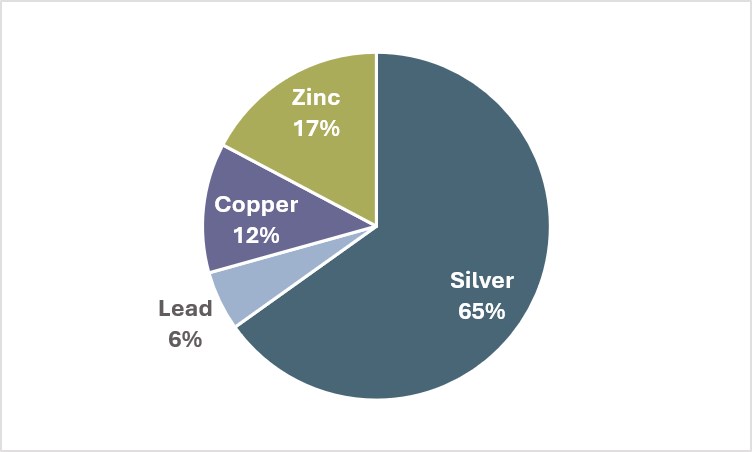
Approximately 65% of the projected life-of-mine Net Smelter Return revenue is generated from silver production. The remaining 35% of the NSR revenue is comprised of by-product metals, including copper (12%), lead (6%), and zinc (17%), as calculated using the PEA’s metallurgical recovery, metal price assumptions, and payabilities.
Figure 6 – Life-of-Mine Net Smelter Return by Metal
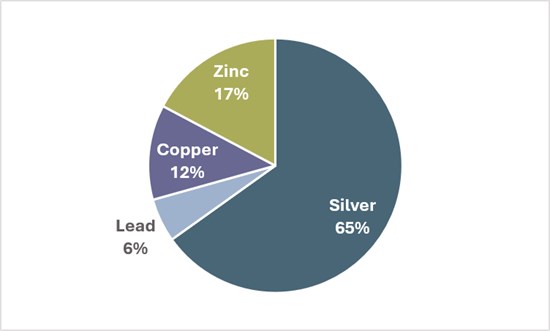
To view an enhanced version of this graphic, please visit:
https://images.newsfilecorp.com/files/10393/315153_954029d394f4fa13_007full.jpg
Figure 7 – Life-of-Mine Payable Revenue by Metal and Silver Equivalent Production
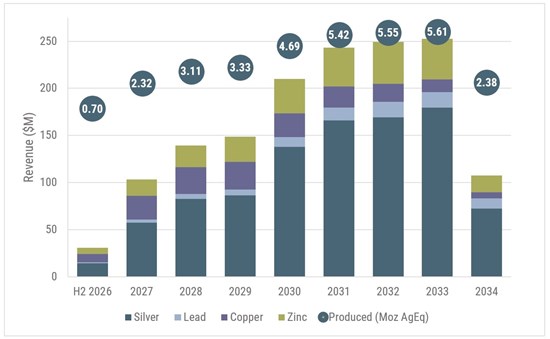
To view an enhanced version of this graphic, please visit:
https://images.newsfilecorp.com/files/10393/315153_silvercofig721092026.jpg
Forecasted Operating Cost
Operating costs were estimated as a combination of historical operating costs at La Negra (based on recent operating data), updated with current labour rates and reagent and consumable pricing, and projected dry-stack tailings and new equipment operating costs. A concentrate offtake agreement is in place for the life of the mine. Third party royalties are estimated to be approximately 5% after deductions and are in addition to the 1% extraordinary mining duty that applies to precious metals in Mexico.
Life-of-mine cash operating costs have been estimated at $67.59/t and all-in-sustaining-costs are estimated at $24.86/AgEq oz payable.
Table 5 – Operating Cost Estimates
| Operating Costs | LOM Total ($M) | Unit Cost ($/t) | Unit Cost ($/AgEq oz payable) |
| Mining | 249.0 | 36.07 | 8.38 |
| Processing | 161.8 | 23.43 | 5.45 |
| General & Administrative | 55.8 | 8.08 | 1.88 |
| Total Cash Operating Costs | 466.5 | 67.59 | 15.70 |
| TC/RCs & Royalties | 203.7 | 29.51 | 6.86 |
| Total Cash Costs | 670.2 | 97.10 | 22.56 |
| Net Sustaining Capital Costs | 68.3 | 9.90 | 2.30 |
| Total Site AISC(1) | 738.5 | 107.00 | 24.86 |
Notes:
Life-of-Mine Capital Summary
The initial growth capital requirements are forecasted to be $20.9 M over 2026 and 2027. The initial capital estimate consists primarily of the new mining fleet, completion of the dry-stack tailings project, and some minor underground infrastructure upgrades. Working capital has been excluded from capital but included within the financial model.
Sustaining capital is estimated at $68.3 M over the life-of-mine, primarily related to ongoing underground mine development and associated infrastructure, tailings management, and closure costs.
Table 6 – Life-of-Mine Capital Estimates
| LOM Capital | Cost ($M) |
| Growth Capital | 20.9 |
| Sustaining Capital | 68.3 |
| Closure(1) | 13.7 |
| Net Sustaining Capital | 82.0 |
| Total LOM Capital | 102.9 |
Notes:
Forecast Return Estimates
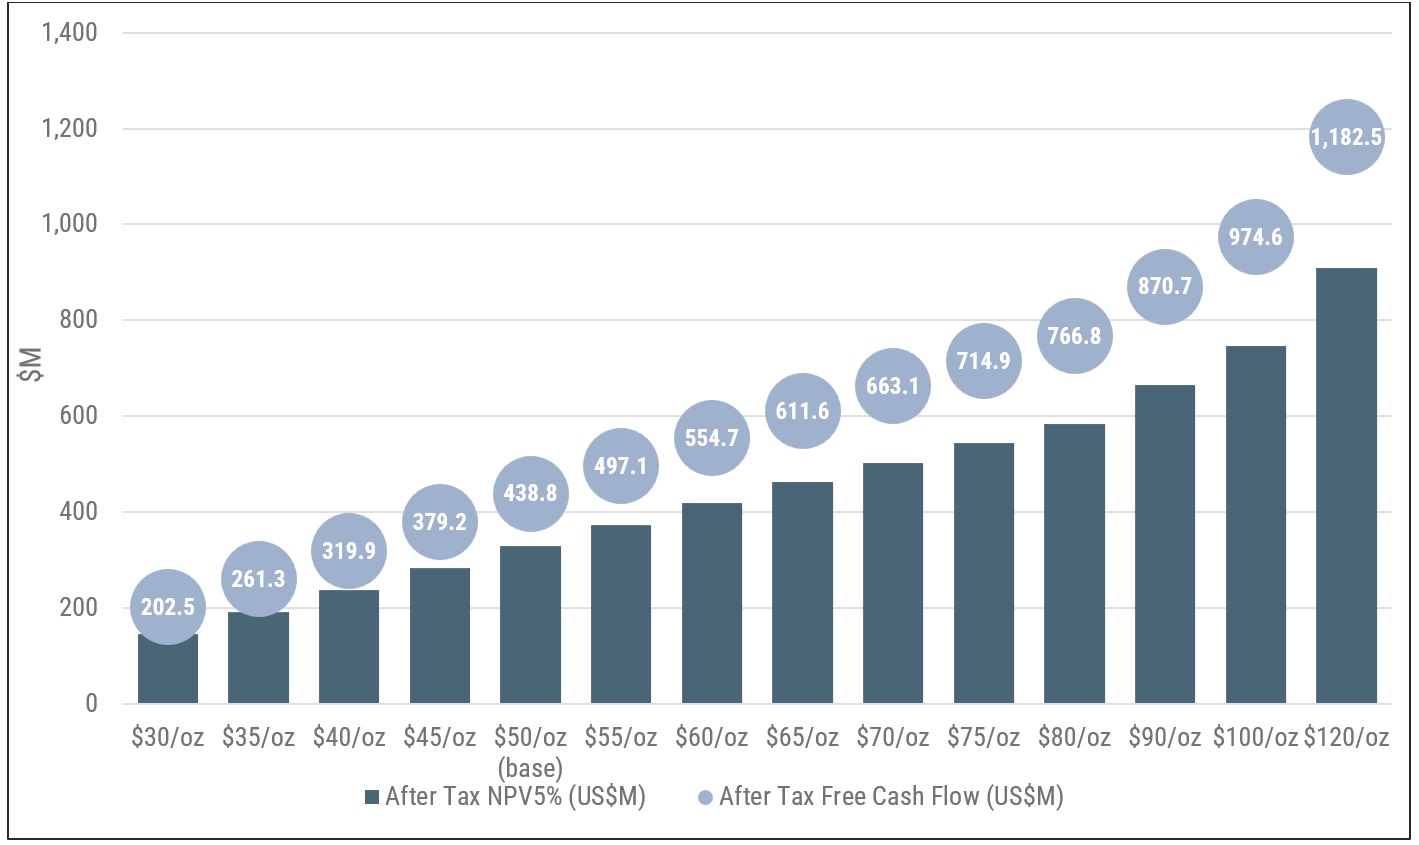
The economic analysis outlines a base case after-tax Net Present Value (“NPV”) of $329 M at a 5% discount rate with a payback of 2.0-years. The LTM Case outlines an after-tax NPV of $991.0 M with no cash outlay, at the same discount rate.
Table 7 – Project Pre and Post-tax Economics
| Metric | Units | Break-even | -30% | Base case | Spot(2) | LTM High |
| Silver price | $/oz | 26.8 | 35.0 | 50.0 | 65.0 | 120 |
| Copper price | $/lb | 2.4 | 3.2 | 4.5 | 6.5 | 6.90 |
| Lead price | $/lb | 0.5 | 0.6 | 0.9 | 0.9 | 0.95 |
| Zinc price | $/lb | 0.7 | 0.9 | 1.3 | 1.8 | 1.80 |
| Pre-tax NPV (5%) | $M | 33.9 | 215.1 | 545.1 | 864.1 | 1,581.4 |
| Pre-tax IRR | % | 14% | 60% | 227% | 1,934% | – |
| Pre-tax payback | years | 6.1 | 3.7 | 1.3 | 0.6 | – |
| After-tax NPV(5%) | $M | – | 116.1 | 328.7 | 531.9 | 991.0 |
| After-tax IRR | % | 5% | 40% | 131% | 511% | – |
| After-tax payback | years | 6.9 | 4.4 | 2.0 | 0.7 | – |
| Undiscounted after-tax cash flow | $M | 19.2 | 166.5 | 438.8 | 696.2 | 1,284.5 |
| LOM revenue (NSR) | $M | 671.7 | 915.9 | 1,360.3 | 1,787.7 | 2,765.3 |
| LOM EBITDA | $M | 167.5 | 397.1 | 815.1 | 1,216.9 | 2,132.1 |
| AISC | $/AgEq oz | 23.4 | 23.9 | 24.9 | 26.7 | 38.5 |
| After-tax NPV(5%)/ growth capital | x | – | 5.6 | 15.7 | 25.5 | 47.5 |
Notes:
(1) AISC is variable across scenarios due to impact of TC/RCs and royalties at varying metal prices.
(2) Spot metal prices as of September 17, 2026
Sensitivity Analysis
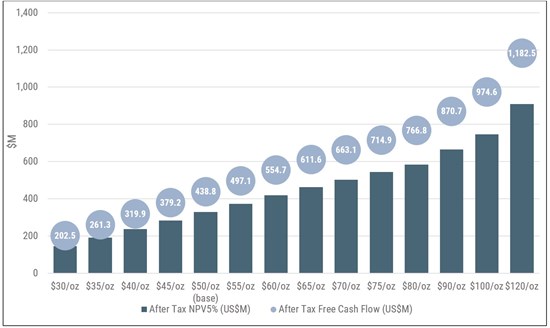
The Figure 8 shows the after-tax NPV(5%) discount rate at various silver price assumptions, with all other metal prices held constant.
Figure 8 – After-Tax Silver Price Sensitivity
To view an enhanced version of this graphic, please visit:
https://images.newsfilecorp.com/files/10393/315153_silvercofig821092026.jpg
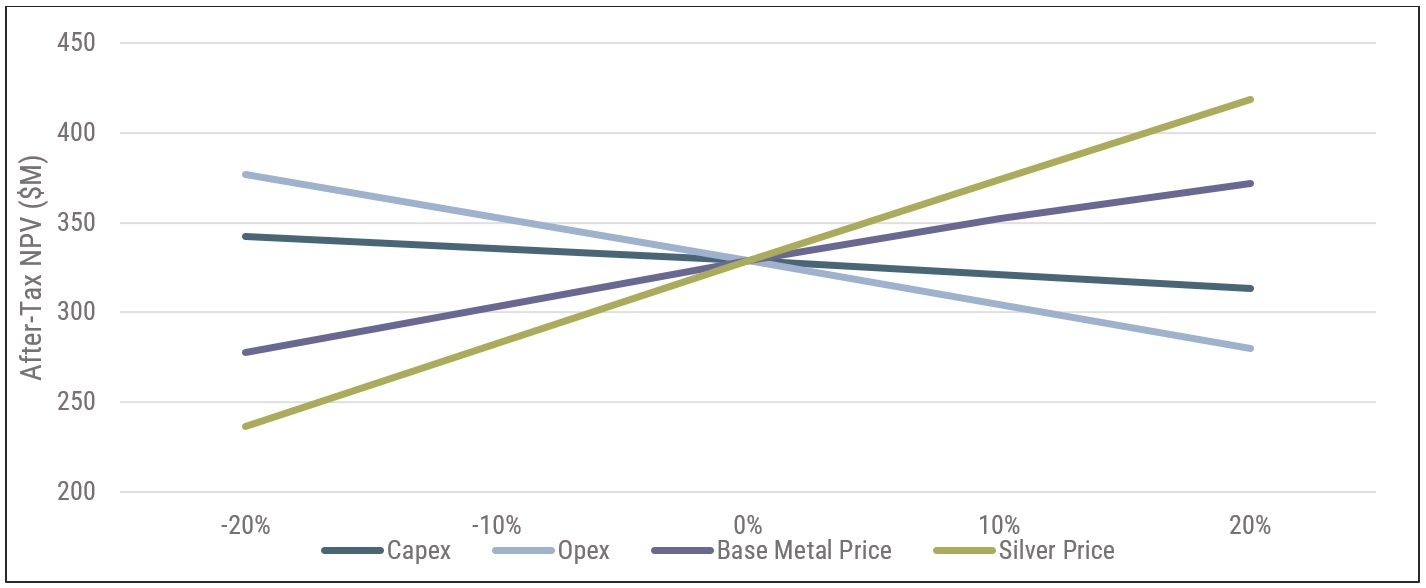
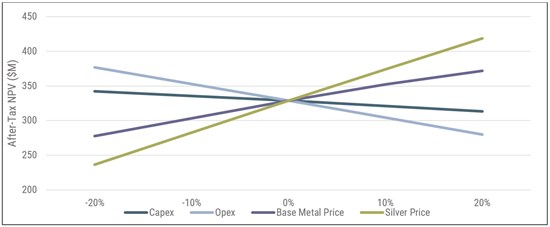
The project economics are most sensitive to silver prices, followed by operating costs, base metals, and capital expenditure. Figure 9 shows the after-tax NPV(5%) at varying multipliers applied to each parameter.
Figure 9 – Project Sensitivity
To view an enhanced version of this graphic, please visit:
https://images.newsfilecorp.com/files/10393/315153_silvercofig921092026.jpg
Growth and Next Steps
With a robust PEA demonstrating a clear path to increased production, Silverco intends to advance La Negra through the remaining technical milestones required to support the equipment and tailings installation program. The Company will continue to evaluate opportunities to expand the mineral resource base and optimize the mine plan as new drill data becomes available.
Qualified Persons with respect to this News Release
The Mineral Resource Estimate was prepared by Allan Armitage, Ph.D., P.Geo. of SGS Geological Services, an independent Qualified Person as defined by NI 43-101. Dr. Armitage completed site visits to the Project on March 23-24, 2026 and June 12-13, 2026.
William van Breugel, P. Eng. an associate engineer of SGS Geological Services, an independent Qualified Person as defined by NI 43-101, having responsibility for the project economics including capital expenditures, operating expenditures, financials, and sensitivities.
Johnny Canosa, P. Eng. of SGS Geological Services, an independent Qualified Person as defined by NI 43-101, having responsibility for the mining methods, infrastructure, and environment, permitting & social or community impact.
Henri Gouin, P. Eng. of SGS Geological Services, an independent Qualified Person as defined by NI 43-101, having responsibility for the underground mining planning and schedule. Mr. Gouin completed a site visit to the Project on June 12-13, 2026.
Shaohai Yu, P. Eng of SGS North America, an independent Qualified Person as defined by NI 43-101, having responsibility for the mineral processing, metallurgical testing, and recovery methods.
The scientific and technical information contained in this news release has been reviewed and approved by Nico Harvey, P.Eng., Vice President Project Development of Silverco, a Qualified Person as defined in National Instrument 43-101. Mr. Harvey is not independent of the Company. Mr. Harvey has reviewed the technical information disclosed herein.
About Silverco Mining Ltd.
Silverco Mining Ltd. is a Canadian silver producer focused on building a leading multi-asset silver portfolio in Mexico. The Company owns 100% of the producing La Negra Mine in Querétaro and the past-producing Cusi Silver Complex in Chihuahua, two established underground mines with significant infrastructure, exploration upside, and district-scale land positions. The Company is restarting production at Cusi in H2 2026, positioning Silverco to become a significant primary silver producer in the Americas in the near term.
Led by an experienced management team with a proven track record in mine development, operations, and capital markets, Silverco is focused on creating long-term shareholder value through disciplined growth and responsible mining practices, with a goal of becoming a 10-million-ounce per year silver equivalent producer within three years. Silverco’s common shares trade on the TSX Venture Exchange under the symbol “SICO” and on the OTCQB under the symbol “SICOF.” More information on the Company and its projects can be found at www.silvercomining.com.
On Behalf of the Board of Directors
“Mark Ayranto”
Mark Ayranto, President & CEO
Email: mayranto@silvercomining.com
For further information, please contact:
Investor Relations & Communications
Email: info@silvercomining.com
www.silvercomining.com
Cassiar Gold Corp. (TSX-V: GLDC) (OTCQX: CGLCF) is pleased to announce the signing of an Exploration... READ MORE
Elemental Royalty Corporation (NASDAQ: ELE) (TSX: ELE) is pleased to announce that it has entered i... READ MORE
Cambria Gold Mines Inc.(TSX-V: CAMB) (OTCQX: CAMVF) is pleased to announce new assay results from th... READ MORE
Meridian Mining plc (LSE: MNO) (TSX: MNO) (FSE: N2E0) (Tradegate: N2E0) (OTCQX: MRRDF) is ple... READ MORE
Goliath Resources Limited (TSX-V: GOT) (OTCQB: GOTRF) (FSE: B4IF) is pleased to announce that the 2... READ MORE