







ROCK CREEK BC
Ximen Mining Corp. (TSX-V: XIM) (FRA: 1XMA) (OTCQB: XXMMF) announces that it has conducted an interpretation of the results from a LiDAR survey completed at its Amelia Property, located at historic Camp McKinney near Rock Creek in southern British Columbia.
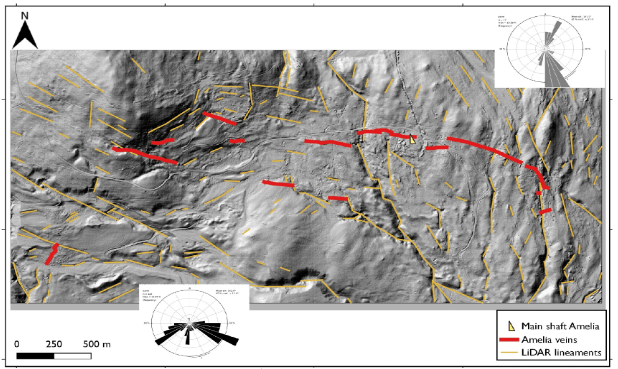
Figure 2. LiDAR DEM and features identified
The Amelia property covers the historic Cariboo-Amelia gold mine in Camp McKinney near Rock Creek, BC in the Greenwood Mining Division. Over its history, the Cariboo Amelia mine produced 81,602 ounces of gold and 32,439 ounces of silver from 112,254 tonnes milled (BC Minfile). The mine is part of a 4-kilometer system of gold-quartz veins. Ximen is exploring for extensions to the historic mine and to discover new mineralized zones.
A helicopter-borne LiDAR survey was completed over an area of 7.7 square kilometers see in (Figure 1 Below). The survey resulted in two products: a digital elevation model (DEM) and an orthophoto mosaic. The purpose of the survey was to obtain a high-resolution topographic base and updated orthophotos of the area. The DEM was used to identify lineaments related to geological and geomorphological features.
Lineaments were identified from the DEM that correspond to topographic lows and are interpreted as either faults, dikes, or bedding traces. Two domains are defined by the trends of lineaments. In the western area, lineaments trend predominantly 112° and 235°, whereas in the eastern area, they trend 160° and 25° (Figure 2). The two domains are separated by a prominent south-southeast trending lineament that is interpreted as a significant cross-fault. Other than this apparent fault, the lineaments are interpreted as reflecting the traces of folded strata. This interpretation agrees with previous geological mapping but suggests that there is large-scale folding in the area of the Amelia property.
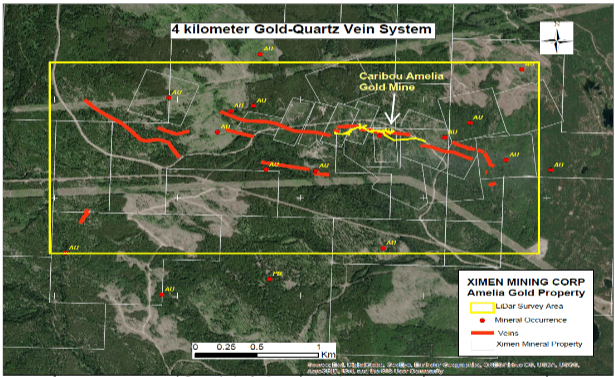
Figure 1. Amelia Property map showing survey area
Lineaments were identified from the DEM that correspond to topographic lows and are interpreted as either faults, dikes, or bedding traces. Two domains are defined by the trends of lineaments. In the western area, lineaments trend predominantly 112° and 235°, whereas in the eastern area, they trend 160° and 25° (Figure 2). The two domains are separated by a prominent south-southeast trending lineament that is interpreted as a significant cross-fault. Other than this apparent fault, the lineaments are interpreted as reflecting the traces of folded strata. This interpretation agrees with previous geological mapping but suggests that there is large-scale folding in the area of the Amelia property.
The pattern of lineaments reveals a possible fundamental control on the location of the mineralization within the gold-quartz vein system that extends across the property. Except for the Anarchist vein in the southwest, which is hosted within intrusive rocks, mapped quartz veins in the western domain lie parallel to the lineaments. In the eastern domain, veins trend across the 160° lineament trend in its western part but trend parallel to lineaments in the easternmost part. If the lineaments indicate the traces of strata, quartz veins lie parallel to the stratigraphy in the western domain and in the eastern domain, the veins crosscut strata in the western part but swing to follow southeast trending stratigraphy in the easternmost area. The area of historic mining corresponds to the area where the veins trend across strata.
Additional features reflecting infrastructure such as logging roads and previous exploration workings were identified using a combination of the digital elevation model (DEM) (Figure 2 Above) and the orthomosaic (Figure 3 below).
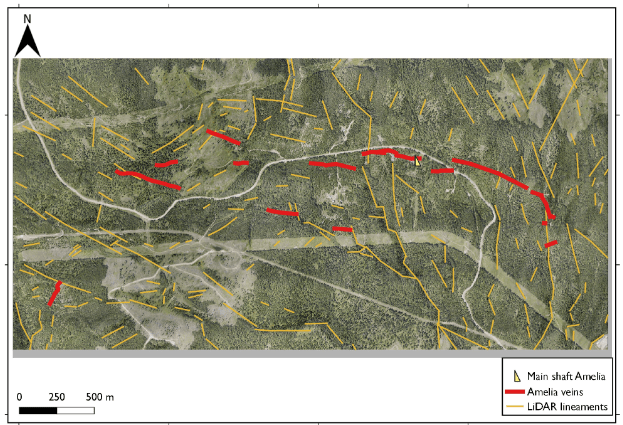
Figure 3. Image of the orthomosaic from the LiDAR survey
showing lineaments identified
Readers are cautioned that historical records referred to in this News Release have been examined but not verified by a Qualified Person. Further work is required to verify that historical records referred to in this News Release are accurate.
Dr. Mathew Ball, P.Geo., VP Exploration for Ximen Mining Corp. and a Qualified Person as defined by NI 43-101, approved the technical information contained in this News Release.
Manitoba-focused company, backed by the Canada Growth Fund, Orion... READ MORE
Golconda Gold Ltd. (TSX-V: GG) (OTCQX: GGGOF) is pleased to annou... READ MORE
Talamore Mining Corp. (TSX: TALA) (OTCQB: TALMF) is pleased to an... READ MORE
Atico Mining Corporation (TSX-V: ATY) (OTC: ATCMF) reports that i... READ MORE
ATERRA Metals Inc. (CSE: ATC) (OTCQB: CSSCF) is pleased to announ... READ MORE


