


![]()
West Red Lake Gold Mines Ltd. (TSX-V: WRLG) (OTCQB: WRLGF) is pleased to announce drill results from its fully funded infill and conversion drilling program at the 100% owned Rowan Project located in the Red Lake Mining District of Northwestern Ontario, Canada.
Will Robinson, Vice President of Exploration, stated, “We are very encouraged by the results received to date from the Rowan infill drilling program. Bringing Veins 006b and 013 into consideration for PFS mine design has the potential to materially change the way we view the Rowan deposit, and it’s expected contribution to a future hub and spoke production model in Red Lake. The 2025 PEA envisioned Rowan as a small footprint, underg round extraction scenario delivering high-margin rock with an average diluted grade of 8 grams per tonne gold at the rate of 400 tonnes per day. Incorporating Veins 006b and 013 into the production profile has the potential to materially increase the daily mined tonnage from Rowan, which could significantly increase the economics of the project. Though further engineering work is required to fully substantiate this scenario our team is excited to begin updating the geologic model, mineral resource estimate and mine design for the combined Madsen-Rowan PFS slated for Q3 2026. Additionally, we are seeing favorable intercepts along strike from currently modeled Veins 001 and 003, which were both included in the 2025 PEA mine plan – this speaks to the excellent opportunity for continued resource growth at Rowan through additional expansion drilling.”
The results featured in this new release are focused on the high-grade Rowan vein s ystem and are in addition to the intercepts recently announced on February 18, 2026 which highlighted 84.3 grams per tonne gold over 1 metre, 14.4 g/t Au over 5.5m and 24.4 g/t Au over 1.5m, and on January 29, 202 6 which highlighted 141.5 g/t Au over 1m, 55.8 g/t Au over 1m and 28.5 g/t Au over 1m.
A total of thirty-seven holes for approximately 6,300m were completed at Rowan in the current drilling program. Fire assay gold results have been reported for twenty-six (26) holes. Results are pending for eleven (11) holes.
ROWAN DRILLING HIGHLIGHTS:
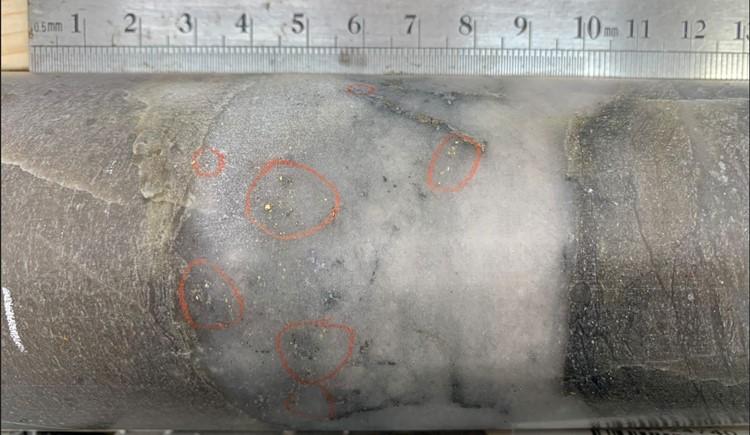
FIGURE 1. Multiple instances of visible gold in hole RLG-26-210 associated with quartz veining. Drill core is HQ (63.5 mm) diameter.
TABLE 1. Significant intercepts (>1 g/t Au) from drilling at Rowan Deposit.
| Hole ID | Target | Vein | From (m) | To (m) | Length (m)* | Au (g/t) | VG |
| RLG-25-195 | Rowan | V001 (hw) | 236.73 | 237.50 | 0.77 | 2.89 | |
| AND | Rowan | V001 | 243.50 | 244.44 | 0.94 | 1.17 | |
| AND | Rowan | V001 (fw) | 256.75 | 257.75 | 1.00 | 1.15 | |
| RLG-25-202 | Rowan | Assays Pending | |||||
| RLG-25-203 | Rowan | V013 | 15.30 | 16.45 | 1.15 | 6.06 | |
| AND | Rowan | V006b | 76.80 | 78 .50 | 1.70 | 3.66 | |
| Incl. | 76.80 | 77.30 | 0.50 | 11.40 | X | ||
| AND | Rowan | Unmodeled | 92.50 | 93.50 | 1.00 | 2.56 | |
| AND | Rowan | Unmodeled | 95.50 | 96.50 | 1.00 | 1.12 | |
| AND | Rowan | Unmodeled | 102.75 | 104.50 | 1.75 | 1.34 | |
| AND | Rowan | V005 | 134.25 | 135.50 | 1.25 | 1.33 | |
| AND | Rowan | V003 (hw) | 150.50 | 151.00 | 0.50 | 1.23 | |
| AND | Rowan | V003 (hw) | 154.50 | 155.50 | 1.00 | 1.94 | |
| AND | Rowan | V003 | 157.40 | 158.90 | 1.50 | 8.80 | |
| Incl. | 157.40 | 157.90 | 0.50 | 20.10 | X | ||
| AND | Rowan | V001 (hw) | 168.25 | 168.75 | 0.50 | 3.62 | |
| AND | Rowan | V001 | 171.90 | 173.90 | 2.00 | 4.20 | |
| Incl. | 172.90 | 173.40 | 0.50 | 10.70 | X | ||
| RLG-25-204 | Rowan | Unmodeled | 20.75 | 22.55 | 1.80 | 2.11 | |
| AND | Rowan | V011 | 32.65 | 34.75 | 2.10 | 2.47 | |
| AND | Rowan | V013 | 57.50 | 58.50 | 1.00 | 10.15 | X |
| Incl. | 57.50 | 58.00 | 0.50 | 14.45 | X | ||
| AND | Rowan | V013 (fw) | 60.35 | 60.95 | 0.60 | 1.42 | |
| AND | Rowan | V006b | 110.70 | 111.70 | 1.00 | 8.41 | |
| Incl. | Rowan | 111.20 | 111.70 | 0.50 | 16.10 | X | |
| AND | Rowan | Unmodeled | 124.50 | 125.25 | 0.75 | 1.51 | |
| AND | Rowan | Unmodeled | 127.00 | 128.50 | 1.50 | 1.15 | |
| RLG-25-205 | Rowan | Assays Pending | |||||
| RLG-25-206 | Rowan | V006b | 76.00 | 76.50 | 0.50 | 41.50 | X |
| RLG-25-207 | Rowan | V013 | 38.40 | 39.90 | 1.50 | 5.64 | |
| Incl. | 38.40 | 38.90 | 0.50 | 15.95 | X | ||
| AND | Rowan | V017 | 67.50 | 68.50 | 1.00 | 2.03 | |
| AND | Rowan | V017 ( fw) | 74.50 | 76.25 | 1.75 | 2.23 | |
| AND | Rowan | V006b | 109.70 | 110.20 | 0.50 | 1.24 | X |
| AND | Rowan | V001 | 186.75 | 188.25 | 1.50 | 12.32 | |
| Incl. | 187.25 | 187.75 | 0.50 | 36.70 | X | ||
| RLG-25-208 | Rowan | V011 | 22.15 | 23.15 | 1.00 | 4.69 | |
| Incl. | 22.15 | 22.65 | 0.50 | 9.25 | X | ||
| AND | Rowan | V006b | 128.85 | 130.30 | 1.45 | 3.10 | |
| Incl. | 128.85 | 129.60 | 0.75 | 5.70 | |||
| RLG-25-209 | Rowan | V019 (hw) | 140.00 | 141.00 | 1.00 | 1.02 | |
| AND | Rowan | V019 | 145.00 | 146.50 | 1.50 | 1.42 | |
| AND | Rowan | V004 (fw) | 180.15 | 180.65 | 0.50 | 1.19 | |
| AND | Rowan | Unmodeled | 192.50 | 193.00 | 0.50 | 3.96 | |
| RLG-26-210 | Rowan | V006b (hw) | 79. 00 | 81.00 | 2.00 | 2.01 | |
| AND | Rowan | V006b | 85.80 | 87.13 | 1.33 | 3.83 | |
| Incl. | 85.80 | 86.55 | 0.75 | < strong>6.50 | |||
| AND | Rowan | V001 | 146.00 | 147.00 | 1.00 | 30.59 | |
| Incl. | 146.00 | 146.50 | 0.50 | 61.10 | X | ||
| RLG-26-211 | Rowan | V013 | 53.65 | 54.65 | 1.00 | 11.58 | X |
| Incl. | 53.65 | 54.15 | 0.50 | 23.10 | |||
| AND | Rowan | V017 | 66.00 | 67.50 | 1.50 | 1.59 | |
| AND | Rowan | V017 (fw) | 76.00 | 77.50 | 1.50 | 1.44 | |
| AND | Rowan | V006b | 124.20 | 125.20 | 1.00 | 5.23 | |
| Incl. | 124.70 | 125.20 | 0.50 | 9.89 | X | ||
| AND | Rowan | V006b (fw) | 129.00 | 130.00 | 1.00 | 3.67 | |
| AND | Rowan | V003 | 187.70 | 188.70 | 1.00 | 2.04 | |
| AND | Rowan | V001 | 214.00 | 214.60 | 0.60 | 4.32 | |
| AND | Rowan | V001 (fw) | 227.00 | 227.60 | 0.60 | 3.56 | |
| RLG-26-212 | Rowan | V013 | 73.15 | 74.77 | 1.62 | 19.83 | |
| Incl. | 74.15 | 74.77 | 0.62 | 51.50 | X | ||
| RLG-26-213 | Rowan | Unmodeled | 54.71 | 55.21 | 0.50 | 3.38 | X |
| AND | Rowan | V003 | 125.80 | 126.35 | 0.55 | 6.77 | |
| AND | Rowan | V001 | 144.75 | 146.00 | 1.25 | 1.07 | |
| RLG-26-214 | Rowan | V011 | 25.08 | 27.00 | 1.92 | 1.05 | |
| AND | Rowan | V013 | 47.65 | 48.75 | 1.10 | 1.02 | |
| AND | R owan | Unmodeled | 83.95 | 85.95 | 2.00 | 6.65 | |
| Incl. | 84.45 | 84.95 | 0.50 | < strong>25.80 | X | ||
| AND | Rowan | V006b | 130.35 | 131.50 | 1.15 | 2.41 | |
| AND | Rowan | V003 | 173.60 | 175.10 | 1.50 | 4.19 | |
| Incl. | Rowan | 173.60 | 174.10 | 0.50 | 11.00 | ||
| AND | Rowan | V003 (fw) | 179.20 | 180.20 | 1.00 | 1.99 | X |
*The “From-To” intervals in Table 1 are denoting overall downhole length of the intercept. True thickness has not been calculated for these intercepts but is expected to be ≥ 70% of downhole thickness based on intercept angles observed in the drill core. Internal dilution for composite intervals does not exceed 1m for samples grading <0.1 g/t Au. The “VG” column indicates the presence of Visible Gold as observed by the core logging geologist. The (hw) and (fw) notes under “Domain” column are indicating position of grade intercept “hangingwall” or “footwall”, respectively, to primary vein domain. Vein intercepts currently defined as “Unmodeled” may be incorporated into new vein domains in upcoming MRE update for Rowan.
TABLE 2: Drill collar summary for holes reported in this News Release.
| Hole ID | Target | Easting | Northing | Elev (m) | Length (m) | Azimuth | Dip |
| RLG-25-195 | Rowan | 422160 | 5657811 | 366 | 269.50 | 358 | -52 |
| RLG-25-202 | Rowan | 422030.8 | 5657837.72 | 366 | 140.50 | 1 | -53 |
| RLG-25-203 | Rowan | 421963 | 5657870 | 367 | 179.50 | 358 | -53 |
| RLG-25-204 | Rowan | 421964 | 5657836 | 367 | 137.50 | 358 | -47 |
| RLG-25-205 | Rowan | 421964 | 5657835 | 367 | 182.50 | 358 | -59 |
| RLG-25-206 | Rowan | 421934 | 5657870 | 366 | 101.50 | 358 | -50 |
| RLG-25-207 | Rowan | 421933 | 5657846 | 367 | 221.50 | 359 | -49 |
| RLG-25-208 | Rowan | 421934 | 5657845 | 367 | 164.50 | 358 | -61 |
| RLG-25-209 | Rowan | 422157 | 5657859 | 366 | 251.50 | 333 | -50 |
| RLG-26-210 | Rowan | 421910 | 5657861 | 367 | 170.00 | 357 | -46 |
| RLG-26-211 | Rowan | 421918 | 5657837 | 367 | 230.50 | 357 | -53 |
| RLG-26-212 | Rowan | 421918 | 5657837 | 367 | 101.50 | 359 | -66 |
| RLG-26-213 | Rowan | 421881 | 5657870 | 367 | 164.50 | 358 | -52 |
| RLG-26-214 | Rowan | 421881 | 5657835 | 367 | 203.50 | 358 | -53 |
|
|
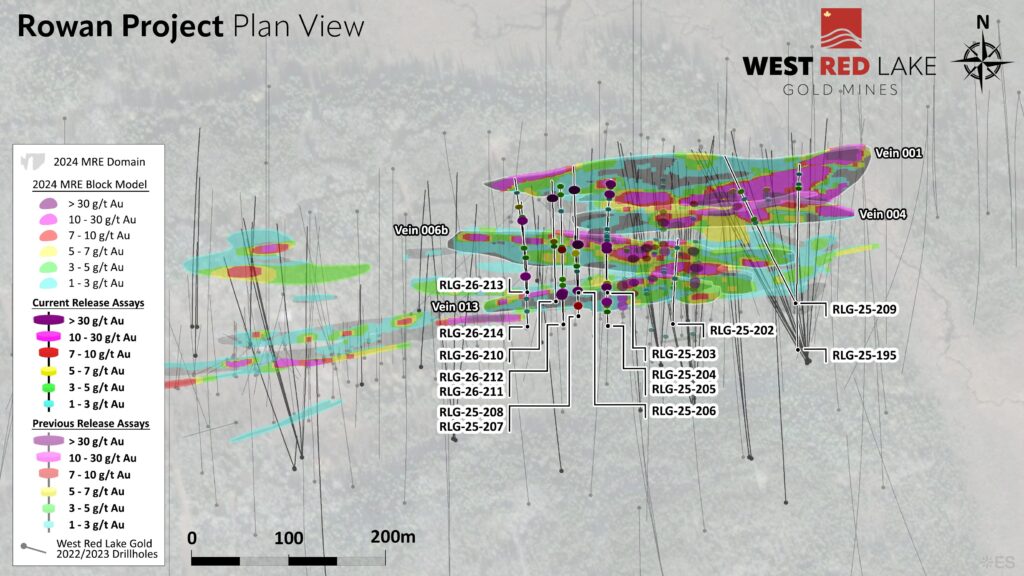
FIGURE 2. Deposit-scale plan map of Rowan project area showing traces and intercepts for holes highlighted in this News Release[1].
[1] Mineral resources are estimated at a cut-off grade of 3.80 g/t Au and a gold price of US$1,800/oz. Please refer to the technical report entitled “Rowan Project NI 43-101 Technical Report and Preliminary Economic Assessment, Ontario, Canada”, prepared by Fuse Advisors Inc., and dated June 30, 2025. A full copy of the report is available on the Company’s website and on SEDAR+ at www.sedarplus.ca.
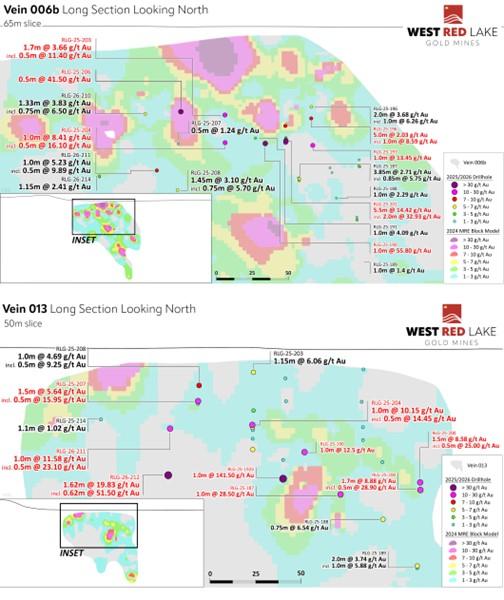
Figure 3. Long Section of Vein 006b showing significant intercepts from the 2025-2026 infill drilling program relative to the 2024 Rowan Block Model used in the 2025 Preliminary Economic Assessment. Assay results are still pending for eleven (11) drillholes which are targeting the western portion of Vein 006b.
Figure 4. Long Section of Vein 013 showing significant intercepts from the 2025-2026 infill drilling program relative to the 2024 Rowan Block Model used in the 2025 Preliminary Economic Assessment. Assay results are still pending for eleven (11) drillholes which are targeting the western portion of Vein 013.
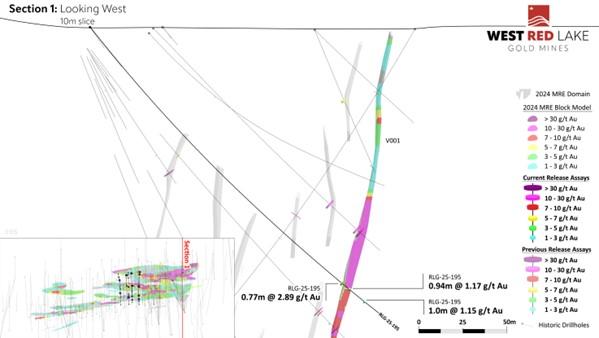
FIGURE 5. Rowan drill section showing assay highlights for Hole RLG-25-195[1].
[1] Mineral resources are estimated at a cut-off grade of 3.80 g/t Au and a gold price of US$1,800/oz. Plea se refer to the technical report entitled “Rowan Project NI 43-101 Technical Report and Preliminary Economic Assessment, Ontario, Canada”, prepared by Fuse Advisors Inc., and dated June 30, 2025. A full copy of the report is available on the Company’s website and on SEDAR+ at www.sedarplus.ca.
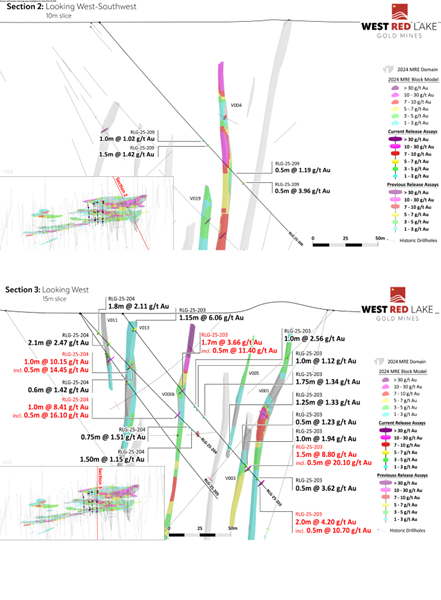
FIGURE 6. Rowan drill section showing assay highlights for Hole RLG-25-209.
FIGURE 7. Rowan drill section showing assay highlights for Hole RLG-25-203 to -20 5.
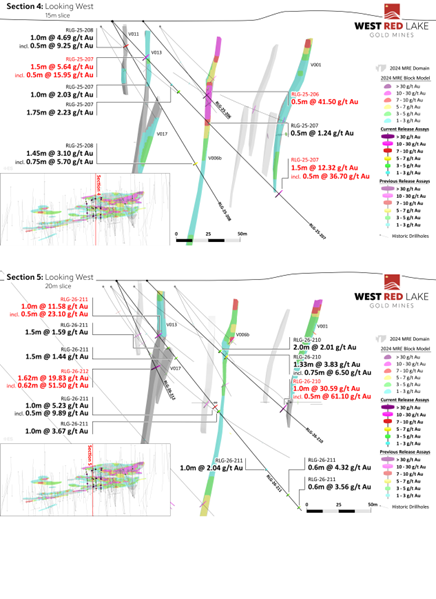
FIGURE 8. Rowan drill section showing assay highlights for Hole RLG-25-206 through -208.
FIGURE 9. Rowan drill section showing assay highlights for Hole RLG-25-210 through -212.
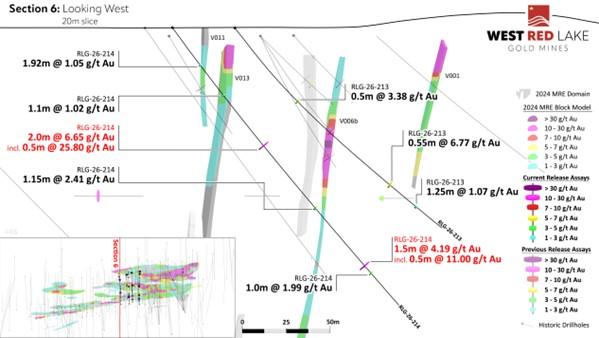
FIGURE 10. Rowan drill section showing assay highlights for Hole RLG-25-213 and -214.
ROWAN PROGRAM SUMMARY
West Red Lake Gold announced results for a Preliminary Economic Assessment for the Rowan Project on July 8, 2025 which demonstrates positive preliminary economics for an underground mine at Rowan producing an average of 35,230 ounces (“oz”) per year over a 5-year mine life at an average grade of 8.0 g/t Au (a copy of this news release can be viewed HERE1).
The drill program at Rowan (Figure 11) will now consist of around 6,300m of HQ diameter diamond drilling including conversion drilling on Veins 001 and 004 to support the potential upgrade of Inferred resources to Indicated2 and infill drilling on Veins 006b and 013 to provide data that may enable mine design consideration ahead of a planned combined Pre-Feasibility Study for the Madsen Mine and Rowan Project. This planned study will evaluate the potential for developing the two projects using shared infrastructure and integrated mine planning, with the goal of identifying possible operational and economic synergies3.
Conversion drilling2 at Rowan is focused on Veins 001 and 004, with the objective to bring Inferred resources to an Indicated category. These veins account for the majority of PEA production tonnes. Approximately 63% of the tonnes and 72% of the ounces were already in the Indicat ed category in the Rowan PEA.
Infill drilling is focused on Veins 006b and 013 to provide data for potential inclusion in the planned combined PFS. Integration of Veins 006b and 013 could not only extend mine life at Rowan, but may also allow for ore extraction to begin approximately 6 months sooner due to closer proximity to the access portal. Accessing and mining mineralization earlier at Rowan has the potential to positively impact the net present value of the project. Inclusion of Veins 006b and 013 in future mine plans and the impact such inclusion could have is subject to the results of the drill program and the outcome of the combined PFS as reviewed by a Qualified Person.
Further geotechnical, metallurgical and engineering studies are also underway at Rowan to inform the planned PFS. These studies will be completed in conjunction with ongoing permitting efforts to advance Rowan towards Advanced Exploration status, w hich is required for bulk sample extraction. Permits to support Advanced Exploration activities, including underground mine development, are targeted for 2027, subject to regulatory review and consultation.
The Advanced Exploration permit is targeted for approval in 2027, a timeline supported by the recent launch of the One Project, One Process mine permitting framework in Ontario that aims to cut review times within the mine permitting process in half for Designated Projects, a status the Company is pursuing at Rowan. 4
ADDITIONAL OPPORTUNITIES
There are multiple opportunities to potentially expand and upgrade the resource and mine plan at Rowan.
The Rowan resource comprises 26 domains that capture multiple parallel veins. Three of those veins – 001, 003 and 004 – are mined in the PEA. A fourth vein with strong gold grades, called 006b, is the third larges t contributor of tonnes and ounces in the current mineral resource estimate but was not included in the PEA mine plan because its data stems largely from historic drilling, which suffers from unsampled intervals. Vein 013 runs adjacent and sub-parallel to Vein 006b and may demonstrate similar resource upgrade potential, subject to confirmation drilling and subsequent resource estimation by a Qualified Person.
Historic operators often only sampled and assayed drill core with quartz veining containing visible gold. Surrounding rock, including vein margins, narrow gaps between veins, and adjacent wall rock, was typically not sampled. During the MRE estimation process those unsampled intervals were assigned a value of half detection limit equal to 0.0025 g/t Au. This excessively diluted those areas in the resource model, which was constructed on 2-metre minimum composites for longhole stoping design consideration. During the 2023 drill campaign, WRLG demonstrated that gold mineralization regularly persists into the altered wall rock adjacent to high-grade gold veins. Selective sampling would have missed mineralization of this type. Additionally, most of the drilling on Veins 006b and 013 is from the 1980’s utilizing very small 27-millimeter diameter AQ drill core with no existing competent historic core available for resampling. The 2025-2026 drilling program is being completed with 63.5-millimeter diameter HQ drill core and with an aim to infill the gaps in the historic analytical data set on Veins 006b and 013, with the goal of bringing these veins back into consideration for mine design.
The next layer of opportunity at Rowan is based on expanding the deposit. Notably, the highest-grade intercept ever drilled at Rowan was achieved during the 2023 drill campaign when hole RLG-23-163B returned 70.8 g/t Au over 8.3 metres. This intercept came from the deeper portion of Vein 001 and indicates potential f or mineralization to continue at depth. The Rowan vein system has only been defined down to approximately 400 metres and remains wide open for expansion at depth (Figure 12). The Rowan deposit also remains open along strike to the east and west.
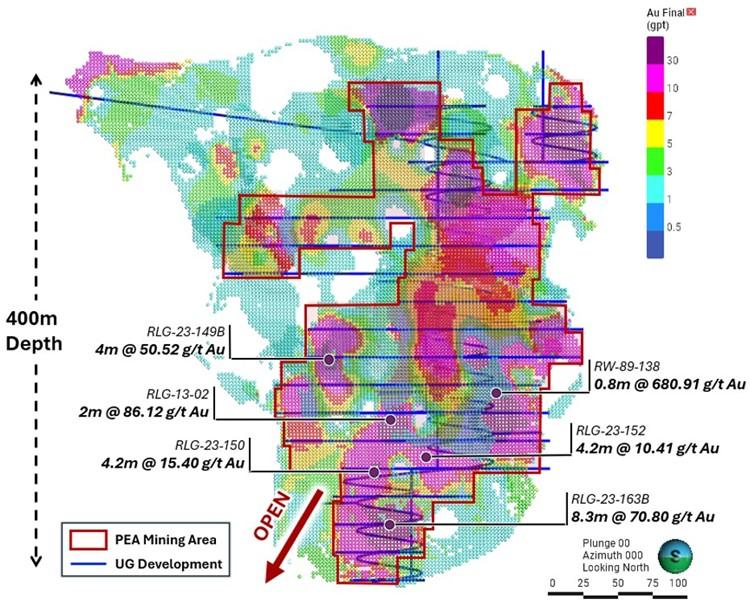
FIGURE 12. Long section of Rowan block model at 1 g/t Au cutoff showing PEA mine desig n (blue) and outline of areas planned for long hole stoping on Veins 001, 003 and 004 (red outline). Notable assay intercepts have been highlighted to indicate the strength of gold mineralization and expansion potential at depth. Intercepts are reported as core length unless otherwise stated.
QUALITY ASSURANCE/QUALITY CONTROL
Drilling completed at the Rowan Property consists of oriented HQ-sized diamond drill core. All drill holes are systematically logged, photographed, and sampled by a trained geologist at WRLG’s Mt. Jamie core processing facility. Minimum allowable sample length is 0.5m. Maximum allowable sample length is 1.5m. Standard reference materials and blanks are inserted at a targeted 5% insertion rate. The drill core is then cut lengthwise utilizing a diamond blade core saw along a line pre-selected by the geologist. To reduce sampling bias, the same side of drill core is sampled consistently utilizing the orie ntation line as reference. For those samples containing visible gold a trained geologist supervises the cutting/bagging of those samples, and ensures the core saw blade is ‘cleaned’ with a dressing stone following the VG sample interval. Bagged samples are then sealed with zip ties with additional security tags, and transported by freight courier to ALS Thunder Bay, Ontario for assay.
Samples are then prepped by ALS, which consists of drying at 105°C and crushing to 70% passing 2mm. A riffle splitter is then utilized to produce a 250g course reject for archive. The remainder of the sample is then pulverized to 85% passing 75 microns from which 50g is analyzed by fire assay and an atomic absorption spectroscopy (AAS) finish. Samples returning gold values > 100 g/t Au are reanalyzed by fire assay with a gravimetric finish on a 50g sample. Samples with visible gold are also analyzed via metallic screen analysis (ALS code: AU-SCR24). For multi -element analysis, samples are sent to ALS’s facility in Vancouver, British Columbia and analyzed via four-acid digest with a mass spectroscopy (ICP-MS) finish for 48-element analysis on 0.25g sample pulps (ALS code: ME-MS61). ALS Geochemistry analytical laboratories operate under a single Global Geochemistry Quality Manual that complies with ISO/IEC 17025:2017.
The Rowan Mine deposit presently hosts a National Instrument 43-101 – Standards of Disclosure for Mineral Projects Indicated resource of 478,707 tonnes containing 196,747 ounces of gold grading 12.78 g/t Au and an Inferred resource of 421,181 tonnes containing 118,155 oz of gold grading 8.73 g/t Au. Mineral resources are estimated at a cut-off grade of 3.80 g/t Au and a gold price of US$1,800/oz. Mineral resources that are not mineral reserves do not have demonstrated economic viability. Please refer to the technical report entitled “Rowan Project NI 43-101 Technical Report and Preliminary Economic Assessment, Ontario, Canada”, prepared by Fuse Advisors Inc., and dated June 30, 2025. A full copy of the report is available on the Company’s website and on SEDAR+ at www.sedarplus.ca.
The technical information presented in this news release has been reviewed and approved by Will Robinson, P.Geo., Vice President of Exploration for West Red Lake Gold and the Qualified Person for exploration at the West Red Lake Project, as defined by NI 43-101. Mr. Robinson is not independent of WRLG. The PEA and Mineral Resource disclosure summarized herein is derived from the independent technical report prepared by Fuse Advisors Inc.
ABOUT WEST RED LAKE GOLD MINES
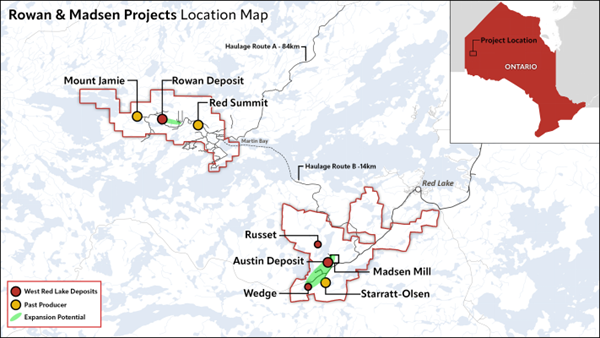
West Red Lake Gold Mines Ltd. is a gold miner development company that is publicly traded and focused on advancing and developing its flagship Madsen Gold Mine and the associated 47 km2 highly prospective land package in the Red Lake district of Ontario. The highly productive Red Lake Gold District of Northwest Ontario, Canada has yielded over 30 million ounces of gold from high-grade zones and hosts some of the world’s richest gold deposits. WRLG also holds the wholly owned Rowan Property in Red Lake, with an expansive property position covering 31 km2 including three past producing gold mines – Rowan, Mount Jamie, and Red Summit.
Foremost Clean Energy Ltd. (NASDAQ: FMST) (CSE: FAT) is pleased t... READ MORE
SAGA Metals Corp. (TSX-V: SAGA) (OTCQB: SAGMF) (FSE: 20H), a Nort... READ MORE
Rio Silver Inc. (TSX-V: RYO) (OTC: RYOOF) is pleased to announce ... READ MORE
Record Revenue, Net Income and Cash Flow from Operations Aya Gold &am... READ MORE
High-grade gold results returned from the Road Cut Zone with 7.0 ... READ MORE


