


Wellgreen Platinum Ltd. (TSX:WG) (OTCQX:WGPLF) is pleased to announce the positive results of an updated Independent Preliminary Economic Assessment on its 100%- owned Wellgreen PGM-Nickel project, located in Canada’s Yukon Territory. The new study strengthens the Company’s vision that the Wellgreen project has the potential to become one of the largest and lowest cost, open-pit platinum group metals and nickel producing mines in the world.(1) Work on the 2015 PEA was carried out in reference to the requirements of National Instrument 43-101 – Standards of Disclosure for Mineral Projects (NI 43-101), and was conducted by independent engineering firm JDS Energy & Mining Inc., under the direction of John Sagman, P.Eng., Senior Vice President and Chief Operating Officer of Wellgreen Platinum. Other contributors to the 2015 PEA were SNC- Lavalin, Knight Piesold Ltd., SRK Consulting (U.S.) Inc., Eggert Engineering Inc., and GeoSim Services Inc.
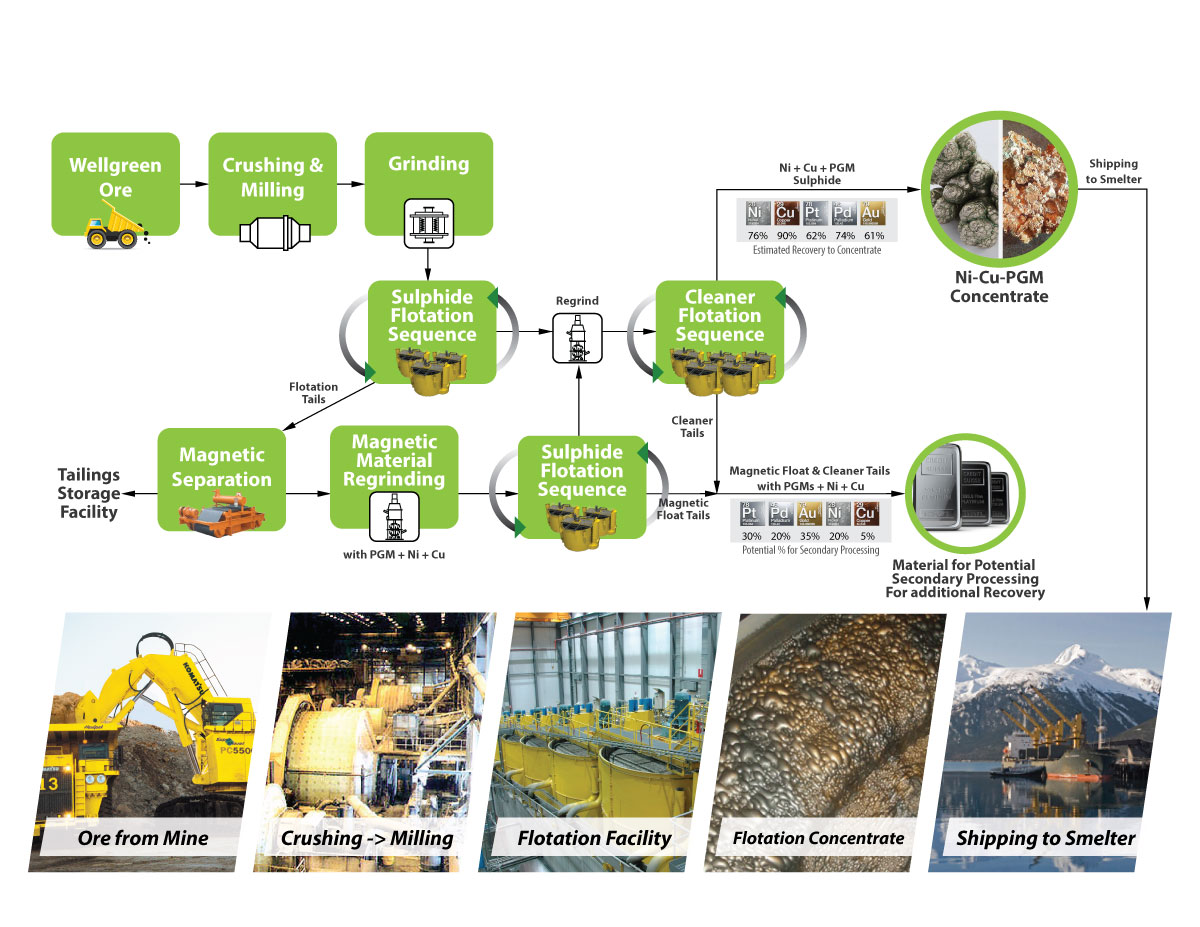
The Wellgreen project is envisioned as a conventional open pit operation, with some selective higher grade underground mining. Milling would start at 25,000 tonnes per day (tpd) for the first five years of operation, then would scale up to 50,000 tpd for an additional 20 years. Under the base case of the 2015 PEA, the mill would produce a bulk Ni-Cu-Co- PGM-Au concentrate through conventional sulphide flotation for shipping via existing deep sea ports south of the project in Alaska. It should be noted that the study also details a number of opportunities to further enhance economics (see below) and the current Mineral Resource remains open along strike and at depth.
Highlights of the 2015 PEA:
-- Average annual production of 208,880 ounces of platinum+palladium+gold
(3E) (42% Pt, 51% Pd and 7% Au), along with 73 million pounds of nickel
and 55 million pounds of copper over the first 16 years of operation at
a production grade of 1.88 g/t platinum equivalent (Pt Eq.) or 0.50%
nickel equivalent (Ni Eq.) (0.63 g/t 3E (46% Pt, 45% Pd and 8% Au),
0.27% Ni and 0.18% Cu), which equates to a net smelter return (NSR) of
CAD$38.60 per tonne milled using the base case metal price assumptions
set out below.
-- Average strip ratio of 0.75 to 1 over the 25 year base case life of mine
(LOM).
-- LOM production to average 177,536 ounces of 3E (42% Pt, 51% Pd and 7%
Au), 68 million pounds of nickel and 44 million pounds of copper per
year over 25 years with the potential to add an additional 15 years
using bulk underground mining or 31 years through additional open pit
mining of Inferred Mineral Resources.
-- Total LOM production of 4.4 million ounces of 3E (42% Pt, 51% Pd and 7%
Au), with 1.7 billion pounds of nickel and 1.1 billion pounds of copper
in concentrate from approximately 34% of the current pit constrained
Mineral Resource.
-- In terms of platinum production, based on the 2015 PEA, the Wellgreen
project could be one of the two largest platinum producing mines (along
with the Stillwater Mine in the United States) outside of South Africa
or Russia(2).
Economic Highlights: (Unless otherwise noted, all dollar amounts in this news release are in Canadian dollars (CAD$) and all figures with respect to the 2015 PEA reflect the Base Case. Base Case metal price assumptions: US$1,450/oz Pt, US$800/oz Pd, US$1,250/oz Au, US$8.00/lb Ni, US$3.00/lb Cu, US$14.00/lb Co and US$0.90 = C$1.00)
The 2015 PEA demonstrates potential robust economics that would position the Wellgreen project as one of the lowest cost PGM producers globally (see footnote 1 below), with all-in sustaining costs(3) of: (i) US$457 per ounce of 3E; and (ii) US$5.78 per pound of Ni Eq. for base metals, on a co-product basis.
-- Pre-tax net present value (NPV) of CAD$2.1 billion with a pre-tax
internal rate of return (IRR) of 32.2%, and an after-tax NPV of CAD$1.2
billion with an after-tax IRR of 24.6% at a 7.5% discount rate.
-- Average annual operating cash flow of CAD$337 million over the first 16
years and an average of CAD$301 million per year over the 25 year LOM.
-- Initial capital expenditures of CAD$586 million (including contingencies
in the amount of CAD$100 million) with expansion, sustaining and closure
capital of CAD$964 million over the LOM.
-- Payback of 2.6 years pre-tax and 3.1 years after taxes.
-- Total net smelter revenue of CAD$15.5 billion and operating cash-flow of
CAD$7.5 billion over the LOM.
Opportunities to Enhance Value not included in Base Case economics:
-- Potential to expand the mine life by an additional 15 years through a
bulk underground operation or by 31 years through additional open-pit
mining targeting the remaining 67% of the pit constrained resource in a
fifth stage open pit. The deposit remains open at depth and along trend
to further expansion.
-- Quantification of exotic PGMs (rhodium, iridium, osmium and
ruthenium)(4) production represents an opportunity as these metals occur
in concentrates produced during metallurgical testing but are not part
of the Mineral Resource Estimate and, therefore, are not included in the
economics of the PEA. Recent metallurgical testing demonstrated a 10-13%
increase in total PGMs reporting to the concentrate when exotic PGMs
were included.
-- Opportunity for increased total recovery of PGMs through secondary
processing of the flotation tails using methods such as hydrometallurgy
or direct leaching. Up to 30% of the total PGMs are believed to be
contained in the magnetic flotation and cleaner tails in the 2015 PEA
and preliminary testing of secondary processing methods by SGS Lakefield
on concentrate tails from metallurgical testing suggests potential PGM
recoveries of over 90%.
Greg Johnson, Wellgreen Platinum’s President & CEO stated, “Completion of the 2015 PEA for the Wellgreen project is a major milestone in our Company’s development. This new study highlights our belief that the Wellgreen project can become one of the world’s largest and lowest cost, open pit PGM and nickel producers located in one of the world’s best mining jurisdictions.(5) These results show a robustly economic project at conservative metal prices and an expected base case mine life of 25 years utilizing only one-third of the pit constrained mineral resources. Given the technical and socioeconomic challenges faced by PGM mines in southern Africa and Russia, which currently account for over 90% of global PGM production, the development of an open-pit amenable, road-accessible PGM and nickel project in the mining- friendly Yukon Territory represents a truly unique opportunity for our Company and our shareholders. We ended 2014 with over $10.5 million in cash on hand, and are looking forward to an exciting year of prefeasibility-level work on Wellgreen, including a significant drilling campaign and further advances with respect to metallurgy.”
John Sagman, Wellgreen Platinum’s Senior Vice President & Chief Operating Officer, noted, “The 2015 PEA demonstrates how the Wellgreen project can be developed as a phased scalable operation with modest initial capital and a rapid payback by targeting higher grade material at a low strip ratio in the open pit mine plan. The mine expansion to 50,000 tpd that is projected to be completed in years 5 and 6 is anticipated to be financed from the project’s internal cumulative cash flow. We are also excited to pursue some of the opportunities identified by the 2015 PEA that were not included in the base case economics, which include the potential to extend the mine life by up to another 31 years from existing mineral resources, the potential to increase total PGM metal recoveries with secondary processing, and pursuing recovery of the exotic PGMs: rhodium, iridium, osmium and ruthenium.”
The full 2015 PEA technical report on the Wellgreen project will be filed on SEDAR (www.sedar.com) and on Wellgreen Platinum’s website at www.wellgreenplatinum.com within 45 days of the issuance of this news release.
The 2015 PEA is preliminary in nature and includes Inferred Mineral Resources that are considered too speculative geologically to have the economic considerations applied to them that would enable them to be categorized as Mineral Reserves. There is no certainty that the preliminary economic assessment will be realized. Mineral Resources are not Mineral Reserves because they do not have demonstrated economic viability.
Wellgreen is a polymetallic deposit with mineralization that includes the platinum group metals platinum, palladium, rhodium and other exotic PGM metals along with gold, with the significant co-occurrence of nickel, copper and cobalt. Platinum equivalent and nickel equivalent values referred to in this news release are intended to reflect total metal equivalent content in platinum or nickel for all of the metals using relative prices for each of the metals. Refer to the table below for individual metal grades and the metal prices used to calculate Pt Eq. and Ni Eq. The operating cash flow contribution from precious metals is expected to be higher at some times, with it being higher for nickel at other times, depending on prevailing market prices. As such, precious metals and base metals are treated as co-products.
(1) See "GFMS Platinum and Palladium Survey 2014" published by Thomson
Reuters.
(2) Based on the most recent production figures set out in the 2013 Annual
Report of Stillwater Mining Company.
(3) All-in sustaining costs are per payable ounce and use World Gold Council
guidelines, which are non-GAAP measures that have no standardized
meaning and may not be comparable to similar measures presented by other
issuers.
(4) At the time of this news release, the approximate market prices for
these were US$1,145/oz rhodium, US$540/oz iridium, US$400/oz osmium, and
US$56/oz ruthenium.
(5) See "2014 Ranking of Countries for Mining Investment: Where Not to
Invest" by Behre Dolbear, Minerals Industry Advisors, and The Fraser
Institute's "2014 Survey of Mining Companies".
Mineral Resource Estimate
The 2015 PEA is based on a Mineral Resource Estimate that was prepared by Ron Simpson, P.Geo., of GeoSim Services Inc., an independent Qualified Person, and by John Sagman, P.Eng., Wellgreen Platinum’s Senior Vice President and Chief Operating Officer, a Qualified Person, in accordance with NI 43-101. The Mineral Resource Estimate was derived from 776 drill holes totaling 69,898 metres which have tested approximately 2.5 kilometres of an 18 kilometre long system.
The estimate consists of 330 million tonnes at 1.67 g/t Pt Eq. or 0.44% Ni Eq. (please refer to the tables below for detailed grades by metal and the metal prices used to calculate metal equivalents) at a 0.57 g/t Pt Eq. cut -off or 0.15% Ni Eq. cut- off in a pit constrained resource containing 5.53 million ounces of 3E (platinum+palladium+gold) with 1,894 million pounds of nickel and 1,021 million pounds of copper in the Measured & Indicated Mineral Resource categories. The Mineral Resource Estimate further consists of 846 million tonnes at 1.57 g/t Pt Eq. or 0.41% Ni Eq. at a 0.57 g/t Pt Eq. cut-off or 0.15% Ni Eq. cut-off in a pit constrained resource containing 13.8 million ounces of 3E (platinum+palladium+gold) with 4,431 million pounds of nickel and 2,595 million pounds of copper in the Inferred Mineral Resource category.
Mineral Resource Estimate by Category – At a 0.57 g/t Pt Eq. or 0.15% Ni Eq. Cut-off (Base Case)
----------------------------------------------------------------------------
Tonnes 3E Pt Pd Au Pt Eq. Ni Eq.
Category 000s g/t g/t g/t g/t Ni % Cu % Co % g/t %
----------------------------------------------------------------------------
Measured 92,293 0.550 0.252 0.246 0.052 0.260 0.155 0.015 1.713 0.449
Indicated 237,276 0.511 0.231 0.238 0.042 0.261 0.135 0.015 1.656 0.434
----------------------------------------------------------------------------
Total M&I 329,569 0.522 0.237 0.240 0.045 0.261 0.141 0.015 1.672 0.438
----------------------------------------------------------------------------
Inferred 846,389 0.507 0.234 0.226 0.047 0.237 0.139 0.015 1.571 0.412
----------------------------------------------------------------------------
Within the global pit constrained Mineral Resource is a significantly higher grade component grading 2.49 g/t Pt Eq. or 0.65% Ni Eq. containing 2.1 million ounces of 3E Measured & Indicated Resources with an additional Inferred Mineral Resource grading 2.41 g/t Pt Eq. or 0.63% Ni Eq. containing 5.1 million 3E ounces, which is targeted in the early part of the mine life.
Mineral Resource Estimate by Category – At a 1.9 g/t Pt Eq. or 0.50% Ni Eq. Cut-off
----------------------------------------------------------------------------
Tonnes 3E Pt Pd Au Pt Eq. Ni Eq.
Category 000s g/t g/t g/t g/t Ni % Cu % Co % g/t %
----------------------------------------------------------------------------
Measured 21,854 0.923 0.454 0.366 0.103 0.326 0.301 0.019 2.492 0.653
Indicated 50,264 0.919 0.455 0.373 0.090 0.334 0.286 0.019 2.493 0.653
----------------------------------------------------------------------------
Total M&I 72,117 0.920 0.455 0.371 0.094 0.332 0.291 0.019 2.493 0.653
----------------------------------------------------------------------------
Inferred 173,684 0.906 0.456 0.352 0.098 0.309 0.301 0.018 2.410 0.631
----------------------------------------------------------------------------
Notes:
1. Mineral Resource Estimate prepared by GeoSim Services Inc. with an
effective date of July 23, 2014.
2. Measured Mineral Resources used 50 metre drill spacing. Indicated Mineral
Resources used 50 metre drill spacing for massive sulphide and gabbro
domains, and 100 metre drill spacing for clinopyroxenite and peridotite
domains.
3. Nickel equivalent (Ni Eq. %) and platinum equivalent (Pt Eq. g/t)
calculations reflect total gross metal content using US$ of $8.35/lb Ni,
$3.00/lb Cu, $13.00/lb Co, $1,500/oz Pt, $750/oz Pd and $1,250/oz Au and
have not been adjusted to reflect metallurgical recoveries.
4. Pit constrained grade shells were determined using the following
assumptions: metal prices in Note 3 above; a 45 degree pit slope; assumed
metallurgical recoveries of 70% for Ni, 90% for Cu, 64% for Co, 60% for
Pt, 70% for Pd and 75% for Au; an exchange rate of CAD$1.00=USD$0.91; and
mining costs of $2.00 per tonne, processing costs of $12.91 per tonne,
and general & administrative charges of $1.10 per tonne (all expressed in
Canadian dollars).
5. Totals may not add up due to rounding.
6. Mineral Resources are not Mineral Reserves and do not have demonstrated
economic viability.
For further details, please see Wellgreen Platinum’s news release of July 24, 2014 and the corresponding NI 43-101 Technical Report entitled “2014 Mineral Resource Estimate on the Wellgreen PGM-Ni-Cu Project”, dated effective September 8, 2014, which is available under Wellgreen Platinum’s SEDAR profile at www.sedar.com.
2015 Preliminary Economic Assessment Study
The 2015 PEA was completed using independent engineering and consulting firms who have experience with mine operations and projects located in the Yukon Territory and the design of mineral processing systems associated with base metals and precious metals. The PEA was compiled by JDS Energy and Mining Inc. with significant contributions from the Qualified Persons acknowledged in the PEA Contributors section of this news release.
The 2015 PEA envisions a 25 year LOM plan consisting of a four stage open pit operation with an overall waste-to- mineralized-material strip ratio of 0.75 to 1, and selective underground mining of higher grade zones within the pit constrained Mineral Resource. Pre-production capital expenditures are estimated to be CAD$586 million for the initial open pit mine with a 25,000 tpd mill (including a contingency of CAD$100 million). The LOM plan envisions expansion of the mill to 50,000 tpd in year six. Underground mining of higher grade zones near existing underground workings using ramp access is projected to take place from years three through eight using open stoping and post pillar cut and fill mining.
Under the LOM plan, lower grade material will be stockpiled and processed in years 17 through 25. The mine life could be extended by another 15 or 31 years through bulk underground development or with the development of a fifth stage open pit, respectively, from the existing Mineral Resource. Mill processing will consist of conventional sulphide flotation to produce a bulk concentrate containing nickel, copper, PGMs, gold and cobalt that could be processed by one of at least seven smelters globally.
Economics
The reader is advised that the 2015 PEA is preliminary in nature and includes Inferred Mineral Resources that are considered too speculative geologically to have the economic considerations applied to them that would enable them to be categorized as Mineral Reserves. There is no certainty that the preliminary economic assessment will be realized. Mineral Resources are not Mineral Reserves because they do not have demonstrated economic viability. There is no guarantee that Inferred Mineral Resources will be converted to the Measured and Indicated Mineral Resource categories and, therefore, there is no guarantee that the project economics described herein will be achieved.
----------------------------------------------------------------------------
Peer Long Term
Metals & FX Base Case Consensus
Assumptions Units Base Case Prices(2) Forecast(3) Spot(1)
----------------------------------------------------------------------------
Platinum US$/oz $1,450 $1,642 $1,450 $1,206
----------------------------------------------------------------------------
Palladium US$/oz $800 $775 $950 $811
----------------------------------------------------------------------------
Gold US$/oz $1,250 $1,350 $1,148 $1,206
----------------------------------------------------------------------------
Nickel US$/lb $8.00 $8.34 $8.74 $6.77
----------------------------------------------------------------------------
Copper US$/lb $3.00 $3.21 $3.18 $2.88
----------------------------------------------------------------------------
Cobalt US$/lb $14.00 $14.00 $12.93 $14.51
----------------------------------------------------------------------------
Exchange
Rate(4) CAD$/US$ 0.900 0.930 0.877 0.862
----------------------------------------------------------------------------
----------------------------------------------------------------------------
Peer Long Term
Base Case Consensus
Summary Economics Units Base Case Prices(2) Forecast(3) Spot(1)
----------------------------------------------------------------------------
Pre-tax NPV CAD$
(7.5%) millions $2,067 $2,300 $2,959 $1,251
----------------------------------------------------------------------------
After-tax NPV CAD$
(7.5%) millions $1,193 $1,335 $1,737 $690
----------------------------------------------------------------------------
Pre-tax NPV (5%) CAD$
millions $2,890 $3,187 $4,049 $1,829
----------------------------------------------------------------------------
After-tax NPV CAD$
(5%) millions $1,721 $1,904 $2,431 $1,067
----------------------------------------------------------------------------
Pre-tax NPV CAD$
(10.0%) millions $1,496 $1,684 $2,202 $852
----------------------------------------------------------------------------
After-tax NPV CAD$
(10.0%) millions $827 $941 $1,256 $430
----------------------------------------------------------------------------
Pre-tax IRR % 32.2% 35.1% 41.4% 23.3%
----------------------------------------------------------------------------
Post-tax IRR % 24.6% 26.4% 30.8% 18.0%
----------------------------------------------------------------------------
Payback period,
before taxes years 2.6 2.4 2.0 6.1(5)
----------------------------------------------------------------------------
Payback period,
after taxes years 3.2 2.9 2.5 6.9(5)
----------------------------------------------------------------------------
(1)Spot prices at December 31, 2014.
(2) Mean base case prices used by peers based on SEDAR filings over the past
one year period.
(3) Consensus analyst metal estimates for 2018 (2016 for cobalt) from
Bloomberg as at January 19, 2015.
(4) FX based on 3-year average noon rates from the Bank of Canada on January
19, 2015.
(5) The payback period is extended due to mine expansion; however, if
expansion is deferred, the payback period would be approximately one
year shorter.
Base Case Production and Cash Flows
----------------------------------------------------------------------------
Average Average
Annual Years Annual Life
Units 1-16(1) of Mine(1) Total LOM(1)
----------------------------------------------------------------------------
Net smelter revenue CAD$ millions $687 $620 $15,494
----------------------------------------------------------------------------
Net operating income CAD$ millions $337 $301 $7,513
----------------------------------------------------------------------------
Annual pre-tax cash flow CAD$ millions $285 $264 $6,593
----------------------------------------------------------------------------
Annual post-tax cash
flow CAD$ millions $188 $174 $4,341
----------------------------------------------------------------------------
Average Annual Metals Produced in Concentrate
----------------------------------------------------------------------------
Platinum ounces 89,518 74,019 1,850,479
----------------------------------------------------------------------------
Palladium ounces 103,471 90,413 2,260,331
----------------------------------------------------------------------------
Gold ounces 15,890 13,103 327,578
----------------------------------------------------------------------------
3E (Platinum + Palladium
+ Gold) ounces 208,880 177,536 4,438,388
----------------------------------------------------------------------------
Nickel Millions of
pounds 73.1 68.4 1,709.7
----------------------------------------------------------------------------
Copper Millions of
pounds 55.3 44.5 1,111.3
----------------------------------------------------------------------------
Cobalt Millions of
pounds 3.4 3.3 82.0
----------------------------------------------------------------------------
(1) Not including pre-production years.
Capital Expenditures (including contingency)
The pre-production capital cost of the project infrastructure and development indirect costs is projected to be CAD$586.2 million, including CAD$100.3 million of contingencies. Additional expansion and sustaining capital of CAD$889.4 million are estimated for the remainder of the LOM. Expansion and sustaining capital includes expenditures for the underground development program.
----------------------------------------------------------------------------
CAD$
Pre-production Capital Expenditures - LOM (millions)
----------------------------------------------------------------------------
Direct Costs
----------------------------------------------------------------------------
Open Pit Equipment & Pre-Stripping 74.9
----------------------------------------------------------------------------
Site Development 36.8
----------------------------------------------------------------------------
Processing Plant 154.2
----------------------------------------------------------------------------
Site Infrastructure 89.7
----------------------------------------------------------------------------
Tailings Storage Facility 45.2
----------------------------------------------------------------------------
Total Direct 400.9
----------------------------------------------------------------------------
Indirect Costs 45.2
----------------------------------------------------------------------------
EPCM 30.2
----------------------------------------------------------------------------
Owner's Costs 9.6
----------------------------------------------------------------------------
Contingency 100.3
----------------------------------------------------------------------------
Total pre-production capital expenditures 586.2
----------------------------------------------------------------------------
Expansion, Sustaining and Closure Capital
Expenditures - LOM
----------------------------------------------------------------------------
Expansion & sustaining capital expenditures 889.4
----------------------------------------------------------------------------
Closure costs 75.0
----------------------------------------------------------------------------
Total LOM capital expenditures 1,550.6
----------------------------------------------------------------------------
The underground operating development and capital expenditures (included in the expansion and sustaining capital) are summarized in the following table:
----------------------------------------------------------------------------
Operating
Development Capital
CAD$ (millions) CAD$ (millions)
----------------------------------------------------------------------------
Lateral 45.5
----------------------------------------------------------------------------
Vertical 5.8 0.3
----------------------------------------------------------------------------
Sumps & Pumping 9.8
----------------------------------------------------------------------------
Satellite Garage and Fuel Systems 1.8
----------------------------------------------------------------------------
Backfill System 3.2
----------------------------------------------------------------------------
Magazines, Refuge Stations 1.8
----------------------------------------------------------------------------
Ventilation 6.1
----------------------------------------------------------------------------
Electrical 4.3
----------------------------------------------------------------------------
Sub-Total Direct 51.3 27.2
----------------------------------------------------------------------------
Indirects (Engineering, Freight, Spare
Parts) 0.8 4.9
----------------------------------------------------------------------------
Contingency 4.9
----------------------------------------------------------------------------
Total 52.1 37.0
----------------------------------------------------------------------------
Operating Expenditures
The LOM operating costs (which include pre-production processing) are summarized below:
----------------------------------------------------------------------------
CAD$/tonne CAD$/tonne
Operating Costs mined processed
----------------------------------------------------------------------------
Open Pit Mining 2.16 3.65
----------------------------------------------------------------------------
Underground 54.59 1.29
----------------------------------------------------------------------------
Rehandle 0.75 0.31
----------------------------------------------------------------------------
Processing 13.64
----------------------------------------------------------------------------
General & Administrative 0.99
----------------------------------------------------------------------------
Total operating cost 19.88
----------------------------------------------------------------------------
Net Smelter Return Value 38.60
----------------------------------------------------------------------------
Mining
The 2015 PEA recommends development of the Wellgreen deposit as a conventional truck and shovel open pit mine with selective underground mining of higher grade zones using open stoping and post pillar cut and fill mining. The PEA mine plan focuses on accessing and mining higher grade material early in the mine life, with stockpiling of lower grade material in the first 16 years, with the stockpiles then being processed in years 17 through 25. The mill is expected to have a nominal production rate of 25,000 tonnes of mill feed per day in the first five years, increasing to 50,000 tpd in year six for twenty years, with an average waste-to-mineralized material strip ratio estimated at 0.75 to 1 over the life of mine under the base case.
One of the key observations from extensive metallurgical work conducted on the Wellgreen project was that the optimization of sulphide flotation recovery varied based on the three major geological domains. In general, the recovery of economic metals is highest from the Gabbro domain, followed by the Clinopyroxenite/Pyroxenite domain and then by the Peridotite domain. Testing has shown that the material from each domain can be processed in the same circuit with variances related to grind size, conditioning time, pH and the use of magnetic separation, with the majority of reagent selection applied across all the domains. For further detail, see Wellgreen Platinum’s news release dated September 3, 2014.
Given the different metallurgical performance of the geological domains, the mine plan in the 2015 PEA was designed to access higher grade material as the initial mill feed and incorporates a stockpiling strategy whereby lower grade material is stockpiled and processed by the mill in the last eight years of the LOM plan. The mill production feed is estimated to be comprised of 99% of material from the Gabbro and Clinopyroxenite/Pyroxenite domains during the first 16 years of operation and lower grade material, estimated to contain about 24% of material from the Peridotite domain, which would be stockpiled and processed after mining is completed in year 16. Under the mine life expansion opportunities, up to an additional thirty one years could be added to the mine plan with a fifth stage of open pit with 75% of the materials being Gabbro and Clinopyroxenite/Pyroxenite, and the remaining 25% being Peridotite.
2015 PEA Base Case Mill Feed Tonnage by Geological Domain
----------------------------------------------------------------------------
PEA Base Case
----------------------------------------------------------------------------
5th Stage
Geological Domain First 16 years Life of Mine Pit
----------------------------------------------------------------------------
Gabbro 11% 8% 2%
----------------------------------------------------------------------------
Clinopyroxenite/Pyroxenite 88% 83% 73%
----------------------------------------------------------------------------
Peridotite 1% 10% 25%
----------------------------------------------------------------------------
Total Mill Feed(i) 100% 100% 100%
----------------------------------------------------------------------------
(i) Totals may not add due to rounding
The majority of open pit mining costs were calculated from first principles based on equipment required and include pit and dump operations, road maintenance, mine supervision and technical services cost. The average open pit operating costs for the LOM plan (which includes pre-production mining) are provided in the table below:
----------------------------------------------------------------------------
Average Cost
per Tonne
Mined
Function (CAD$/t)
----------------------------------------------------------------------------
Drilling & Blasting 0.45
----------------------------------------------------------------------------
Loading 0.16
----------------------------------------------------------------------------
Hauling 0.93
----------------------------------------------------------------------------
Dozing 0.20
----------------------------------------------------------------------------
Other 0.43
----------------------------------------------------------------------------
Total Open Pit Operating Cost (not including rehandle) 2.16
----------------------------------------------------------------------------
The 2015 PEA assumes that underground mining will be performed by contractors who will provide mobile equipment and personnel. Underground development would commence with rehabilitation of the existing adit access followed by development of two 5 metre x 5 metre ramps. Mineralized material will be extracted predominantly using open stoping with hydraulic fill and post pillar cut and fill. The average underground operating costs for the LOM plan are provided in the table below:
----------------------------------------------------------------------------
Average Cost
per Tonne
Underground Mining Method Mined(CAD$/t)
----------------------------------------------------------------------------
Post Pillar Cut and Fill 54.45
----------------------------------------------------------------------------
Open Stoping 48.40
----------------------------------------------------------------------------
Mineral Processing and Metallurgical Testing
The recoveries of metals to concentrate and concentrate grade assumptions used in the 2015 PEA are based on a combination of metallurgical testing programs conducted between 1988 and 2014. Laboratory scale testing in 2013 and 2014 was performed by SGS and XPS under the supervision of an independent metallurgical consultant and Qualified Person, John Eggert, P.Eng. of Eggert Engineering Inc., with review and consultation by Dr. David Dreisinger. These test programs evaluated the effect of factors such as grind size, pH, conditioning, the use of various collectors, flotation reagents, dispersants and depressants on mineral recoveries and concentrate grades, magnetic separation and modifications to the mineral processing flowsheet.
Recovery-grade curves for each geological domain have been developed for platinum, palladium, gold, nickel, copper and cobalt using data from 183 batch tests and 12 locked cycle tests (LCTs) on 26 representative samples from the deposit. The recovery grade curves used linear regression to generate an equation to calculate recovery to concentrate by metal for each geological domain based on a normalized nickel grade. Analysis of the test results indicated that recoveries were typically higher in LCTs than in batch tests, so adjustments were made to the linear regression equations to adjust batch test results upwards to reflect recoveries that are expected to be achieved in future LCTs and pilot plant testing. The table below provides the recoveries to bulk concentrate by geological domain for a bulk concentrate grading 6% nickel. On this basis, the concentrates produced through conventional sulphide flotation are anticipated to grade 6-10% nickel, with 4-8% copper and 11-18 g/t 3E.
Estimated Metal Recoveries by Geological Domain
----------------------------------------------------------------------------
Recovery to Bulk Concentrate
----------------------------------------------------------------------------
Geological Domain Ni Cu Co Pt Pd Au
----------------------------------------------------------------------------
Gabbro 83.6% 94.5% 67.9% 73.0% 77.0% 66.8%
----------------------------------------------------------------------------
Clinopyroxenite/Pyroxenite 75.0% 88.4% 64.4% 59.0% 73.0% 58.9%
----------------------------------------------------------------------------
Peridotite(1) 68.1% 65.1% 54.9% 50.8% 56.5% 58.8%
----------------------------------------------------------------------------
Average Mill Recoveries
-First 16 Years of LOM 75.2% 88.5% 63.8% 60.5% 72.1% 60.0%
----------------------------------------------------------------------------
(1) It must be noted that there has been limited testing of the peridotite
metallurgical domains and, therefore, positive or negative variances may
occur.
Preliminary testing of various leaching methods indicates that a PGM concentrate or tails from the magnetic flotation and cleaner tails may be amenable to additional secondary processing, potentially adding to the recovery of PGMs. Additional metallurgical testing will further evaluate secondary processing options and the associated economics, potentially including recovery of exotic PGMs, rhodium, osmium, iridium and ruthenium. Historical results indicated total PGM grades in mineralized material that were 10-25% higher if the exotic PGMs rhodium, iridium and osmium were included. These exotic PGMs were recovered in concentrates by HudBay in the 1970s and consistently show up in the metallurgical testwork but have not been included in the base case economics.
Mineral Processing operating expenditures are summarized as follows:
----------------------------------------------------------------------------
25,000 tpd 50,000 tpd
(CAD$/t milled) (CAD$/t milled)
----------------------------------------------------------------------------
Labour 0.84 0.48
----------------------------------------------------------------------------
Power 4.16 4.16
----------------------------------------------------------------------------
Consumables 8.95 8.95
----------------------------------------------------------------------------
Total 13.95 13.60
----------------------------------------------------------------------------
General Administration
The G&A expenditures include management and site technical personnel as well as equipment. The unit expenditures are summarized as follows:
----------------------------------------------------------------------------
25,000 tpd 50,000 tpd
CAD$/t milled CAD$/t milled
----------------------------------------------------------------------------
Labour 0.50 0.31
----------------------------------------------------------------------------
Equipment 0.12 0.10
----------------------------------------------------------------------------
Materials 0.05 0.04
----------------------------------------------------------------------------
Expenses 0.39 0.27
----------------------------------------------------------------------------
Services 0.60 0.20
----------------------------------------------------------------------------
Total 1.66 0.91
----------------------------------------------------------------------------
Project Infrastructure
The 2015 PEA envisions the construction of the following key infrastructure items that are included in the capital cost estimates:
Power
The initial power draw of the Wellgreen project is expected to be 36 Megawatts in year one, with expansion to 69 Megawatts by year three of production in order to provide power for underground ventilation, open pit electric equipment and surface infrastructure. Power for the site could be generated by liquefied natural gas (LNG) sourced from Alaska- based Northern Lights Energy or western Canada-based Ferus, per memoranda of understanding (MOUs) signed in 2014. Wellgreen Platinum has also signed an MOU with General Electric Canada (GE) for the electrical infrastructure technology for the mine processing equipment, transmission technology and control & automation equipment. GE has recommended an initial installation of nine Jenbacher J624 LNG generators with gradual expansion to seventeen 17 units by year six. Based on these recommendations, the 2015 PEA assumes a cost of CAD$0.14/kWh for long-term power supply. Future connection to the Yukon electric grid may represent an opportunity to further reduce power costs.
Access and Concentrate Transport
Concentrate would be transported by diesel truck from the milling facility to existing deep sea ports south of the project in Alaska, at approximate trucking distances of between 380 kilometres and 475 kilometres. Improvements to the existing 14 kilometre all-season access road from the Alaska Highway to the project and tailings storage facility will be required to facilitate project construction and to handle the transport of concentrates.
Other Site Infrastructure
Site infrastructure required includes items such as a tailings management facility, water diversion channels, process plant support facilities, stockpiles, workshops, camps, concentrate filter plants, potable and waste water treatment plants, bulk explosives storage and magazines, bulk fuel storage, warehouse, and office complexes.
Market Studies and Contracts
Wellgreen Platinum is currently contemplating a conventional flotation flowsheet that results in the production of a bulk concentrate containing PGMs, gold, nickel, copper and cobalt that would be sent to a nickel sulphide smelter. There are at least seven large nickel smelters globally that could process the bulk concentrate from Wellgreen: Jinchuan and Jilin Jien in China; Xstrata Nickel and Vale in Sudbury, Canada; Stillwater in the United States; Kalgoorlie in Australia; and Boliden Harjavalta in Finland. These smelters are believed to be processing concentrates with average combined Ni -Cu-Co grades ranging from 8% to 21%. Wellgreen’s concentrate is expected to have combined Ni-Cu-Co grades near the middle of this range with low levels of deleterious elements, so the concentrate should be readily marketable. The ability to market Wellgreen’s bulk Ni-Cu-PGM concentrate will be driven by industry demand at the time of production.
The base case concentrate terms used in the 2015 PEA are conceptual in nature and are based on information from other nickel projects or contracts. Actual smelter terms could vary considerably from those used in the PEA and could have a significant positive or negative economic impact on the Wellgreen project.
Future work will also continue to evaluate the production of separate nickel and copper concentrates, in case better concentrate terms are available for separate concentrates instead of a single bulk concentrate.
Environment, Reclamation and Stakeholder Engagement
In 2013, Wellgreen Platinum initiated comprehensive environmental baseline studies, building on the environmental studies that have been ongoing since 2011 with the aim of completing an Environmental Impact Statement for submission in advance of permitting. Wellgreen Platinum will be seeking the input and involvement of the Kluane First Nation in the design and implementation of these baseline studies and is committed to working with stakeholders to ensure the best approach for the Wellgreen project’s development. A closure and reclamation plan will be prepared for the project proposal submission. Financial assurance must be posted to secure the closure and reclamation works. In the 2015 PEA, the estimate for the closure cost is projected to be CAD$75 million, including a 25% contingency of CAD$15 million, and is based on the owner-operator closing the mine and completing the reclamation activities. The Government of Yukon will determine the amount and form of security to be provided.
It is estimated in the 2015 PEA that the Wellgreen project could create about 200 new direct jobs at full production, additional indirect spin off jobs, and will have a positive effect on the local and regional economy. The mechanized nature of the proposed mining at Wellgreen will mean a significant reliance on skilled workers, with remuneration expected to reflect these high quality positions. Should the Wellgreen project proceed, there will be significant opportunities for training, particularly for local and indigenous people, and a corresponding expansion of the local economy.
Next Steps in 2015
During 2015, Wellgreen Platinum is planning to proceed with the following initiatives in support of advancing the project to a Pre-Feasibility level:
-- Complete additional drilling within the pit models to further upgrade
Inferred Mineral Resources to Measured & Indicated Mineral Resources, to
test down dip extension of mineralization within the pit where it is
unclassified, and to test select high priority targets along strike
which may add economic value to the project.
-- Complete additional metallurgical test programs in order to further
optimize recoveries from the main geo-metallurgical domains, including
more detailed testing and assessment of potential secondary processing
options as well as recovery of the exotic PGMs rhodium, osmium, iridium
and ruthenium.
-- Development of a more detailed understanding of concentrate
characteristics, potential markets and processing terms.
-- Complete advanced engineering on surface infrastructure, power, tailings
storage, underground and open pit mining and offsite infrastructure.
-- Conduct additional geotechnical work to further optimize pit slopes and
underground mine design.
-- Complete additional water quality, water balance, hydrogeology,
hydrology studies to refine the understanding of potential water use,
management and treatment.
-- Conduct additional environmental and socio-economic assessment studies
and reviews in order to commence the Yukon's Environmental Assessment
process.
-- Continue engagement and collaboration process with First Nation and
local communities regarding the Wellgreen project.
2015 PEA Contributors
The following companies have undertaken work in preparation of the 2015 PEA on the Wellgreen project:
-- JDS Energy & Mining Inc. - Lead Author, Overall Mine and Project Design
-- SNC-Lavalin Inc. - Underground and Open Pit Mine Design
-- Knight Piesold Ltd. - Tailings Storage Facility
-- SRK Consulting (U.S.) Inc. - Open Pit Geotechnical Stability
-- Eggert Engineering Inc. - Mineral Processing and Metallurgy
-- GeoSim Services Inc. - Mineral Resource Estimation
About Wellgreen Platinum
Wellgreen Platinum Ltd. is a Canadian mining exploration & development company focused on the active advancement of its 100% owned Wellgreen PGM-nickel project toward production. Located in the Yukon Territory, Canada, the Wellgreen project has the potential, in management’s view, to become one of the world’s largest and lowest cost open pit producers of platinum group metals (PGMs) and nickel. The Wellgreen property is accessed from the paved Alaska Highway leading to deep sea ports south of the project in Alaska.
The Company is led by a highly-experienced management team with a track record of value creation through successful large scale project discovery, development, operation and financing. To achieve our vision of developing into a global producer of PGMs and nickel, our primary strategy is to continue to advance the Wellgreen project towards feasibility and production.
Elevation Gold Mining Corporation (TSX-V: ELVT) (OTCQB: EVGDF) i... READ MORE
Reunion Gold Corporation (TSX-V: RGD; OTCQX: RGDFF) is pleased to announ... READ MORE
Puma Exploration Inc. (TSX-V: PUMA) (OTCQB: PUMXF) is thrilled to... READ MORE
Grid Metals Corp. (TSX-V:GRDM) (OTCQB:MSMGF) is pleased to announ... READ MORE
Azimut Exploration Inc. (TSX-V: AZM) (OTCQX: AZMTF) is pleased ... READ MORE


