








Wallbridge Mining Company Limited (TSX: WM) (OTCQB: WLBMF) is pleased to announce final assay results from seven holes completed during the 2026 metallurgical drilling program at the Fenelon Gold Project. These results provide further confidence in the geological and grade continuity of the deposit while delivering the high quality of sample material needed to better characterize gold recovery characteristics and metallurgical performance across the Fenelon deposit. The drilling targeted areas considered for underground mining in the March 2025 Preliminary Economic Assessment and provided representative samples for metallurgical characterization and variability testing in support of the Pre-feasibility Study currently underway.
HIGHLIGHTS*
| FAL-26-001 | 52.30 g/t Au over 2.1 m | Including 67.97 g/t Au over 1.6 m | |
| 6.49 g/t Au over 2.8 m | Including 12.50 g/t Au over 0.8 m | ||
| 4.96 g/t Au over 3.1 m | |||
| FAL-26-002A | 2.84 g/t Au over 6.4 m | Including 10.51 g/t Au over 1.2 m, and 4.54 g/t Au over 0.5 m | |
| 6.43 g/t Au over 7.3 m | Including 16.80 g/t Au over 2.0 m, and 19.40 g/t Au over 0.5 m | ||
| 8.27 g/t Au over 16.4 m | Including 20.10 g/t Au over 1.0 m, 32.16 g/t Au over 1.1 m, 7.72 g/t Au over 6.9 m, and 11.34 g/t Au over 1.4 m |
||
| FAL-26-003 | 3.18 g/t Au over 3.8 m | Including 8.33 g/t Au over 1.1 m | |
| 5.21 g/t Au over 6.0 m | Including 10.23 g/t Au over 1.3 m, and 19.70 g/t Au over 0.6 m | ||
| 25.41 g/t Au over 3.6 m | Including 17.80 g/t Au over 0.6 m, and 63.90 g/t Au over 1.0 m, and 8.46 g/t Au over 2.0 m | ||
| FAL-26-004 | 6.18 g/t Au over 2.0 m | ||
| 11.81 g/t Au over 3.6 m | Including 46.30 g/t Au over 0.8 m | ||
| 9.89 g/t Au over 2.0m | |||
| FAL -26-005 | 4.03 g/t Au over 4.0 m | Including 10.42 g/t Au 1.3 m | |
| 9.73 g/t Au over 2.2 m | Including 13.17 g/t Au 1.5 m | ||
| 10.67 g/t Au over 5.0 m | Including 21.30 g/t Au 2.0 m, and 4.51 g/t Au over 2.0 m | ||
| FAL-26-006 | 9.47 g/t Au over 2.4 m | ||
| 19.88 g/t Au over 2.0 m | |||
| FAL-26-007 | 25.91 g/t Au over 1.6 m | ||
| * True widths are estimated to be 70-90% of the reported core interval lengths. | |||
“The results from the 2026 metallurgical drilling campaign underscore the strength and continuity of gold mineralization within the areas of the Fenelon deposit contemplated for underground mining in the conceptual PEA mine plan,” said Brian Penny, CEO of Wallbridge. “While these holes were drilled primarily to provide representative material for metallurgical testing, they returned multiple significant gold intercepts, including several higher-grade intervals outside the current mineral resource estimate as well as within zones specifically targeted for metallurgical testing. These results provide further confidence in the geological and grade continuity of the deposit while delivering the high quality of sample material needed to better characterize gold recovery characteristics and metallurgical performance across Fenelon as we advance the project toward its next major milestone, completion of the PFS in late 2027 or early 2028.”
2026 Metallurgical Drilling and Testing Program
The 2026 metallurgical testing program is a key component of the Fenelon PFS. The program is designed to characterize metallurgical variability and gold recovery performance across the portions of the Fenelon deposit contemplated in the March 2025 PEA. In particular, the testwork will evaluate whether recovery characteristics within areas of the mineral resource contemplated for underground mining may vary materially across different grade ranges and mining periods during the first 15 years of the 16-year PEA life-of-mine plan. The testing program will involve trade-off evaluations comparing gold recoveries from three alternative mineral processing methods including whole ore leach, whole ore leach with carbon, and flotation. Additional tests will be performed to evaluate the suitability of residual tailings material for post-processing dry stack storage as contemplated in the PEA. The results will be used to support the selection of appropriate recovery assumptions, processing parameters, and tailings management criteria for the PFS.
The Company has engaged Synectiq Inc. an independent mining consultancy headquartered in Longueuil, Québec, to design and manage the metallurgical testing program, with Base Metallurgical Laboratories Ltd. located in Kamloops, British Columbia, retained to complete the test work program under Synectiq’s direction.
Seven dedicated HQ-diameter diamond drill holes totaling 3,144 metres were completed primarily to provide the volume and spatial distribution of mineralized material required for the PFS metallurgical testing program. In addition to supplying material for metallurgical testing, the drilling generated new geological and assay information that will support preparation of an updated mineral resource estimate for the PFS. Drill core intervals selected for metallurgical testing were split into half- and quarter-core samples, with half-core retained for metallurgical testing, one quarter retained for future reference and the remaining quarter submitted for assay in accordance with the Company’s standard analytical and quality assurance/quality control procedures.
Metallurgical samples were selected primarily on the basis of gold grade and grouped into low-, medium- and high-grade composites representing each of three five-year periods within the PEA mine schedule, resulting in nine bulk composites for evaluation. The PFS testwork is designed to assess potential variability in gold recovery across these grade ranges and mining periods. A more detailed assessment of metallurgical characteristics by lithology and mineralization style is expected to form part of a subsequent Feasibility Study, subject to successful completion of the PFS.
The drilling program has generated a total of 635 kilograms of mineralized material averaging 5.00 g/t Au from areas within the PEA mine plan, approximately 20% more than the minimum required for the planned testwork. An additional 185 kilograms of mineralized material averaging 6.92 g/t Au was collected from drilled intervals peripheral to the current MRE and PEA mine plan for potential use in the current and future metallurgical studies. In total, 820 kilograms of mineralized material has been delivered to Base Met’s testing facility where preparation of the bulk composites is underway. Initial results from the 2026 metallurgical testing program are expected in the latter half of the fourth quarter of 2026.
In addition to providing material for metallurgical testing, the seven holes contribute to the broader Fenelon infill drilling program now being ramped up to further de-risk the project through the conversion of Inferred mineral resources to Indicated classification for inclusion in the PFS mine plan and maiden mineral reserve estimate. All seven holes intersected gold mineralization, structural controls and host lithologies consistent with the current geological model for Fenelon, providing further confirmation of geological and grade continuity across the defined mineral resource.
Assay results from portions of the holes targeting the PEA mine plan returned multiple significant gold intercepts, including several broad and higher-grade intervals highlighted by 8.27 g/t Au over 16.4 metres in FAL-26-002A, 25.41 g/t Au over 3.6 metres in FAL-26-003 and 10.67 g/t Au over 5.0 metres in FAL-26-005. Additional higher-grade intervals were intersected outside the areas included in the PEA mine plan, including 52.30 g/t Au over 2.1 metres in FAL-26-001, 11.81 g/t Au over 3.6 metres in FAL-26-004 and 25.91 g/t Au over 1.6 metres in FAL-26-007. These intervals represent additional targets for follow-up evaluation within areas scheduled to be tested as part of the planned Fenelon infill drilling program.
The 2026 metallurgical program is one of several technical workstreams underway to support completion of the Fenelon PFS. Over the coming months, the Company plans to continue ramping up the larger Fenelon infill drilling program while advancing metallurgical, engineering and other technical trade-off studies aimed at further de-risking the project, upgrading mineral resources for inclusion in the PFS mine plan and supporting the development of a maiden mineral reserve estimate.
The table below provides a summary of significant assay highlights from the 2026 metallurgical drilling program at Fenelon:
| Fenelon Project 2026 PFS Metallurgical Drilling Highlights1 | ||||||
| DRILL HOLE | VG*2 | From3 | To3 | Length3, 4 | Au | |
| (m) | (m) | (m) | (g/t) | |||
| FAL-26-001 | * | 50.1 | 52.1 | 2.1 | 52.30 | |
| Including… | 50.1 | 50.6 | 0.5 | 3.72 | ||
| * | 50.6 | 52.1 | 1.6 | 67.97 | ||
| 79.3 | 82.0 | 2.8 | 6.49 | |||
| Including… | 79.3 | 80.0 | 0.8 | 12.50 | ||
| 80.0 | 80.6 | 0.6 | 0.43 | |||
| 80.6 | 82.0 | 1.4 | 5.87 | |||
| 298.0 | 299.0 | 1.0 | 11.90 | |||
| 318.8 | 327.5 | 8.7 | 2.06 | |||
| Including… | 318.8 | 320.5 | 1.7 | 5.41 | ||
| 320.5 | 324.5 | 4.0 | 0.43 | |||
| 324.5 | 327.0 | 2.5 | 1.23 | |||
| 327.0 | 327.5 | 0.5 | 7.90 | |||
| * | 333.5 | 335.9 | 2.4 | 2.72 | ||
| Including… | 333.5 | 334.6 | 1.1 | 3.59 | ||
| * | 335.4 | 335.9 | 0.5 | 5.48 | ||
| 341.0 | 342.3 | 1.3 | 5.28 | |||
| Including… | 341.0 | 341.6 | 0.6 | 9.45 | ||
| 341.6 | 342.3 | 0.7 | 1.70 | |||
| 374.0 | 375.0 | 1.0 | 9.08 | |||
| 455.1 | 458.2 | 3.1 | 4.96 | |||
| Including… | 455.1 | 456.0 | 1.0 | 3.45 | ||
| 456.0 | 458.2 | 2.2 | 5.61 | |||
| FAL-26-002A | 409.5 | 414.5 | 5.0 | 2.34 | ||
| Including… | 409.5 | 412.0 | 2.5 | 1.80 | ||
| 412.0 | 414.5 | 2.5 | 2.87 | |||
| 420.5 | 427.5 | 7.0 | 2.26 | |||
| Including… | 420.5 | 422.0 | 1.5 | 1.61 | ||
| 422.0 | 424.1 | 2.1 | 0.13 | |||
| 424.1 | 427.5 | 3.4 | 3.86 | |||
| 489.3 | 493.0 | 3.7 | 2.06 | |||
| Including… | 489.3 | 492.0 | 2.7 | 2.57 | ||
| 492.0 | 493.0 | 1.0 | 0.71 | |||
| * | 501.6 | 508.0 | 6.4 | 2.84 | ||
| Including… | 501.6 | 504.1 | 2.5 | 1.17 | ||
| * | 504.1 | 505.3 | 1.2 | 10.51 | ||
| 505.3 | 507.5 | 2.2 | 0.18 | |||
| * | 507.5 | 508.0 | 0.5 | 4.54 | ||
| * | 562.0 | 569.3 | 7.3 | 6.43 | ||
| Including… | 562.0 | 564.0 | 2.0 | 16.80 | ||
| * | 564.0 | 566.0 | 2.0 | 1.51 | ||
| 566.0 | 568.8 | 2.8 | 0.22 | |||
| * | 568.8 | 569.3 | 0.5 | 19.40 | ||
| * | 585.0 | 587.0 | 2.0 | 9.21 | ||
| 634.5 | 643.5 | 9.0 | 1.50 | |||
| Including… | 634.5 | 639.0 | 4.5 | 1.17 | ||
| 639.0 | 642.0 | 3.0 | 0.05 | |||
| 642.0 | 643.5 | 1.5 | 5.40 | |||
| 679.5 | 682.0 | 2.5 | 2.70 | |||
| * | 727.3 | 743.6 | 16.4 | 8.27 | ||
| Including… | 727.3 | 730.0 | 2.8 | 3.04 | ||
| 730.0 | 731.0 | 1.0 | 20.10 | |||
| 731.0 | 732.4 | 1.4 | 1.56 | |||
| * | 732.4 | 733.5 | 1.1 | 32.16 | ||
| 733.5 | 734.6 | 1.1 | 0.02 | |||
| * | 734.6 | 741.5 | 6.9 | 7.72 | ||
| 741.5 | 742.2 | 0.7 | 0.02 | |||
| 742.2 | 743.6 | 1.4 | 11.34 | |||
| FAL-26-003 | 445.9 | 448.3 | 2.4 | 3.33 | ||
| Including… | 445.9 | 447.4 | 1.5 | 1.49 | ||
| 447.4 | 448.3 | 0.9 | 6.23 | |||
| 491.8 | 495.6 | 3.8 | 3.18 | |||
| Including… | 491.8 | 492.9 | 1.1 | 8.33 | ||
| 492.9 | 495.6 | 2.8 | 1.21 | |||
| 579.0 | 580.9 | 1.9 | 4.32 | |||
| 598.0 | 599.7 | 1.6 | 7.89 | |||
| 649.0 | 655.0 | 6.0 | 5.21 | |||
| Including… | 649.0 | 651.0 | 2.0 | 1.29 | ||
| 651.0 | 652.3 | 1.3 | 10.23 | |||
| 652.3 | 653.0 | 0.7 | 1.00 | |||
| 653.0 | 653.6 | 0.6 | 19.70 | |||
| 653.6 | 655.0 | 1.4 | 2.03 | |||
| 657.4 | 661.0 | 3.6 | 25.41 | |||
| Including… | 657.4 | 658.0 | 0.6 | 17.80 | ||
| 658.0 | 659.0 | 1.0 | 63.90 | |||
| 659.0 | 661.0 | 2.0 | 8.46 | |||
| FAL-26-004 | 118.0 | 121.0 | 3.0 | 1.95 | ||
| 148.5 | 150.5 | 2.0 | 2.93 | |||
| 261.5 | 263.5 | 2.0 | 6.18 | |||
| 314.0 | 317.6 | 3.6 | 11.81 | |||
| Including… | 314.0 | 316.0 | 2.0 | 2.05 | ||
| 316.0 | 316.8 | 0.8 | 46.30 | |||
| 316.8 | 317.6 | 0.8 | 1.04 | |||
| 329.0 | 331.0 | 2.0 | 9.89 | |||
| 349.5 | 351.6 | 2.1 | 2.67 | |||
| 368.5 | 370.5 | 2.0 | 3.65 | |||
| 529.0 | 532.0 | 3.0 | 3.30 | |||
| Including… | 529.0 | 530.0 | 1.0 | 6.92 | ||
| 530.0 | 532.0 | 2.0 | 1.49 | |||
| * | 552.5 | 558.8 | 6.3 | 2.22 | ||
| 552.5 | 558.3 | 5.8 | 1.68 | |||
| * | 558.3 | 558.8 | 0.5 | 8.45 | ||
| FAL-26-005 | 148.0 | 152.0 | 4.0 | 4.03 | ||
| Including… | 148.0 | 149.3 | 1.3 | 10.42 | ||
| 149.3 | 151.0 | 1.7 | 0.19 | |||
| 151.0 | 152.0 | 1.0 | 2.25 | |||
| * | 159.4 | 161.5 | 2.2 | 9.73 | ||
| Including..* | 159.4 | 160.0 | 0.7 | 1.78 | ||
| 160.0 | 161.5 | 1.5 | 13.17 | |||
| * | 171.0 | 176.0 | 5.0 | 10.67 | ||
| Including… | 171.0 | 172.0 | 1.0 | 1.72 | ||
| * | 172.0 | 174.0 | 2.0 | 21.30 | ||
| 174.0 | 176.0 | 2.0 | 4.51 | |||
| FAL-26-006 | 72.9 | 75.2 | 2.4 | 9.47 | ||
| Including… | 72.9 | 73.7 | 0.9 | 12.90 | ||
| 73.7 | 75.2 | 1.5 | 7.53 | |||
| 118.7 | 120.6 | 1.9 | 5.12 | |||
| * | 122.3 | 124.0 | 1.7 | 3.70 | ||
| 130.0 | 131.8 | 1.8 | 3.21 | |||
| 163.0 | 165.0 | 2.0 | 19.88 | |||
| FAL-26-007 | * | 178.4 | 180.0 | 1.6 | 25.91 | |
| Notes | ||||||
| 1 | Highlighted assay composites have been selected based on meeting at least 3 of the following 4 criteria:
|
|||||
| 2 | Asterisk * denotes interval with visible gold (VG) observed in drill core | |||||
| 3 | Reported drill hole depths and interval lengths have been rounded to the nearest 0.1 metres. As a result, interval lengths may vary slightly from differences calculated directly from drill hole depths reported here. | |||||
| 4 | True widths are estimated to be within 70-90% of the reported core length intervals. | |||||
For more information, please refer to the links below for a drill hole location map, representative cross sections, and assay summaries of complete drill holes.
Fenelon Gold Project- 2026 Metallurgical Drill Hole Location Map Plan View
Fenelon Gold Project- 2026 Metallurgical Cross-Section FAL-26-004 A-A’
Fenelon Gold Project- 2026 Metallurgical Cross-Section FAL-26-002 & 003 B-B’
Fenelon Gold Project- 2026 Metallurgical Cross-Section FAL-26-001 C-C’
Fenelon Gold Project- 2026 Metallurgical Cross-Section FAL-26-005 D-D’
Fenelon Gold Project- 2026 Metallurgical Cross-Section FAL-26-006 E-E’
Fenelon Gold Project- 2026 Metallurgical Cross-Section FAL-26-007 F-F’
Fenelon Gold Project- 2026 PFS Metallurgical Drilling Assay Summary and Drill Hole Location Information
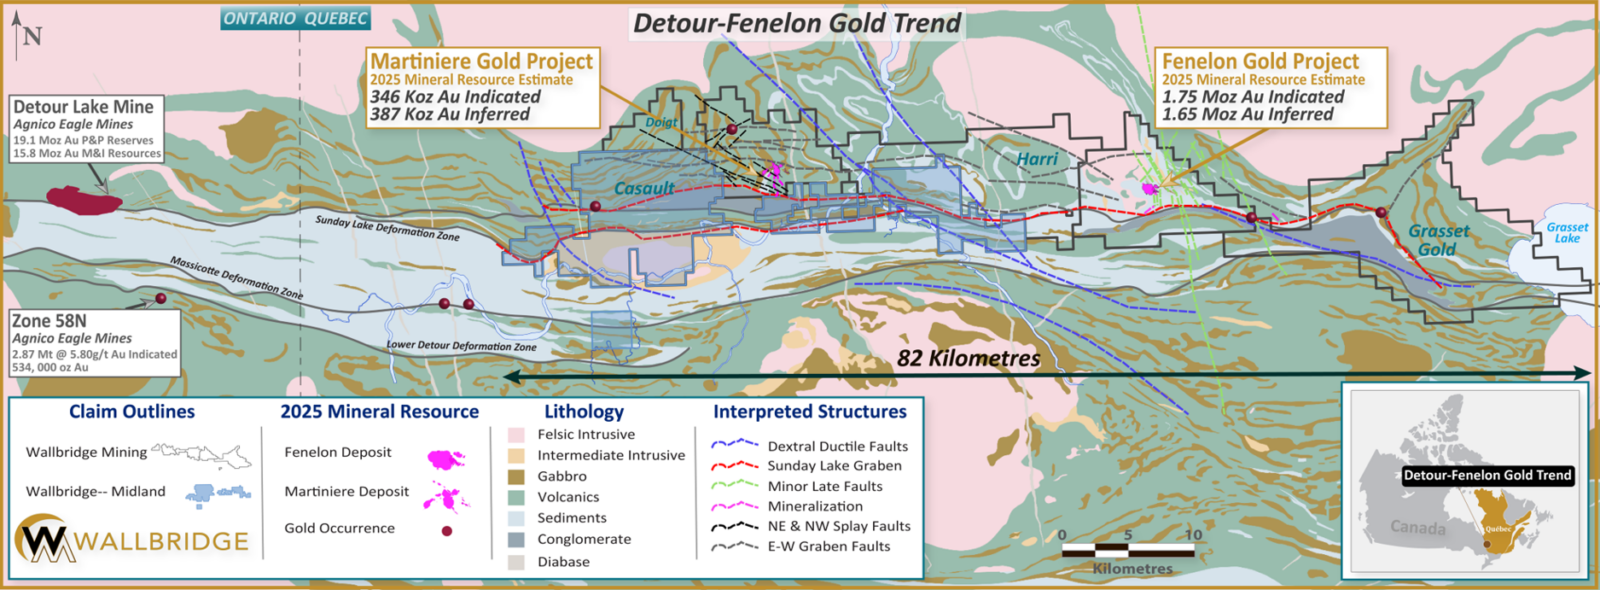
The Fenelon Gold Project is the Company’s flagship PEA-stage asset, located within its approximately 600 km² Detour-Fenelon Gold Trend property in the northern Abitibi region of Quebec. Fenelon lies approximately 30 kilometres east of the Company’s exploration-stage Martiniere Gold Project and 80 kilometres east of Agnico Eagle’s Detour Lake mine, Canada’s largest producing gold mine.
Quality Assurance / Quality Control
Wallbridge maintains a Quality Assurance/Quality Control program for all its exploration projects using industry best practices. Key elements of the QA/QC program include verifiable chain of custody for samples, regular insertion of blanks and certified reference materials, and completion of secondary check analyses performed at a separate independent accredited laboratory. Drill core is halved, sampled, and shipped in sealed bags to Activation Laboratories Ltd. in Val d’Or, Quebec, where samples are routinely analysed via fire assay with atomic absorption spectroscopy (‘AAS’) finish methods. For greater precision and accuracy, samples assaying 10 g/t Au or greater are re-distributed to other ActLabs facilities where they are re-assayed via metallic screen fire assay or fire assay/gravimetric finish, depending on the amount of sample material remaining available. Samples containing visible gold are routinely submitted directly for analysis by metallic screen fire assay method. ActLabs operates under a Quality Management System that conforms to the requirements of ISO/IEC 17025.
Qualified Person
The Qualified Person responsible for the technical content of this news release is Mr. Mark A. Petersen M.Sc., P.Geo. (OGQ AS-10796; PGO 3069), Senior Exploration Consultant for Wallbridge.
About Wallbridge Mining
Wallbridge is focused on creating value through the exploration and sustainable development of gold projects in Quebec’s Abitibi region while respecting the environment and communities where it operates. The Company holds a contiguous mineral property position totaling 598 square kilometres that extends approximately 82 kilometres along the Detour-Fenelon gold trend. The land position is host to the Company’s flagship PEA stage Fenelon Gold Project, and its earlier exploration stage Martiniere Gold Project, as well as numerous greenfield gold projects.
Brutus Mining Inc. (CSE: BRU) (FSE: ZI3) is pleased to announce that it has closed its non-brokered ... READ MORE
Jaguar Uranium Corp. (NYSE American: JAGU) is pleased to announce an independent Mineral Resource E... READ MORE
Auro Metals Inc. (TSX-V: AURO) (OTCQB: AURFF), is pleased to announce the assay results of the fina... READ MORE
Endeavour Silver Corp. (NYSE: EXK) (TSX: EDR) is pleased to announce that repairs to the primary bal... READ MORE
Scorpio Gold Corp. (NASDAQ: SGLD) (TSX-V: SGLD) (OTCQB: SRCRF) (FSE: RY9) is pleased to announce re... READ MORE





