








| 5th largest rare earth deposit in North America by Measured & Indicated tonnage* |
122.4 Mt Indicated resource, up 116% since February 2026 |
+140% at 1.00% TREO Indicated high-grade core, now 27.6 Mt |
1st supplementary gallium estimate at Springer |
HIGHLIGHTS
Volta Metals Ltd. (CSE: VLTA) (OTCQB: VOLMF) (FSE: D0W) announces a substantially expanded Mineral Resource estimate for its Springer Rare Earth Element and Gallium Deposit near Sturgeon Falls, Ontario, in which Volta holds a 100% interest. Prepared independently by SLR Consulting (Canada) Ltd. and effective September 30, 2026, the MRE includes all 13 holes (5,445 m) from the 2026 drill program and, for the first time, a supplementary gallium estimate.
“We more than doubled our Indicated resource, grew our high-grade core by 140% and delivered our first gallium estimate. Next, we’re working to advance gallium recovery and deliver a strong PEA in the first half of 2027. We believe Springer is shaping up as one of the few large, road-accessible sources of magnet rare earths, and potentially gallium, in North America, at a time when the market is paying a premium for supply from outside China,” said Kerem Usenmez, President and CEO of Volta.
* Ranked by Measured and Indicated tonnage, including Reserves, of North American rare earth projects (S&P Global Market Intelligence database, May 2025), with Springer updated to this MRE. Inferred resources are excluded. See Figure 1 and “Cautionary Statements”.
1 Non-base sensitivity case (Table 2). Not a separate Mineral Resource estimate or an economic evaluation.
2 Supplementary estimate within the rare earth Mineral Resource volumes (Table 6); not a standalone gallium Mineral Resource. In situ, not recovered or payable metal. Excluded from the NMR, cut-off, pit optimization and RPEEE until recovery and payability are established.
3 From the conceptual optimized pit shell used to demonstrate RPEEE; not a mine design, production plan or economic result.
Economic Basis of the Mineral Resource Estimate. The economic basis of the current MRE is limited to the four rare earth oxides comprising MREO: Pr₆O₁₁, Nd₂O₃, Dy₂O₃, and Tb₄O₇. These are the only rare earth oxides assigned value in the NMR calculation used to determine the reporting cut-off and optimized pit constraint and to support Reasonable Prospects for Eventual Economic Extraction (“RPEEE”). The other rare earth oxides and gallium have been modelled and estimated but are assigned no economic value in the current MRE. Ongoing metallurgical test work is evaluating the potential for gallium production. Gallium or other rare earth oxides could be included in the economic basis of a future MRE if sufficient metallurgical recovery, processing cost, product, payability, and market support are established.
WHY IT MATTERS: THE WEST NEEDS MAGNET METALS AND GALLIUM FROM OUTSIDE CHINA
| Mineral | Main uses | Supply and market (S&P Global, August 2026) | Springer (Indicated) |
| Neodymium and praseodymium (NdPr) | Permanent magnets for EVs, wind turbines, robotics, electronics and defence systems. | China supplies about 84% of neodymium-praseodymium (“NdPr”) oxide. Demand projected to grow from 108,000 t (2025) to 143,000 t (2030). NdPr oxide rose from about US$74/kg (Dec 2025) to about US$150/kg (mid-2026), based on Platts pricing. In July 2025, the U.S. Department of Defense set a US$110/kg NdPr price floor with MP Materials. In March 2026, Japan Australia Rare Earths (JARE), backed by Japan’s state agency JOGMEC, agreed a US$110/kg NdPr price floor with Lynas Rare Earths on 5,000 t per year through 2038. Australia is considering floor prices through offtakes for its A$1.2 billion critical minerals strategic reserve, which prioritizes rare earths and gallium, and in June 2026 the G7 agreed to explore price floors. | 27.6 Mt high-grade core at 1.00% TREO, with 495 g/t praseodymium oxide (“Pr₆O₁₁”) and 1,683 g/t neodymium oxide (“Nd₂O₃”). Overall, 122.4 Mt at 0.59% TREO (Table 1). |
| Dysprosium and terbium (heavy rare earths) | Keep magnets working at high temperatures in EV motors, wind turbines and defence systems. | China dominates heavy rare earth separation and placed rare earth magnets and related products under export licensing in April 2025. In June 2026, G7 leaders set a goal of reducing dependence on any single supplier outside the G7 and partner countries to below 60% for rare earths and permanent magnets by 2030. | 63 g/t Dy₂O₃ and 14 g/t Tb₄O₇ in the 27.6 Mt high-grade core (Table 1). HREO is about 5.5% of Indicated TREO (Table 3). |
| Gallium | Semiconductors for radar, 5G, power electronics, AI data centres and LEDs. Also used in magnets. | China produces approximately 99% of primary gallium; supply outside China is about 5 t/year. Demand projected to grow about 12% a year to 1,738 t by 2030. Prices outside China reached about US$2,100/kg in 2026, roughly seven times 2023 levels, versus about US$300/kg inside China. | 14.8 Mt at 56 g/t Ga in the Ga High Grade domain (approximately 75 g/t Ga₂O₃), 36 g/t Ga on average across the resource, about 4,427 t of in-situ gallium in the Indicated category (Table 6). |
All three are designated critical minerals in Canada, the United States and the European Union, and governments are now funding supply outside China. In 2026, the Government of Canada committed up to C$400 million to support Teck’s Trail operations expansion, targeting gallium, germanium and antimony, and conditionally approved up to C$18.95 million for a Rio Tinto and Indium Corporation gallium pilot plant. Even if every announced project outside China is built, S&P Global estimates the market outside China would still be short of gallium in 2030. Market figures are third-party estimates (S&P Global, August 2026; USGS). Price floor information is from Lynas Rare Earths (ASX announcement, March 10, 2026), the Government of Australia and the G7 Leaders’ Declaration on Critical Minerals (June 17, 2026). Contained gallium is in situ and does not represent recovered or payable metal.
WHAT’S NEXT: DRILLING, METALLURGY AND A PEA
Volta is advancing Springer through a focused exploration and technical development program designed to expand its high-grade resource, evaluate gallium recovery and establish the Deposit’s preliminary economic potential.
| READING THE NUMBERS
TREO (total rare earth oxides) is the standard measure of rare earth content. 1.00% TREO = 10 kg of rare earth oxides per tonne of rock. MREO (magnet rare earth oxides) is the sum of the praseodymium, neodymium, dysprosium and terbium oxides, the four used in permanent magnets and the only four assigned values in this MRE. MREO as a % of TREO shows how much of the rare earth content is magnet metals. HREO (heavy rare earth oxides) includes dysprosium (Dy), terbium (Tb) and yttrium (Y), among others, which are scarcer and mostly separated in China. g/t = grams per tonne, the same as parts per million (ppm). Previous Volta drill results reported gallium as Ga₂O₃; multiply g/t Ga by 1.3442 to convert to g/t Ga₂O₃. NMR (net metal revenue) is the estimated value per tonne from the four magnet rare earth oxides and is used only to decide which blocks are included in the resource. Indicated Mineral Resources have closer drilling and higher confidence than Inferred Mineral Resources. Mineral Resources are not Mineral Reserves and do not have demonstrated economic viability. |
DETAILS
Springer Among North America’s Largest Rare Earth Deposits
With 122.4 Mt of Indicated Mineral Resources, Springer ranks fifth among North American rare earth projects by combined Measured and Indicated resource tonnage, based on the S&P Global Market Intelligence database (Figure 1). Inferred Mineral Resources are shown separately for context and are excluded from the ranking. The comparison is based on resource tonnage and does not account for differences in grade, cut-off criteria, reporting standards, effective dates, commodity mix, metallurgical assumptions, infrastructure, development stage, or project economics.
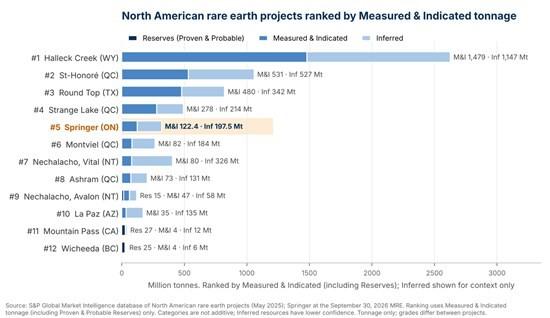
Figure 1. North American rare earth projects ranked by Measured and Indicated tonnage, including Reserves where reported. Inferred tonnage is shown separately for context and is not used in the ranking (S&P Global Market Intelligence database, May 2025; Springer at the September 30, 2026 MRE).
Springer at a Glance
| Item | Detail |
| Location | About 70 km east of Sudbury and 8 km north of Sturgeon Falls, Ontario, on the traditional territory of the Nipissing First Nation. |
| Property | 4,879 hectares. Volta holds a 100% interest in the Springer Property. |
| Access and infrastructure | Trans-Canada Highway and Highway 64, paved roads, on-site power lines fed from the Crystal Falls hydroelectric dam, natural gas pipeline and Canadian National Railway service, all within 8 km of the deposit. |
| Drilling in the MRE | The project dataset comprises 39 drill holes from the 2011-2012, 2025, and 2026 programs, including 13 holes (5,445 m) drilled in 2026. Of these, 38 drill holes were included in the MRE dataset. Drill hole SL-11-07 was excluded because it is spatially isolated from the drilling that defines the deposit. |
| Resource shape | Open pit reporting shell with a low strip ratio of 1.26 tonnes of waste per tonne of mineralized material. |
| Rare earth resource | Indicated Mineral Resource of 122.4 Mt grading 0.59% TREO, including a higher-grade core of 27.6 Mt grading 1.00% TREO. Inferred Mineral Resource of 197.5 Mt at 0.53% TREO, including 26.7 Mt grading 0.94% TREO. |
| Supplementary gallium | 36 g/t Ga across the resource, including 14.8 Mt grading 56 g/t Ga (Indicated) and 19.6 Mt grading 53 g/t Ga (Inferred) in the Ga High Grade domain. |
| Next steps | Drilling to expand the high-grade rare earth and gallium zones, ongoing metallurgical test work, and a PEA targeted for the first half of 2027. |
Updated Mineral Resource Estimate
SLR Consulting (Canada) Ltd. (SLR) prepared an updated rare earth Mineral Resource estimate (MRE) for Volta Metals Ltd. (Volta) for the Springer Rare Earth Element and Gallium Deposit in Ontario, with an effective date of September 30, 2026. Indicated Mineral Resources total 122.4 Mt at an average net metal revenue (NMR) of C$223/t, grading 0.59% total rare earth oxides (TREO), and 0.13% magnet rare earth oxides (MREO), including 293 g/t Pr₆O₁₁, 993 g/t Nd₂O₃, 33 g/t Dy₂O₃, and 8 g/t Tb₄O₇. Inferred Mineral Resources total 197.5 Mt at an average NMR of C$191/t, grading 0.53% TREO, and 0.11% MREO, including 258 g/t Pr₆O₁₁, 856 g/t Nd₂O₃, 27 g/t Dy₂O₃, and 6 g/t Tb₄O₇. The supplementary gallium estimate within the Indicated Mineral Resource volume averages 36 g/t Ga, including 14.8 Mt grading 56 g/t Ga in the Ga High Grade domain. The supplementary gallium estimate within the Inferred Mineral Resource volume also averages 36 g/t Ga, including 19.6 Mt grading 53 g/t Ga in the Ga High Grade domain. Gallium is assigned no economic value because available metallurgical test work has not established overall recovery to a saleable gallium product, processing costs, or commercial payability. Additional metallurgical test work is in progress.
TREO is the compositional total of the 15 rare earth oxides listed in the notes to Table 1. MREO is the sum of Pr₆O₁₁, Nd₂O₃, Dy₂O₃, and Tb₄O₇, expressed as a percentage. The rare earth Mineral Resource estimate is based on drilling and assay data available as of August 21, 2026 and is classified in accordance with the CIM Definition Standards for Mineral Resources and Mineral Reserves (May 2014). Reasonable prospects for eventual economic extraction (RPEEE) were demonstrated for the rare earth Mineral Resources by constraining the estimate within an optimized open pit shell and reporting blocks above a C$43/t NMR cut-off.
NMR is the estimated value per tonne calculated from four rare earth oxides: praseodymium oxide (Pr₆O₁₁), neodymium oxide (Nd₂O₃), dysprosium oxide (Dy₂O₃), and terbium oxide (Tb₄O₇). These four oxides comprise MREO and are the only rare earth oxides included in the pricing and recovery assumptions used to determine the reporting cut-off and pit constraint. TREO is a compositional total that also includes rare earth oxides that are not assigned value in the NMR calculation. Gallium is not included in the NMR calculation, reporting cut-off, pit optimization, or RPEEE assessment.
Table 1 summarizes the open pit rare earth Mineral Resources by classification and the High Grade and Main estimation domains. Table 2 presents block model sensitivities within the same optimized open pit shell at selected NMR cut-off values; C$43/t is the reporting cut-off, and the other cut-off values are non-base sensitivity cases. Table 3 reports the average grades of all rare earth oxides (REOs), including light rare earth oxides (LREO) and heavy rare earth oxides (HREO), within the Mineral Resources by classification. Table 4 presents the assumptions used to calculate NMR. Table 5 compares the current and previous open pit Mineral Resource estimates by classification and domain. Table 6 reports supplementary gallium grades and in situ content within the open pit reporting constraints and C$43/t NMR cut-off of the rare earth Mineral Resources reported in Table 1.
Table 1: Summary of the Springer Open Pit Mineral Resources, September 30, 2026
| Classification | Domain | Tonnage (Mt) |
NMR (C$/t) |
Grade | |||||
| TREO (%) |
MREO (%) |
Pr₆O₁₁ (g/t) |
Nd₂O₃ (g/t) |
Dy₂O₃ (g/t) |
Tb₄O₇ (g/t) |
||||
| Indicated | High Grade | 27.6 | 384 | 1.00 | 0.23 | 495 | 1,683 | 63 | 14 |
| Main | 94.8 | 176 | 0.47 | 0.11 | 234 | 792 | 24 | 6 | |
| Total | 122.4 | 223 | 0.59 | 0.13 | 293 | 993 | 33 | 8 | |
| Inferred | High Grade | 26.7 | 333 | 0.94 | 0.20 | 464 | 1,507 | 43 | 10 |
| Main | 170.8 | 169 | 0.46 | 0.10 | 226 | 754 | 24 | 6 | |
| Total | 197.5 | 191 | 0.53 | 0.11 | 258 | 856 | 27 | 6 | |
MREO represents approximately 22.4% of TREO in the Indicated Mineral Resources and approximately 21.7% of TREO in the Inferred Mineral Resources.
Notes:
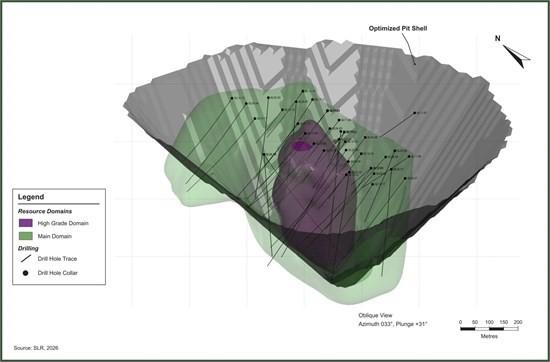
Figure 2. Springer rare earth resource domains, High Grade and Main, within the optimized pit shell, oblique view (Source: SLR, 2026).
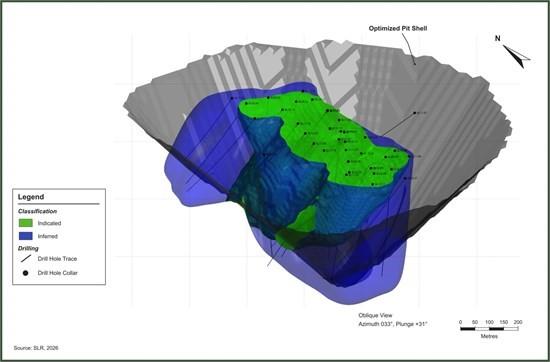
Figure 3. Springer Mineral Resource classification, Indicated (green) and Inferred (blue), within the optimized pit shell, oblique view (Source: SLR, 2026).
Sensitivity to Cut-off
Table 2 presents block model sensitivities within the same optimized open pit shell at selected NMR cut-off values. The C$43/t NMR cut-off is the reporting cut-off used for the Mineral Resource estimate; all other cut-off values are non-base sensitivity cases. As the cut-off increases, lower-value blocks are excluded, and the reported tonnage decreases, while average NMR and grades generally increase. The non-base cases are provided solely to illustrate sensitivity to the selection of a reporting cut-off and are not separate Mineral Resource estimates, alternative project cases, production targets, or economic evaluations. The sensitivity results do not account for changes to the optimized pit shell, mine design, mining sequence, dilution, recovery, operating costs, commodity prices, or other modifying factors that could apply at a different cut-off value.
Table 2: Open Pit Mineral Resource Sensitivity to NMR Cut-off Value
| Classification | NMR Cut-off (C$/t) |
Average Value and Grade | ||||||||||||||||||||||||
| Mass (Mt) |
NMR (C$/t) |
TREO (%) |
MREO (%) |
Pr₆O₁₁ (g/t) |
Nd₂O₃ (g/t) |
Dy₂O₃ (g/t) |
Tb₄O₇ (g/t) |
|||||||||||||||||||
| Indicated | ≥150 | 83.7 | 272 | 0.72 | 0.16 | 358 | 1,214 | 40 | 9 | |||||||||||||||||
| ≥100 | 114.1 | 233 | 0.62 | 0.14 | 306 | 1,039 | 34 | 8 | ||||||||||||||||||
| ≥80 | 119.9 | 226 | 0.60 | 0.13 | 297 | 1,008 | 34 | 8 | ||||||||||||||||||
| ≥60 | 122.2 | 224 | 0.59 | 0.13 | 293 | 995 | 33 | 8 | ||||||||||||||||||
| ≥43 | 122.4 | 223 | 0.59 | 0.13 | 293 | 993 | 33 | 8 | ||||||||||||||||||
| Inferred | ≥150 | 125.7 | 234 | 0.65 | 0.14 | 319 | 1,054 | 31 | 8 | |||||||||||||||||
| ≥100 | 179.2 | 202 | 0.56 | 0.12 | 274 | 907 | 28 | 7 | ||||||||||||||||||
| ≥80 | 190.6 | 196 | 0. | .12 | 265 | 876 | 27 | 7 | ||||||||||||||||||
| ≥60 | 196.4 | 192 | 0.53 | 0.12 | 259 | 859 | 27 | 6 | ||||||||||||||||||
| ≥43 | 197.5 | 191 | 0.53 | 0.11 | 258 | 856 | 27 | 6 | ||||||||||||||||||
Notes:
Table 3: Springer Open Pit Mineral Resource Tonnage and Average Rare Earth Oxide Grades, September 30, 2026
| Parameter | Unit | Indicated | Inferred |
| Tonnage | Mt | 122.4 | 197.5 |
| TREO | % | 0.59 | 0.53 |
| MREO | % | 0.13 | 0.11 |
| MREO / TREO | % | 22.4 | 21.7 |
| LREO | % | 0.56 | 0.50 |
| HREO | % | 0.03 | 0.03 |
| La₂O₃ | g/t | 1,426 | 1,290 |
| CeO₂ | g/t | 2,757 | 2,497 |
| Pr₆O₁₁ | g/t | 293 | 258 |
| Nd₂O₃ | g/t | 993 | 856 |
| Sm₂O₃ | g/t | 134 | 116 |
| Eu₂O₃ | g/t | 31 | 26 |
| Gd₂O₃ | g/t | 76 | 66 |
| Dy₂O₃ | g/t | 33 | 27 |
| Tb₄O₇ | g/t | 8 | 6 |
| Ho₂O₃ | g/t | 5 | 4 |
| Tm₂O₃ | g/t | 1 | 1 |
| Er₂O₃ | g/t | 12 | 10 |
| Yb₂O₃ | g/t | 8 | 7 |
| Lu₂O₃ | g/t | 1 | 1 |
| Y₂O₃ | g/t | 151 | 120 |
Notes:
Rare Earth Estimation Methodology
The updated estimate incorporates drilling and assay data available up to August 21, 2026, including data from the 2011-2012, 2025, and 2026 drilling programs. The resource dataset comprises 8,020 assay intervals from 38 drill holes, 4,089 rare earth element (REE) composites, and 548 density measurements. The updated interpretation includes revised High Grade and Main REE domains and an updated overburden surface. Overburden is excluded from the mineralized bedrock estimate.
Geological interpretation and block modelling were completed in Leapfrog Geo and Edge. Two nested wireframe domains, High Grade and Main, were developed using the combined grades of the four economic rare earth elements, Pr, Nd, Dy, and Tb. The High Grade domain is a continuous interpreted zone of higher-grade mineralization defined by a nominal combined Pr, Nd, Dy, and Tb grade of 0.125%. The rare earth elements were estimated separately in the two domains using ordinary kriging and variogram models that reflect spatial continuity. The model uses 20 m × 20 m × 12 m parent blocks, with sub-blocking to a minimum of 5 m × 5 m × 3 m, and assays were composited to nominal 3.0 m lengths within the estimation domains. Unsampled intervals were excluded from compositing because no analytical result was available. The unsampled interval inventory is retained for follow-up sampling, and applicable results will be incorporated into a future Mineral Resource estimate.
Grade estimation used two search passes of 90 m and 180 m in the High Grade domain and an additional 240 m pass in the Main domain. The first pass required nine to 16 composites, and subsequent passes required five to 16 composites. A maximum of four composites per drill hole was applied in the first two passes. A 20 m soft boundary allowed limited sample sharing between the resource domains. No global assay cap was applied. In the second and third passes of the Main domain, the influence of elevated Pr, Nd, Dy, and Tb composite grades was restricted beyond approximately 60 m using grade thresholds of 450 g/t, 1,350 g/t, 40 g/t, and 10 g/t, respectively. These local restrictions limit high grade extrapolation rather than cap all assays or block grades.
Bulk density was estimated by inverse distance squared interpolation within the combined High Grade and Main resource domains using two 250 m searches and three to 12 samples. The first pass used a maximum of two samples per drill hole. Unestimated blocks within the combined resource domains and bedrock outside the resource domains were assigned a density of 2.70 t/m³. Overburden was assigned a density of 1.80 t/m³. Model validation included comparisons with composite grades and nearest-neighbour estimates, grade-distribution checks, and spatial swath comparisons. Historical density measurements from the 2011-2012 program were obtained in the field and are not supported by laboratory density certificates; this limitation was considered in assessing the density data used for the Mineral Resource estimate.
Resource classification considered geological and grade continuity, data quality, estimation support, and drill hole spacing. Indicated Mineral Resources are supported by a maximum drill hole spacing of 100 m. Inferred Mineral Resources are supported by drill hole spacing of up to approximately 200 m. Inferred Mineral Resources have a lower level of confidence than Indicated Mineral Resources and cannot be converted directly to Mineral Reserves. There is no certainty that further drilling will upgrade all Inferred Mineral Resources.
Analytical Methods and Data Verification
Recent drill core samples were analyzed by Activation Laboratories Ltd. (Actlabs) in Ancaster, Ontario, and SRC Geoanalytical Laboratories (SRC) in Saskatoon, Saskatchewan. Actlabs used fusion-based ICP-OES and ICP-MS methods for REE analyses, while SRC used lithium metaborate fusion with ICP-MS. Gallium grades used for estimation are based on the SRC assays rather than the Actlabs results. Gallium was measured analytically and was not derived from regression against zinc or aluminum. Laboratory certificates include analytical quality control results.
Quality assurance and quality control review by SLR covered the 2011-2012 and 2025-2026 drilling and analytical datasets. The program included certified reference materials, blanks, field duplicates, and laboratory controls and repeats. Control results were reviewed for accuracy, contamination, and precision, with repeat analyses and geological review used to investigate discrepancies. Verification included selected comparisons of database records with laboratory results and did not include independent reanalysis of every sample.
Ms. Katharine Masun, M.Sc., MSA, P.Geo., of SLR reviewed the sampling, analytical, and QA/QC data and considers them adequate for the Mineral Resource estimate and the supplementary gallium estimate. The limitations associated with historical density measurements and preliminary metallurgical assumptions are described in this news release.
Reasonable Prospects for Eventual Economic Extraction
RPEEE were assessed for the open pit rare earth Mineral Resources using a Whittle optimized open pit shell, a revenue factor of 1.0, and a C$43/t NMR cut-off. The shell incorporates a mining cost of C$4.00/t moved, an overall pit slope angle of 50°, and a strip ratio of 1.26. The reporting shell is a conceptual constraint for Mineral Resource reporting and does not constitute a mine design or establish economic viability.
Table 4: Assumptions Used to Calculate Net Metal Revenue
| Rare earth oxide | Price (US$/kg oxide) |
Recovery (%) |
Separation deduction (%) |
NMR factor (C$/t per g/t oxide) |
| Pr₆O₁₁ | 160 | 82.1 | 15 | 0.151 |
| Nd₂O₃ | 150 | 82.1 | 15 | 0.141 |
| Dy₂O₃ | 900 | 69.5 | 25 | 0.633 |
| Tb₄O₇ | 3,000 | 75.4 | 25 | 2.290 |
An exchange rate of C$1.35 per US$1.00 is used. Separation deductions are 15% for Pr₆O₁₁ and Nd₂O₃, and 25% for Dy₂O₃ and Tb₄O₇. No royalty is applied in the NMR calculation.
NMR factors are rounded to three decimal places, and the rounded factors were applied to calculate NMR in the block model.
Elemental block grades were converted to corresponding oxide grades. NMR was calculated for each block using the four oxide grades and the factors presented in Table 4. The factors incorporate the oxide price, exchange rate, assumed recovery, and separation deduction and were used solely to support the reporting cut-off and optimized pit constraint for the Mineral Resource estimate. No other rare earth oxide or gallium is included in the NMR calculation.
The four oxide grades are disclosed individually because they are the only REO grades assigned value in the NMR calculation used to support the reporting cut-off and optimized pit constraint. MREO, which is also reported in the Mineral Resource table, is the sum of Pr₆O₁₁, Nd₂O₃, Dy₂O₃, and Tb₄O₇, expressed as a percentage. No other REOs contribute to NMR.
As reported in Volta’s June 1, 2026 news release, the recovery assumptions are based on bench-scale test work completed by SGS Canada Inc. (SGS) on a single master composite from Springer. The results are preliminary and do not demonstrate recovery to a saleable product or consistent recovery across the deposit. Additional test work is required to confirm these assumptions. The separation deductions used in the Mineral Resource estimate are assumptions and not established commercial sales terms.
The estimate supersedes the Mineral Resource estimate effective December 31, 2025, disclosed on February 23, 2026. Changes include additional drilling, revised geological and estimation domains, local controls on high grade extrapolation, updated density estimation, revised recovery and oxide price assumptions, a new pit constraint, and the addition of a supplementary gallium estimate within the reported open pit Mineral Resource volumes. The current and previous estimates use different technical and economic assumptions; changes in reported tonnes and grades cannot be attributed solely to drilling.
The Mineral Resource estimate may be materially affected by environmental, permitting, legal, title, taxation, socio-political, marketing, or other relevant issues. The estimate is also sensitive to assumptions regarding metal prices, recoveries (based on preliminary test work), operating costs, and the geologic interpretation. Additional metallurgical test work is in progress and may affect future resource estimates.
Comparison to Previous Estimate
Table 5 compares the current September 30, 2026 open pit Mineral Resource estimate with the previous December 31, 2025 estimate by classification and domain. Indicated tonnage increased by 116%, from 56.6 Mt to 122.4 Mt, while Inferred tonnage increased by 65%, from 119.5 Mt to 197.5 Mt. The increase occurred in both the High Grade domain and the current Main domain, which was designated the Low Grade domain in the previous estimate.
The current estimate contains more tonnes at lower average TREO, MREO, and individual NMR-contributing rare earth oxide grades. Indicated TREO decreased from 0.70% to 0.59%, and Inferred TREO decreased from 0.58% to 0.53%. Indicated MREO decreased from 0.16% to 0.13%, and Inferred MREO decreased from 0.12% to 0.11%. For Indicated Mineral Resources, average Pr₆O₁₁, Nd₂O₃, Dy₂O₃, and Tb₄O₇ grades decreased by 15%, 16%, 13%, and 11%, respectively. For Inferred Mineral Resources, the corresponding grades decreased by 9%, 10%, 13%, and 14%, respectively. Despite the lower grades, average NMR increased from C$159/t to C$223/t for Indicated Mineral Resources and from C$128/t to C$191/t for Inferred Mineral Resources. The current and previous NMR values reflect different oxide prices, metallurgical recovery assumptions, separation deductions, domain interpretations, estimation parameters, and reporting constraints and should not be interpreted as a direct comparison of project economics.
The current Main domain, designated the Low Grade domain in the previous estimate, is not directly equivalent to the previous domain because the interpretation, geometry, estimation parameters, and reporting constraints have changed. The comparison also reflects additional 2026 drilling, revised geological and estimation domains, updated variography and search parameters, restrictions on high-grade extrapolation in the Main domain, updated density estimation, revised classification support, and a new optimized pit constraint. Therefore, the changes should not be viewed as a reconciliation limited to drilling.
Table 5: Comparison of Current and Previous Open Pit Mineral Resources by Classification and Domain
| Parameter | Domain | Indicated | Inferred | |||||||||||||||||||||
| Previous | Current | Change (%) | Previous | Current | Change (%) | |||||||||||||||||||
| Tonnage (Mt) | High Grade | 11.5 | 27.6 | +140 | 3.0 | 26.7 | +790 | |||||||||||||||||
| Main / Low Grade | 45.1 | 94.8 | +110 | 116.5 | 170.8 | +47 | ||||||||||||||||||
| Total | 56.6 | 122.4 | +116 | 119.5 | 197.5 | +65 | ||||||||||||||||||
| NMR (C$/t) | High Grade | 251 | 384 | +53 | 254 | 333 | +31 | |||||||||||||||||
| Main / Low Grade | 136 | 176 | +29 | 125 | 169 | +35 | ||||||||||||||||||
| Total | 159 | 223 | +40 | 128 | 191 | +49 | ||||||||||||||||||
| TREO (%) | High Grade | 1.10 | 1.00 | -9 | 1.16 | 0.94 | -19 | |||||||||||||||||
| Main / Low Grade | 0.60 | 0.47 | -22 | 0.57 | 0.46 | -19 | ||||||||||||||||||
| Total | 0.70 | 0.59 | -16 | 0.58 | 0.53 | -9 | ||||||||||||||||||
| MREO (%) | High Grade | 0.25 | 0.23 | -8 | 0.25 | 0.20 | -20 | |||||||||||||||||
| Main / Low Grade | 0.14 | 0.11 | -21 | 0. | .10 | -17 | ||||||||||||||||||
| Total | 0.16 | 0.13 | -19 | 0.12 | 0.11 | -8 | ||||||||||||||||||
| Pr₆O₁₁ (g/t) | High Grade | 540 | 495 | -8 | 559 | 464 | -17 | |||||||||||||||||
| Main / Low Grade | 296 | 234 | -21 | 275 | 226 | -18 | ||||||||||||||||||
| Total | 346 | 293 | -15 | 282 | 258 | -9 | ||||||||||||||||||
| Nd₂O₃ (g/t) | High Grade | 1,846 | 1,683 | -9 | 1,848 | 1,507 | -19 | |||||||||||||||||
| Main / Low Grade | 1,017 | 792 | -22 | 924 | 754 | -18 | ||||||||||||||||||
| Total | 1,185 | 993 | -16 | 947 | 856 | -10 | ||||||||||||||||||
| Dy₂O₃ (g/t) | High Grade | 68 | 63 | -7 | 70 | 43 | -39 | |||||||||||||||||
| Main / Low Grade | 30 | 24 | -20 | 30 | 24 | -20 | ||||||||||||||||||
| Total | 38 | 33 | -13 | 31 | 27 | -13 | ||||||||||||||||||
| Tb₄O₇ (g/t) | High Grade | 15 | 14 | -7 | 15 | 10 | -33 | |||||||||||||||||
| Main / Low Grade | 7 | 6 | -14 | 7 | 6 | -14 | ||||||||||||||||||
| Total | 9 | 8 | -11 | 7 | 6 | -14 | ||||||||||||||||||
Notes:
Supplementary Gallium Estimate
Table 6 presents a supplementary gallium estimate by nested Ga High Grade and Ga Main domains within the open pit reporting constraints and C$43/t NMR cut-off of the rare earth Mineral Resources. The combined volume of the nested Ga High Grade and Ga Main domains is equivalent to the combined volume of the High Grade and Main rare earth resource domains. The individual Ga High Grade and Ga Main domain volumes do not correspond directly to the individual rare earth resource domain volumes. The interpreted gallium mineralization does not extend beyond the combined rare earth resource domain volume; accordingly, no interpreted gallium mineralization outside that volume was excluded from the supplementary estimate.
The Indicated and Inferred classifications apply to the reported open pit Mineral Resources and not to a standalone gallium Mineral Resource. Gallium is assigned no economic value and does not contribute to the NMR calculation, reporting cut-off, pit optimization, or the RPEEE supporting the open pit Mineral Resources.
Table 6: Supplementary Gallium Estimate within the Reported Open Pit Mineral Resources, September 30, 2026
| Classification | Domain | Tonnage (Mt) |
Grade | Metal |
| Ga (g/t) |
Ga (t) |
|||
| Indicated | Ga High Grade | 14.8 | 56 | 836 |
| Ga Main | 107.6 | 33 | 3,591 | |
| Total | 122.4 | 36 | 4,427 | |
| Inferred | Ga High Grade | 19.6 | 53 | 1,030 |
| Ga Main | 177.9 | 35 | 6,176 | |
| Total | 197.5 | 36 | 7,206 |
Notes:
Gallium was estimated by ordinary kriging from nominal 3.0 m composites within two nested gallium grade domains, Ga High Grade and Ga Main, using gallium variography. The Ga High Grade domain was guided by a nominal threshold of 50 g/t Ga. The combined volume of the nested gallium domains corresponds to the combined High Grade and Main rare earth resource domain volume reported in Table 1. However, the individual gallium domains do not correspond directly to the individual rare earth resource domains. Grade estimation used search passes of 90 m, 180 m, and 240 m. A 20 m soft boundary allowed limited sample sharing between the gallium domains.
Initial bench-scale flotation test work identified gallium in both the rare earth concentrate and flotation tailings. The available test work is insufficient to establish overall recovery to a saleable gallium product, processing costs, commercial payability, or saleability. Additional metallurgical test work is in progress. Until these factors are demonstrated, gallium is assigned no economic value and is reported only as supplementary information within the open pit Mineral Resource volumes. Gallium is not reported as a standalone Mineral Resource or included in the RPEEE assessment, and there is no certainty that it will be recovered or sold.
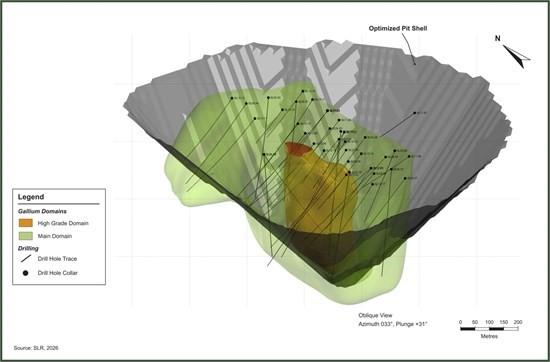
Figure 4. Springer gallium domains, Ga High Grade (orange) and Ga Main (green), within the optimized pit shell, oblique view (Source: SLR, 2026).
CAUTIONARY STATEMENTS
Mineral Resources are not Mineral Reserves and do not have demonstrated economic viability. Inferred Mineral Resources have a lower level of confidence than Indicated Mineral Resources, and there is no certainty that further drilling will upgrade them. The cut-off sensitivity cases in Table 2 are not separate Mineral Resource estimates, production targets or economic evaluations.
Gallium is reported only as a supplementary estimate within the rare earth Mineral Resource and is assigned no economic value. Metallurgical test work has not established overall recovery to a saleable gallium product, processing costs, commercial payability or saleability. There is no certainty that gallium will be recovered or sold, or that it will be assigned value in any future estimate.
The North American ranking is based on a third-party database dated May 2025 that may not reflect the most recent estimates of other projects. Those estimates were prepared by other parties under different reporting standards (NI 43-101, SEC S-K 1300 and JORC), cut-offs and assumptions, and are not directly comparable. The ranking compares tonnage only. Market information in this news release is from third-party sources and has not been independently verified by the Company. There is no assurance that the planned drilling will expand the high-grade zone or that the PEA will be completed within the anticipated timeframe.
Qualified Persons
The rare earth Mineral Resource estimate and supplementary gallium estimate disclosed in this news release were prepared by Ms. Katharine Masun, M.Sc., MSA, P.Geo., Principal Resource Geologist with SLR Consulting (Canada) Ltd., who is independent of Volta. Ms. Masun is a Qualified Person as defined by National Instrument 43-101. The rare earth Mineral Resources were classified in accordance with the CIM Definition Standards for Mineral Resources and Mineral Reserves (May 2014). Ms. Masun has reviewed and approved the scientific and technical information in this news release relating to the rare earth Mineral Resource estimate and supplementary gallium estimate.
Details of the Mineral Resource estimate will be disclosed in an independent technical report prepared in accordance with National Instrument 43-101 Standards of Disclosure for Mineral Projects by SLR Consulting (Canada) Ltd. The NI 43-101 Technical Report will be filed on SEDAR+ (www.sedarplus.ca) within 45 days of this news release.
Other scientific and technical information in this news release has been reviewed and approved by Dr. Julie Selway, P.Geo., VP Exploration, and a Qualified Person (“QP”) as defined in National Instrument 43-101, Standards of Disclosure for Mineral Projects.
ABOUT VOLTA METALS LTD.
Volta Metals Ltd. is a critical mineral exploration company focused on rare earths, gallium, lithium, cesium and tantalum in Ontario, one of the world’s most prolific emerging hard-rock critical mineral districts. Volta owns, has optioned and is exploring a portfolio of rare earth, gallium, lithium, cesium and tantalum projects in the province.
Volta’s flagship is the Springer Rare Earth Element and Gallium Deposit, within the 4,879-hectare Springer Property on the traditional territory of the Nipissing First Nation, about 8 km north of Sturgeon Falls and 70 km east of Sudbury, Ontario. The project has direct access via the Trans-Canada Highway and Highway 64, with paved roads, on-site power lines fed from the Crystal Falls hydroelectric dam, a natural gas pipeline and Canadian National Railway service, all within 8 km of the deposit.
Blue Moon Metals Inc. (TSX-V: MOON) (NASDAQ: BMM), is pleased t... READ MORE
HIGHLIGHTS: High Grade Panel 52.4 m grading 5.84 g/t gold from 46... READ MORE
Americas Gold and Silver Corporation (TSX: USA) (NYSE American: U... READ MORE
Strong Production of 16,685 Gold Equivalent Ounces for the 3rd Qu... READ MORE